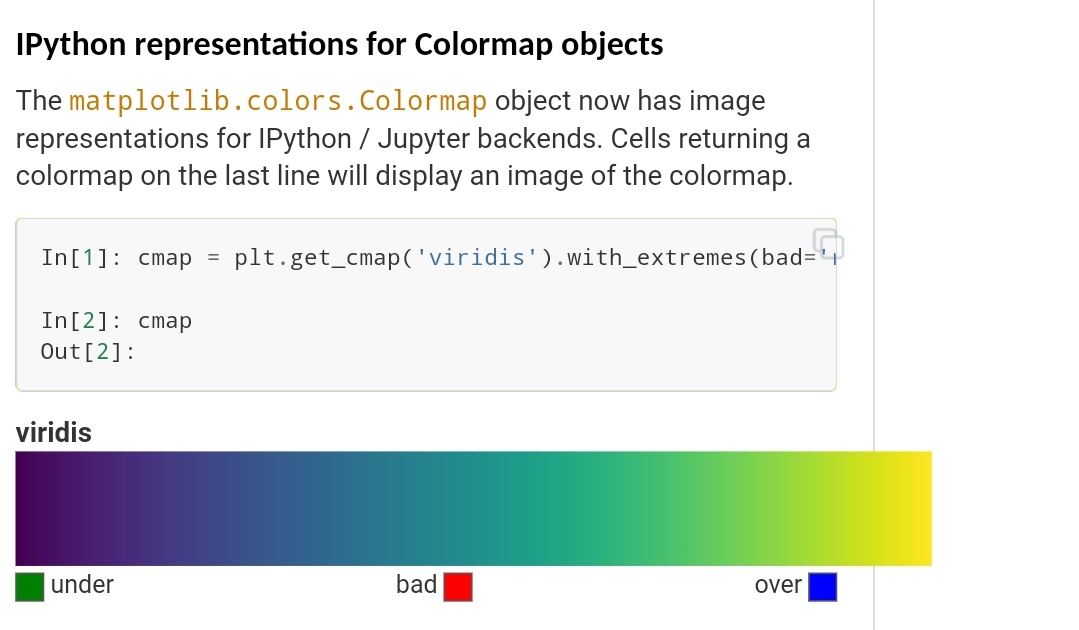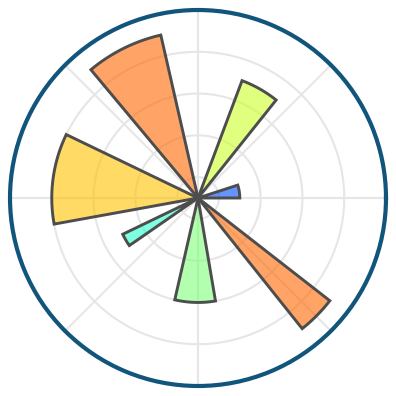
The features I added to @matplotlib for the SciPy 2020 virtual sprints were just released in version 3.4! 🥰 matplotlib.org/stable/users/w…
🌈📊 It was also a genuinely fun experience — the matplotlib devs who helped with sprints are great humans. If you’re a Python developer who wants to give back to the tools you use, join @SciPyConf sprints this year! It’s free and lasts for a weekend at the end of the conference.
Nice! Kinda like the .preview() method I added to the cmap object in my cmaptools package - github.com/shaharkadmiel/… This package also lets you "stitch" several colormaps together and set the "hinge" value in a similar way @gmt_dev does it.

Can someone please explain what situations these "bad," "under," and "over" would be used for? Seems like an interesting feature.
United States Trends
- 1. Good Thursday 29.3K posts
- 2. ESPN Bet N/A
- 3. Happy Friday Eve N/A
- 4. #thursdayvibes 2,282 posts
- 5. #thursdaymotivation 1,424 posts
- 6. #ThursdayThoughts 1,451 posts
- 7. #ThankfulThursday N/A
- 8. #PutThatInYourPipe N/A
- 9. Erik Spoelstra N/A
- 10. Lakers 87.1K posts
- 11. Vatican 11K posts
- 12. $APDN $0.20 Applied DNA N/A
- 13. $SENS $0.70 Senseonics CGM N/A
- 14. Grapefruit 1,576 posts
- 15. Unplanned 6,548 posts
- 16. Captain Kangaroo 1,319 posts
- 17. Wemby 29.2K posts
- 18. Marcus Smart 7,140 posts
- 19. Blazers 10.3K posts
- 20. Russ 12.5K posts
Something went wrong.
Something went wrong.


