
Raj Dutt
@nopzor
Anything about aviation or internet infra | now ceo/co-founder @ grafana labs, the company behind grafana http://www.grafana.com | Founded Voxel dot Net (sold to INAP)
You might like


what an amazing run! hugely inspirational @dittycheria

I have some news to share. After 11 incredible years, I’ve decided to retire as CEO of MongoDB. This was not an easy decision, but it’s the right time for a thoughtful transition.

Evaluated 6 observability platforms for our stack. Datadog: $8,000/month, everything included New Relic: $6,500/month, complex pricing Grafana Cloud: $2,800/month, good enough Self-hosted Prometheus: $800/month, high maintenance Elastic Stack: $4,200/month, steep learning curve…

Latest progress on new @grafana gauge, not yet merged yet. But very close to having feature parity with old gauge
love this


Grafana Labs is a 2025 Forbes #Cloud100 honoree! We jumped 10 spots to come in at #13 among the world’s top private cloud & AI companies. Thanks to our community for your support, and to @cloud100, @BessemerVP, & @Forbes for this 5x consecutive recognition:…
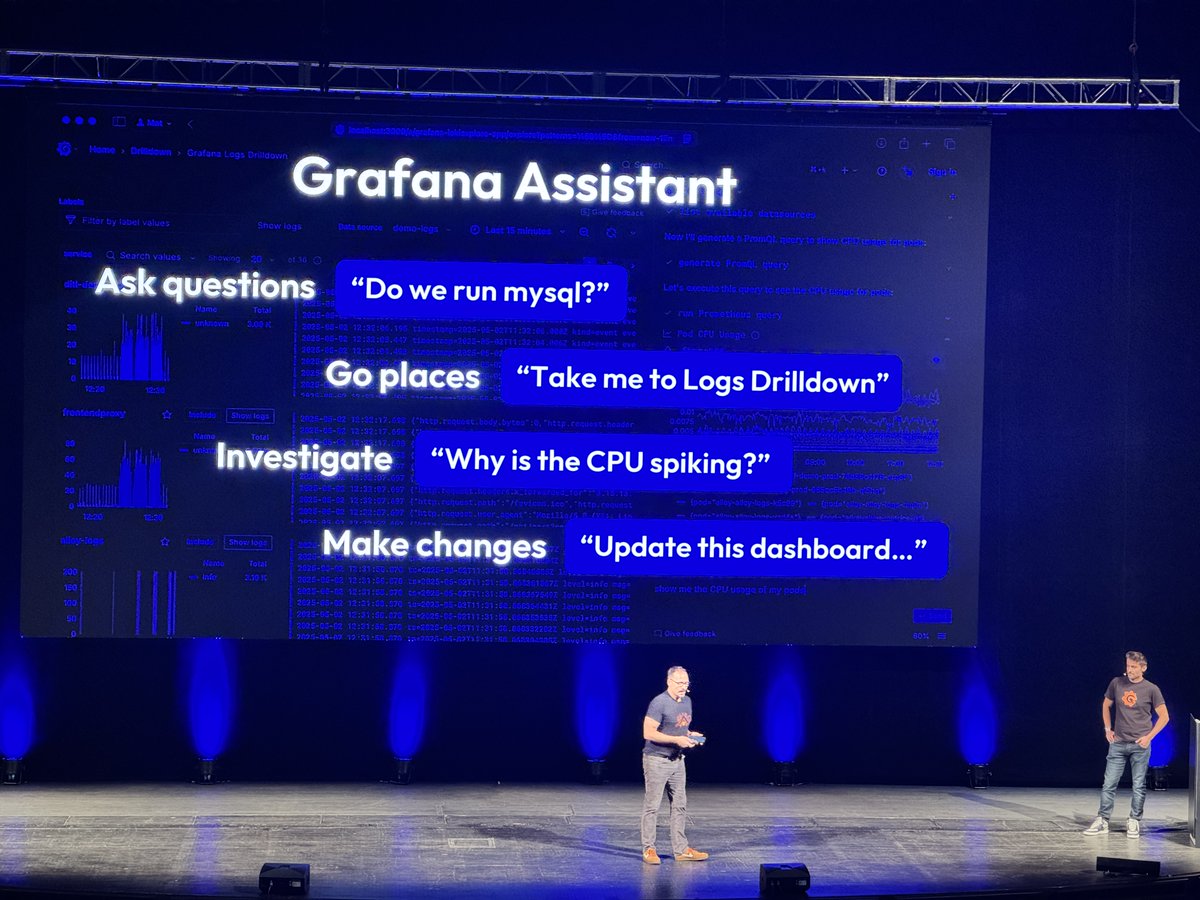
super excited about grafana assistant reaching public preview. if you like/use grafana, give us feedback! we think it represents part of a fundamental paradigm shift for observability
🎉 Grafana Assistant is now in public preview! It's AI-powered #observability for your stack. Grafana Assistant provides answers and takes action with your dashboards, data sources, and context in mind: ▪️ Investigate issues ▪️ Explore logs, metrics, and traces ▪️ Build and…

A product that (almost) everyone uses from mid-sized tech companies and up but I rarely hear talked about: Grafana In The Pragmatic Engineer 2025 survey, it had more mentions than Cursor, and dominates as the answer to "how do you turn information into graphs" This is Grafana:

Grafana Labs is 2x a Leader in the Gartner® Magic Quadrant™ for Observability Platforms. This year, we’re placed furthest in Vision. And with 25M+ users and 5k+ customers worldwide, we believe this is a strong validation of our leadership in open and composable observability.…


Sharing an update on @figma: we publicly filed our S-1 with the SEC today, and have applied to list on the New York Stock Exchange under the symbol “FIG.” figma.com/blog/s1-public

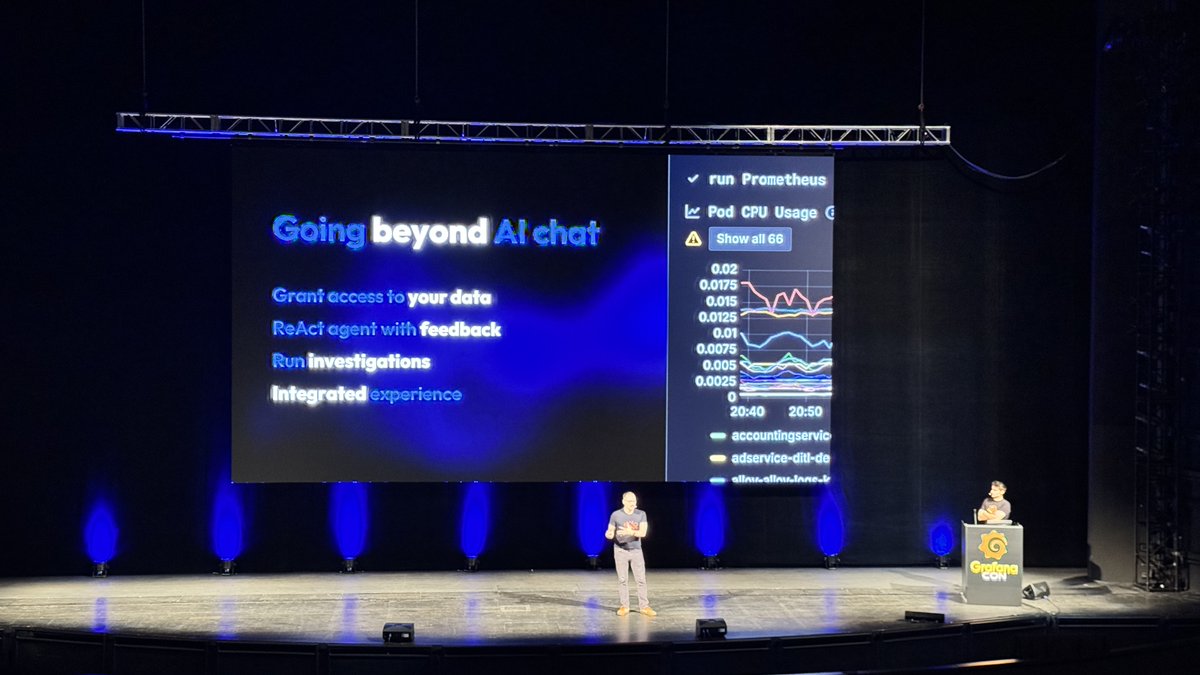
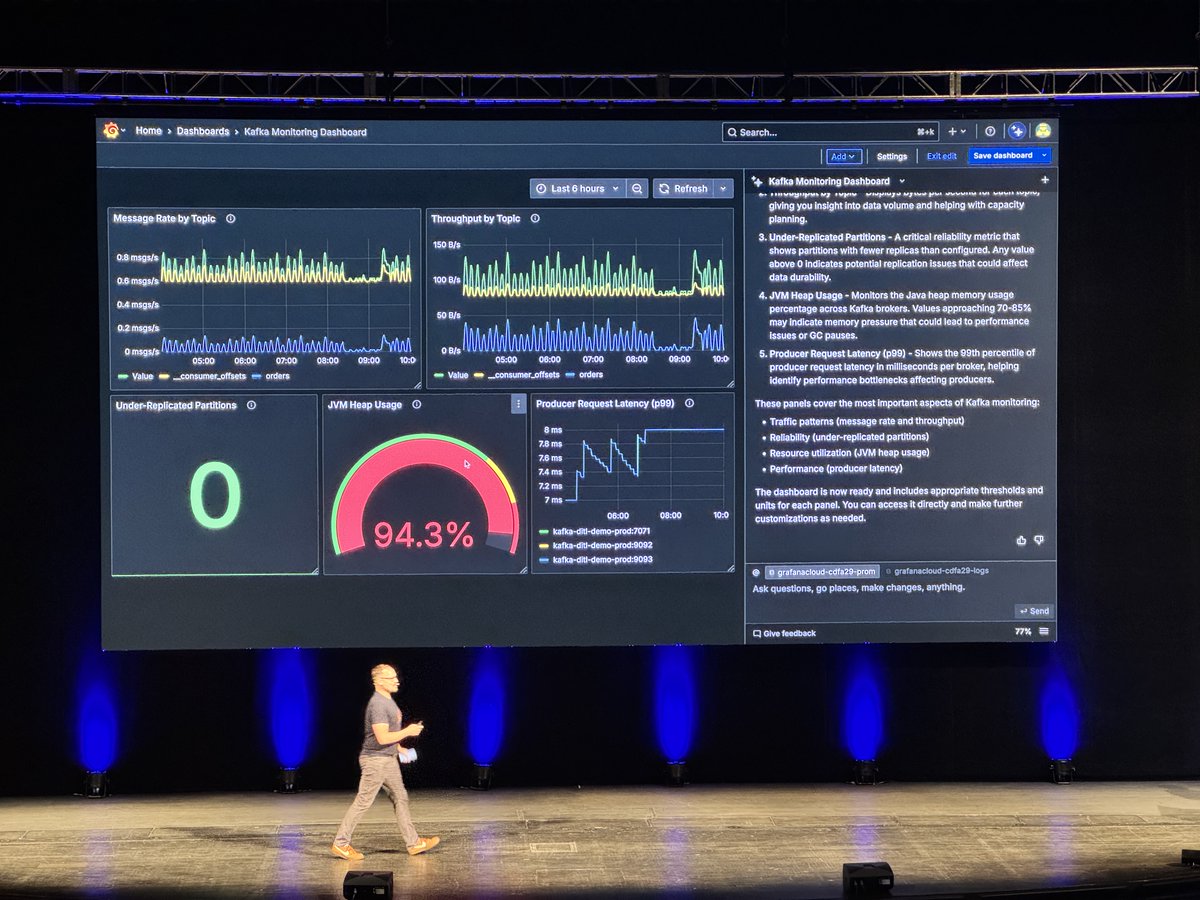
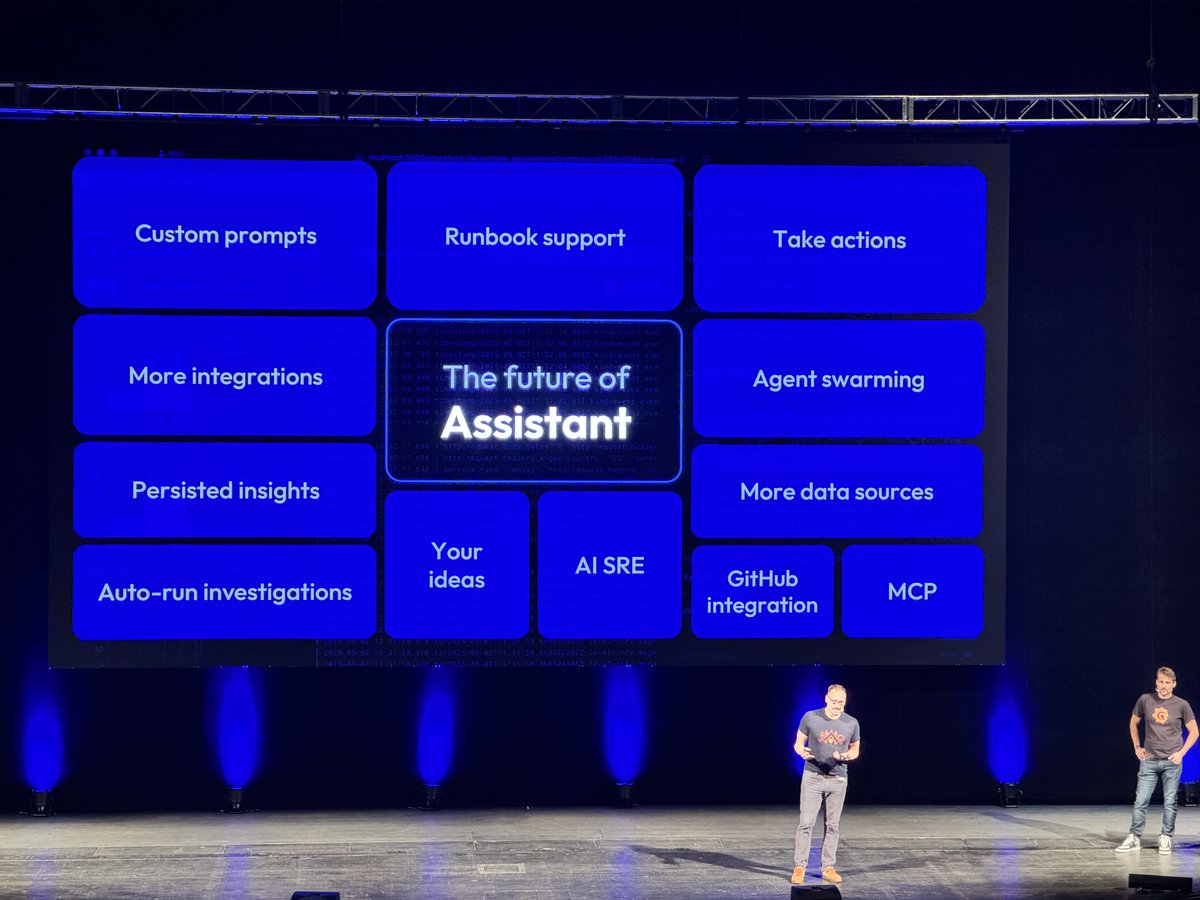
something really exciting that we announced a few hours ago at today’s grafanacon: grafana assistant (currently in private preview). this is an agentic chat assistant that supercharges your entire grafana observability experience. it can help you troubleshoot specific issues,…
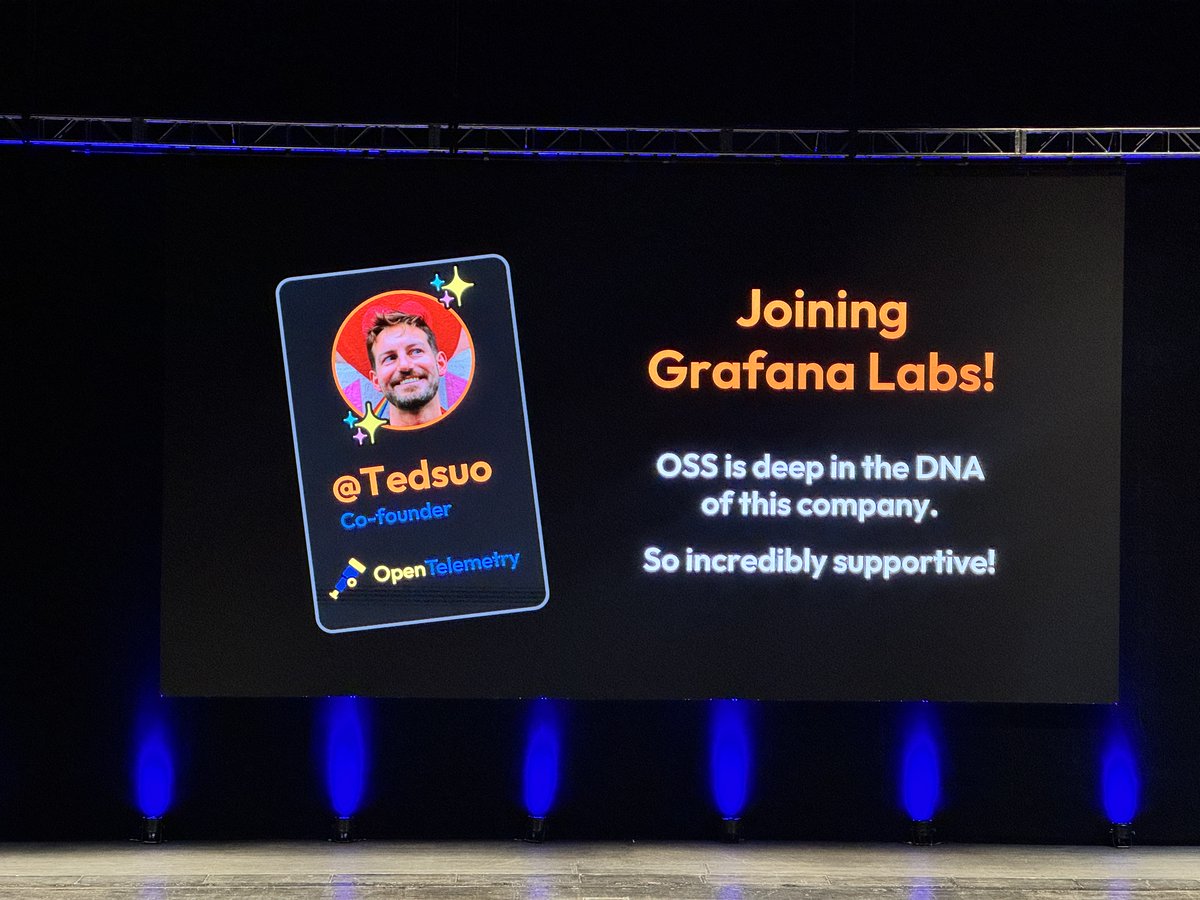
glad to have @tedsuo join grafana labs. we are accelerating our involvement and investment around @opentelemetry. our unique “big tent” approach to observability is actually aligned with its approach.
Now on the #GrafanaCON stage, @tedsuo (#OpenTelemetry co-founder and new Grafanista) shares why OTel and Grafana are better together. We have a deep and long-standing commitment to the OpenTelemetry project. We’ve prioritized building compatibility with OTel into our products…
congrats to @reclaimai - amazing product and great team! we’ve been early users at @grafana and are huge fans. hope you get to accelerate your vision at @Dropbox

Big news: Reclaim is now a part of @Dropbox 🎉 We’re thrilled to be joining forces with such a visionary (and legendary) team to help drive the future of productivity for hundreds of millions of people worldwide.


BIG NEWS🚨Grafana Pyroscope 1.0 just dropped! 🔥 -✅ Petabyte-scale ingest 📊 -✅ Low Overhead 🙌 -✅ Easy Upgrade 🛠️ #continuousprofiling has never been better! Check it out blog post and upgrade guide! 👉 grafana.com/blog/2023/08/2…

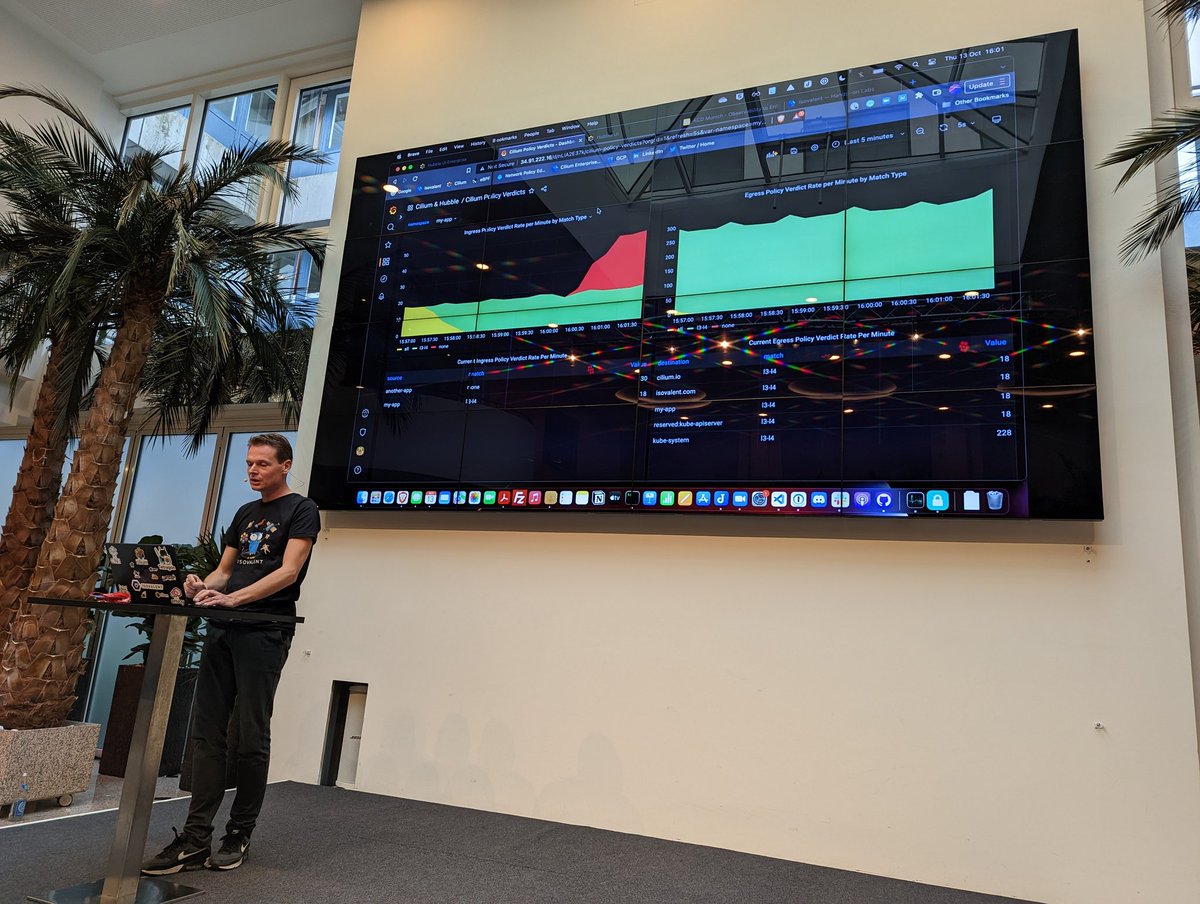
cool stuff @dejongraymond! we are just starting to spool up on deeper collaborations between @ciliumproject @isovalent and @grafana, lots more to come!

Awesome demo on monitoring @ciliumproject network policies with @grafana. green: allowed traffic, red: blocked traffic, yellow: traffic that didn't match any rule. Left: ingress, right: egress. @KCDMunich @dejongraymond
super cool!
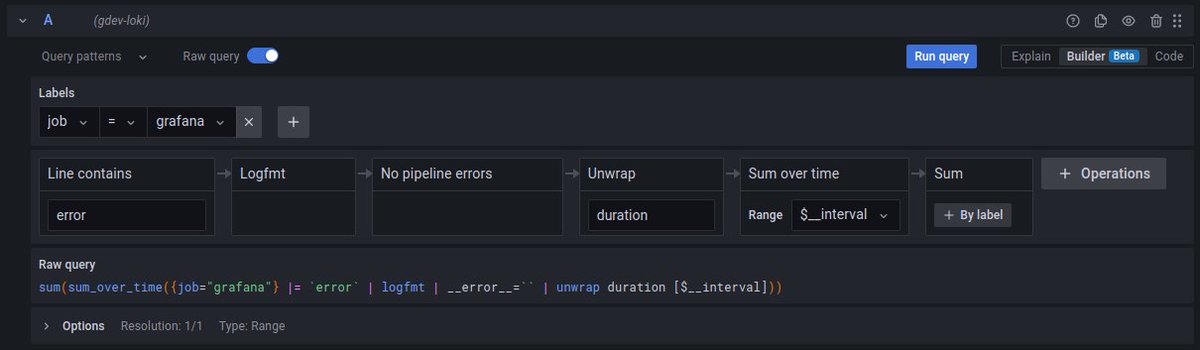
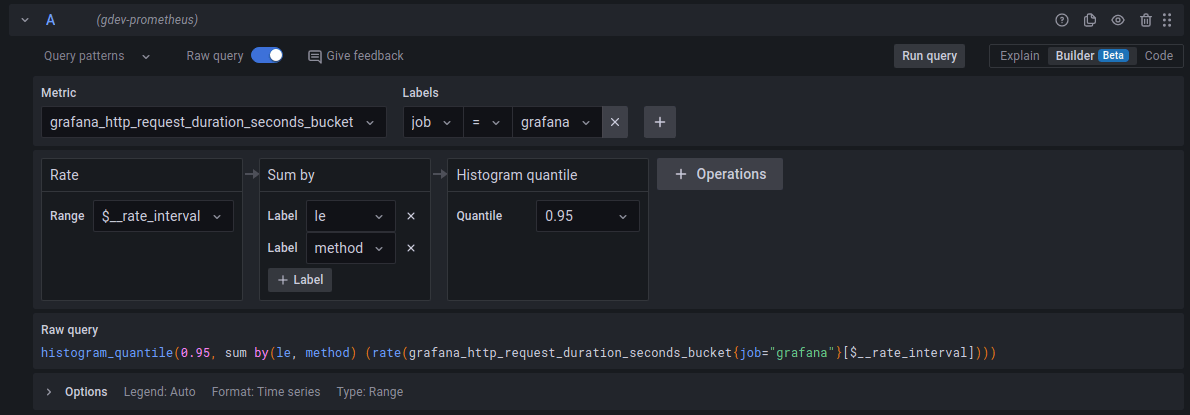
One of the things I am most proud and excited about in @grafana v9 is the new query builders for #Prometheus and #GrafanaLoki. Writing and understanding PromQL or LogQL queries is far from easy, these new builders are game-changers (I hope) in lowering the barrier of entry.
feeling rather overwhelmed the last 2 days - so very grateful, excited, and proud. a truly amazing team, most of whom had never even met until this week.

That’s a wrap on stage for the first morning at #grafanafest. Recorded a live episode of our “Big Tent” podcast with @nopzor, @torkelo & Anthony - the @grafana founders!

for @grafana labs, LGTM is the result of a multi year effort, and also a way that we express our open source DNA. super proud of all the incredible grafanistas who worked so hard to make yesterday’s mimir launch happen. the incredible thing is we are just getting started…

hanging out in pdx at the early monitoramas felt like a truly special time, almost a bygone era, in oss monitoring. @obfuscurity created something special truly special...
@Monitorama is back! This image is from 2014, my first Monitorama, and my introduction to the #monitoringlove community. Grafana was only 5 months old, this event and the love & excitement from the already large Grafana userbase attending were incredible. blog.monitorama.com/yes-monitorama…

excited about this. elasticsearch is a fantastically powerful backend that’s very popular with grafana users. we will be working closely with the @elastic team to make the experience even better!

this is a huge reimagination of the main graph panel in grafana, leveraging foundational work done in 7.0. exciting stuff.
Today on the blog: A detailed look at the new features of the next-generation time series panel in Grafana 7.4 grafana.com/blog/2021/02/1…


![zenteric's profile picture. [pigeon fancier]🕊️](https://pbs.twimg.com/profile_images/1063946558759206913/Q5KTyOgE.jpg)


United States Trends
- 1. Sesko 35.7K posts
- 2. Ugarte 11.9K posts
- 3. Richarlison 16.8K posts
- 4. Amorim 60.6K posts
- 5. De Ligt 19.7K posts
- 6. Cunha 23.9K posts
- 7. Good Saturday 28.7K posts
- 8. Tottenham 72.6K posts
- 9. #SaturdayVibes 3,986 posts
- 10. #TOTMUN 15.6K posts
- 11. #MUFC 22K posts
- 12. GAME DAY 11.4K posts
- 13. Casemiro 18.9K posts
- 14. Dalot 11.4K posts
- 15. Manchester United 77.9K posts
- 16. #Caturday 4,107 posts
- 17. Richy 3,945 posts
- 18. Man United 33.6K posts
- 19. #COYS 2,480 posts
- 20. Lando 31K posts


Something went wrong.
Something went wrong.