
Scott Brown, CMT
@scottcharts
Founder, Brown Technical Insights. Essential insights into market trends, technicals and opportunities
قد يعجبك


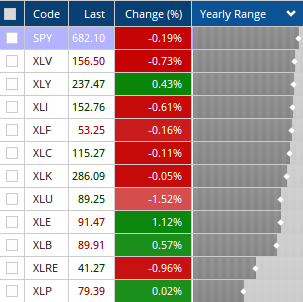
Interesting dynamic right now where the S&P 500 is closer to its 52-week high than any of the 11 underlying sectors
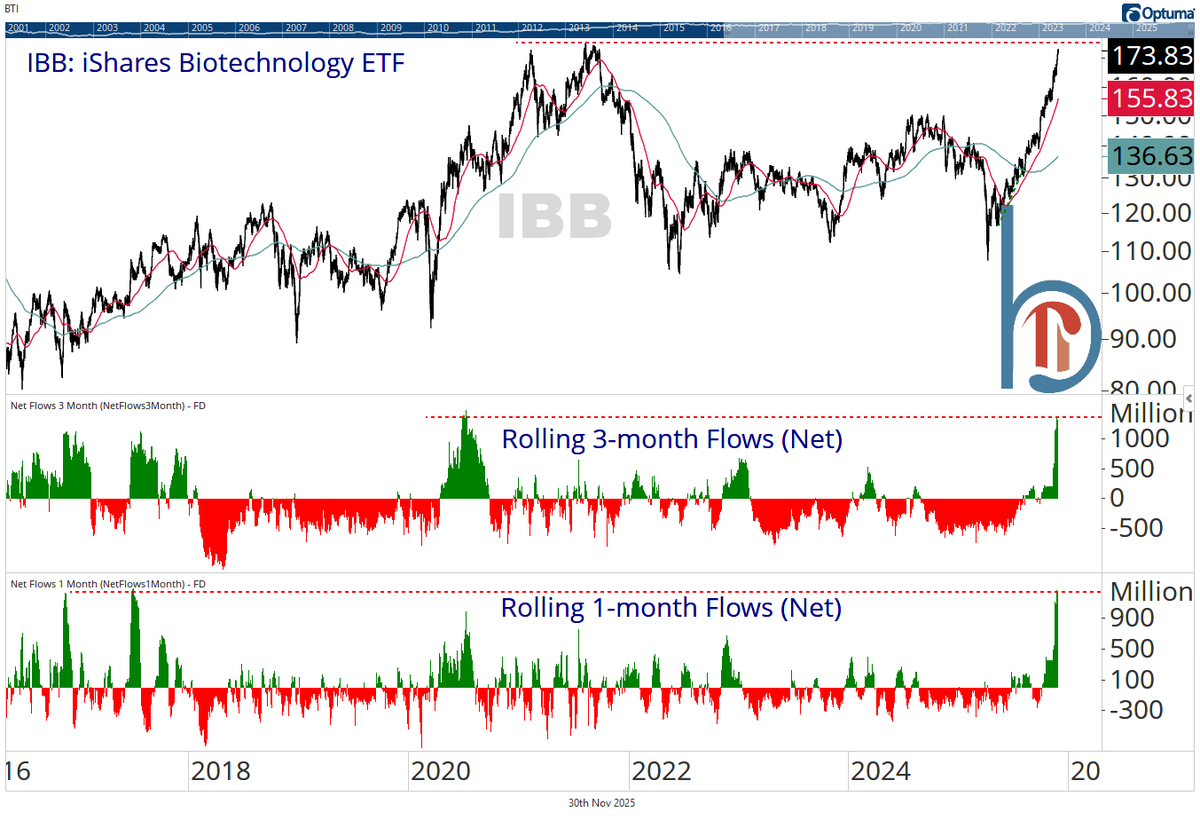
Biotech inflows have gone parabolic. Right as IBB reaches a logical place for a consolidation
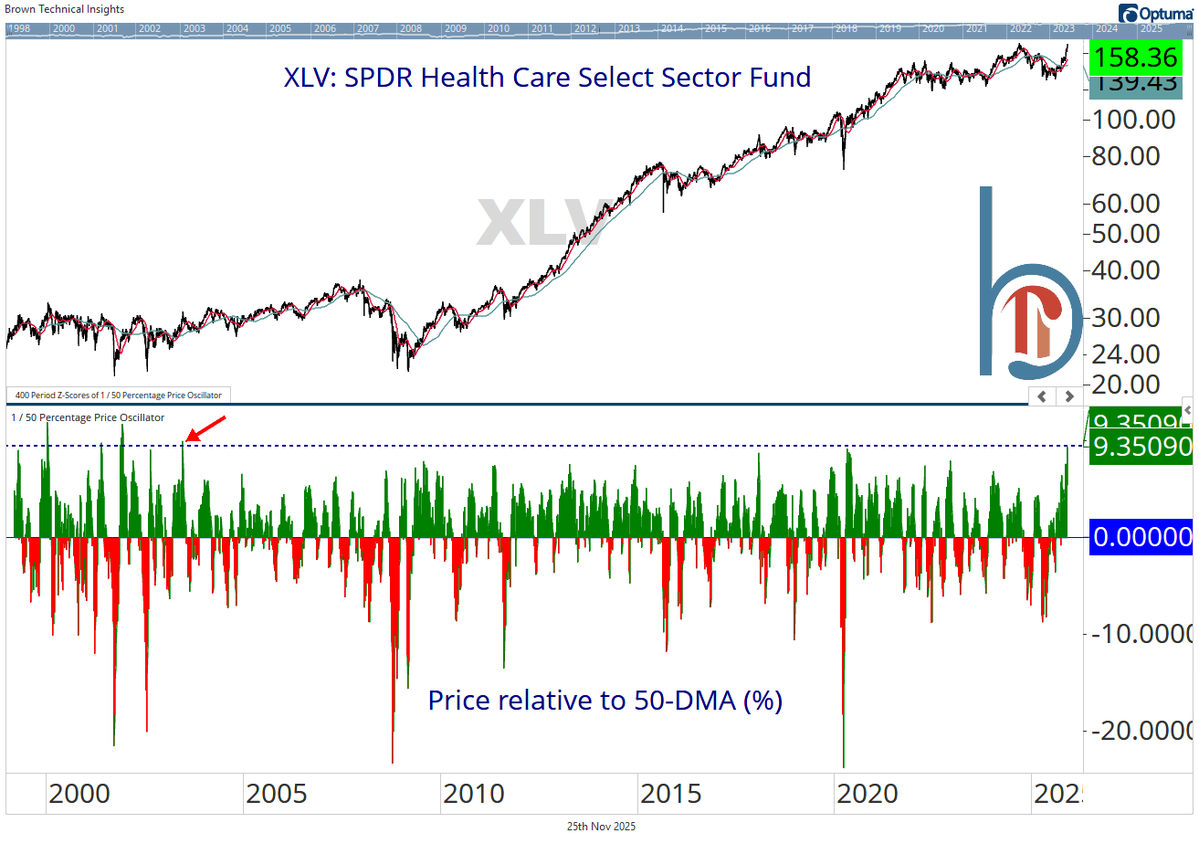
Healthcare hasn't been this overbought relative to its 50-DMA since 2003. Currently on track for a new all-time closing (but not intraday) high
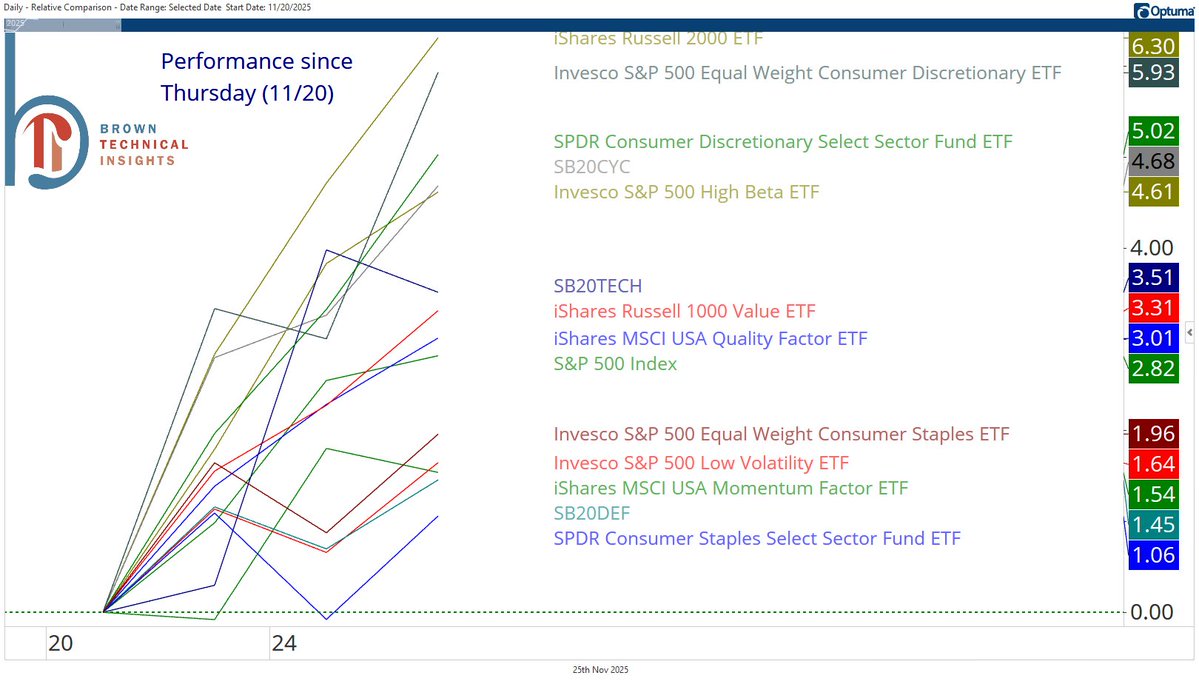
Just 3 days, but leadership has been everything you could want since last Thursday. Small caps and equal-weight discretionary at the top, staples and my custom defensives basket on the bottom
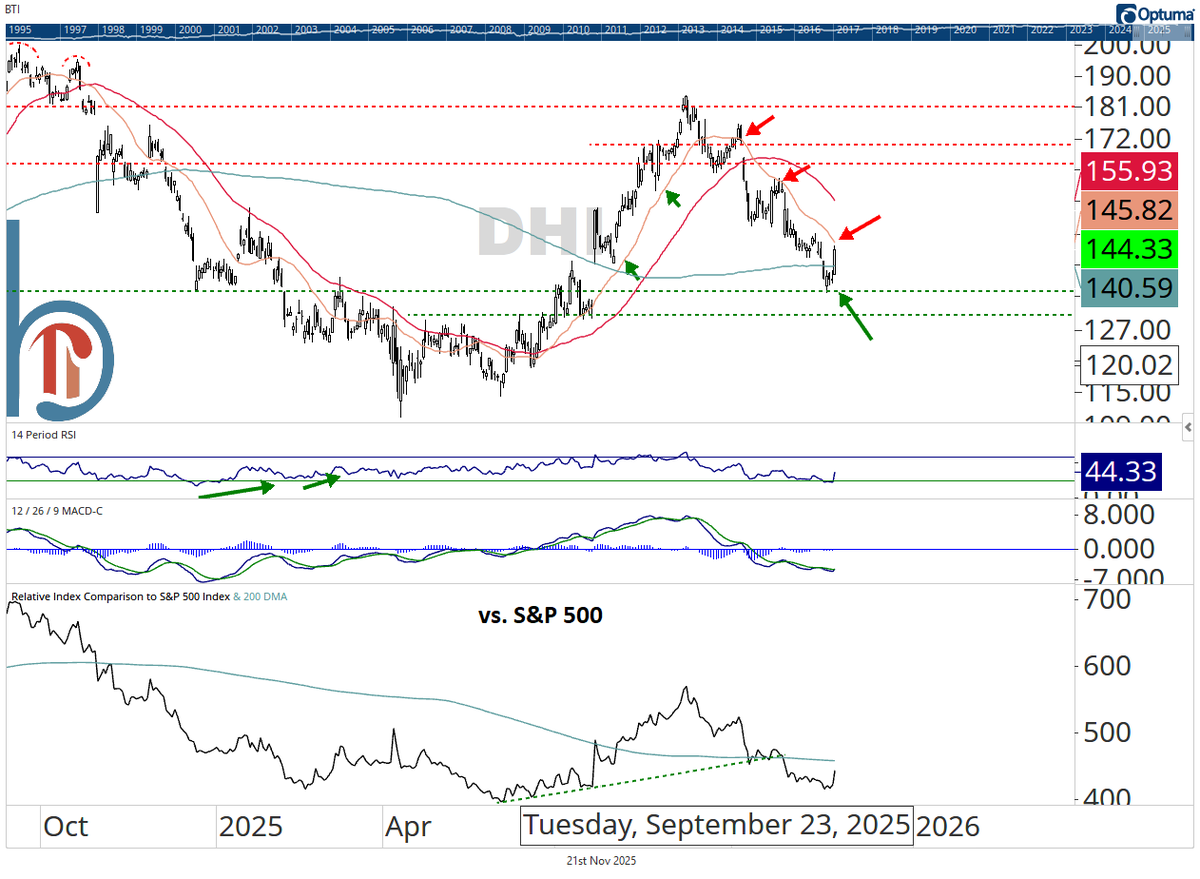
Big response at key support for D.R. Horton today. Watch the 21-DMA overhead, which was support on the way up and has acted as resistance on the way down
Timely reminder of where unemployment is likely going with the Fed asleep at the wheel. Up another 0.1% in this morning’s report
Once unemployment "bottoms", the lowest rate we've seen before it turns back lower has been 6.1%

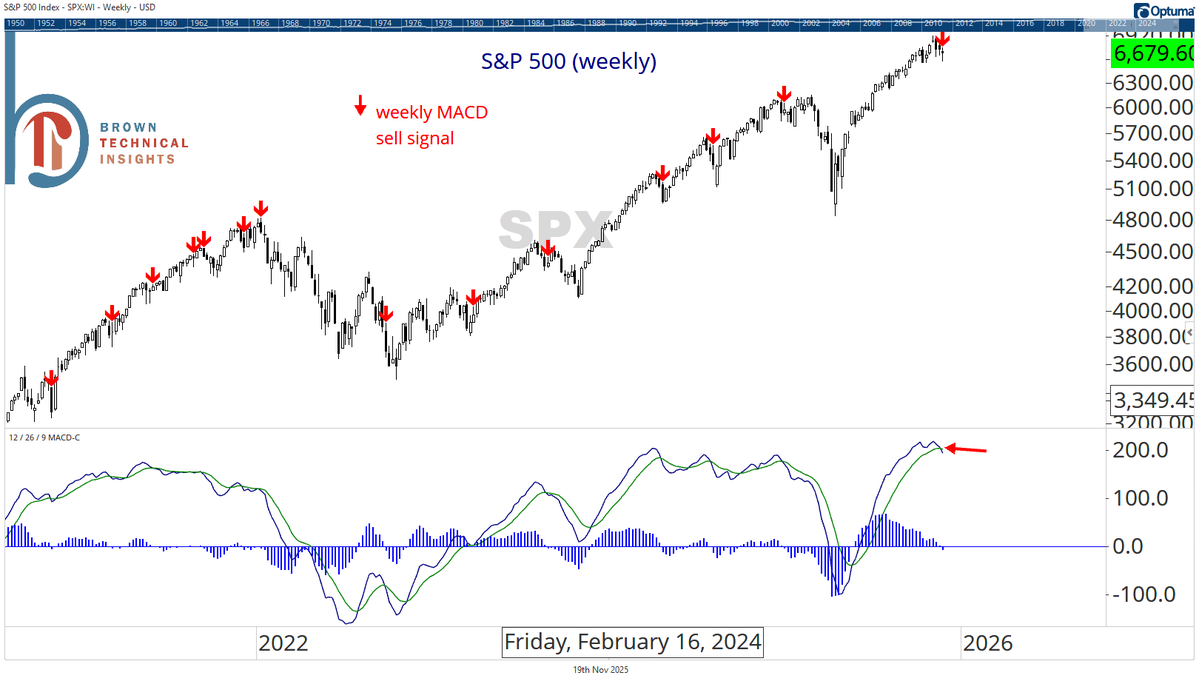
2.5 trading days to go, but the S&P 500 is currently on track to print its first weekly MACD sell signal since December 27, 2024
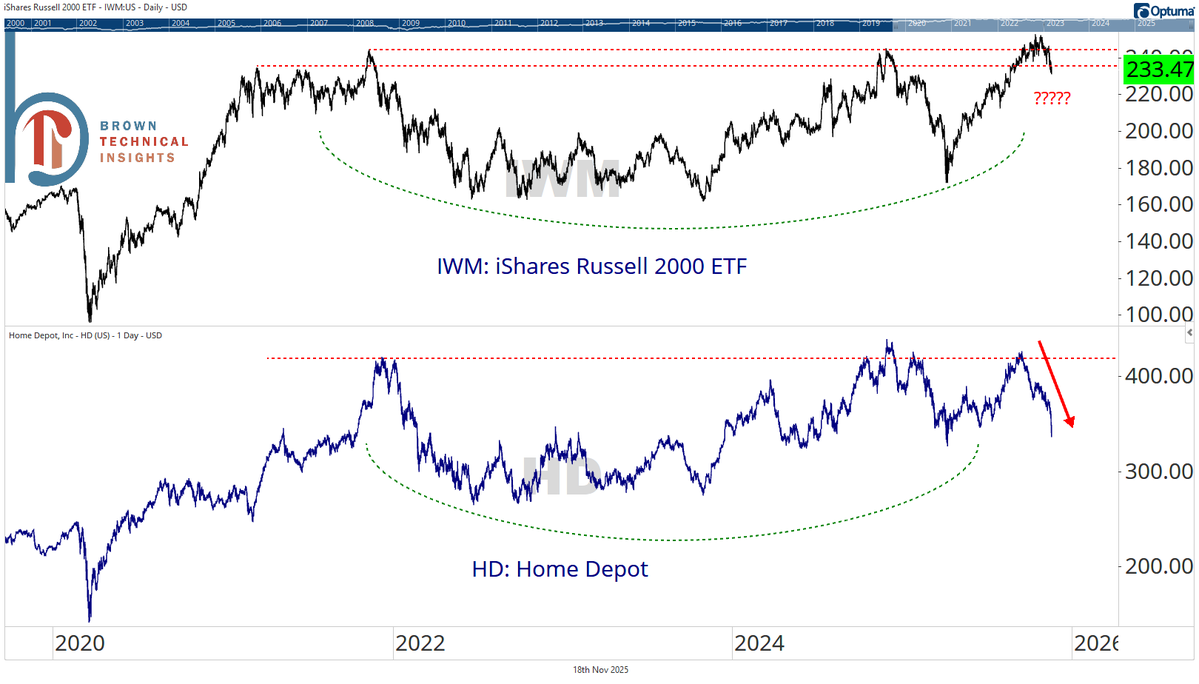
Will small-caps continue to track with Home Depot? HD came within a dollar of its April closing lows today
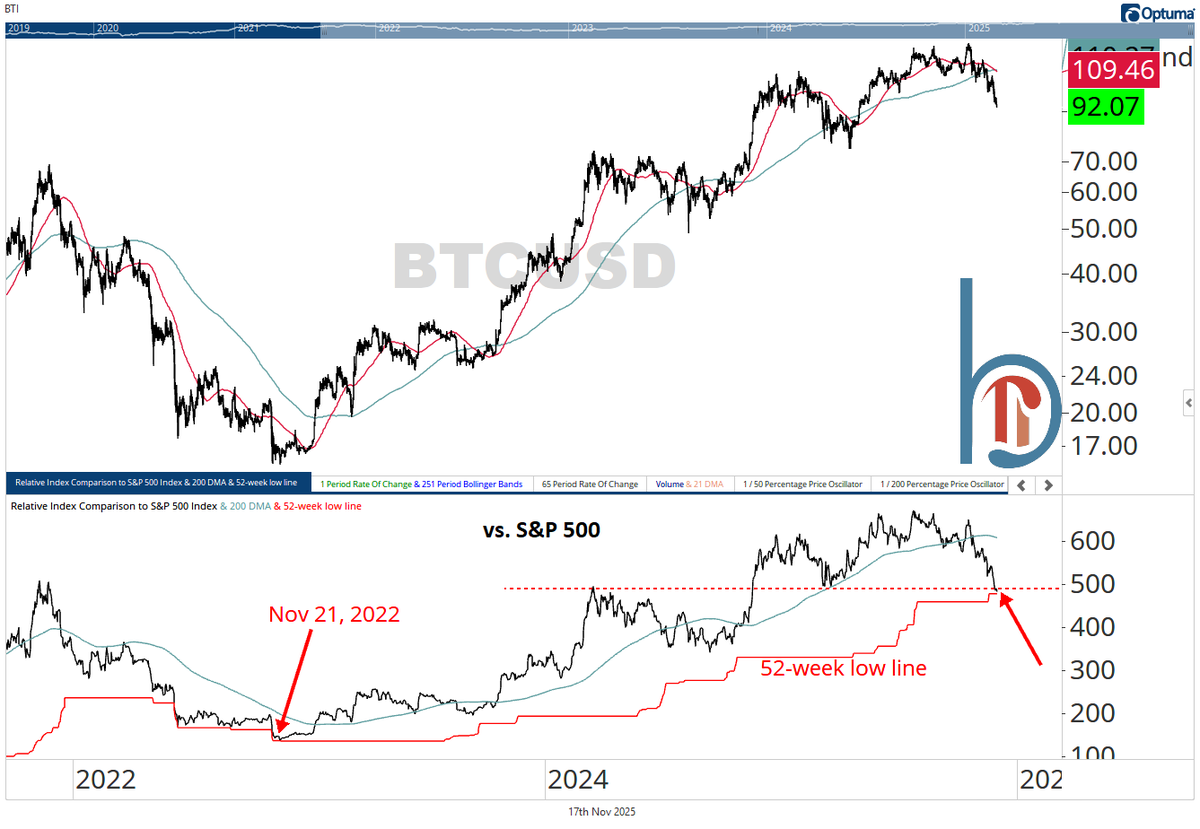
That's the first 52-week low for Bitcoin vs. the S&P 500 in nearly 3 years. It also violates a key potential support/resistance line
Healthcare may be tactically overbought, but note where you are in the relative outperformance cycle

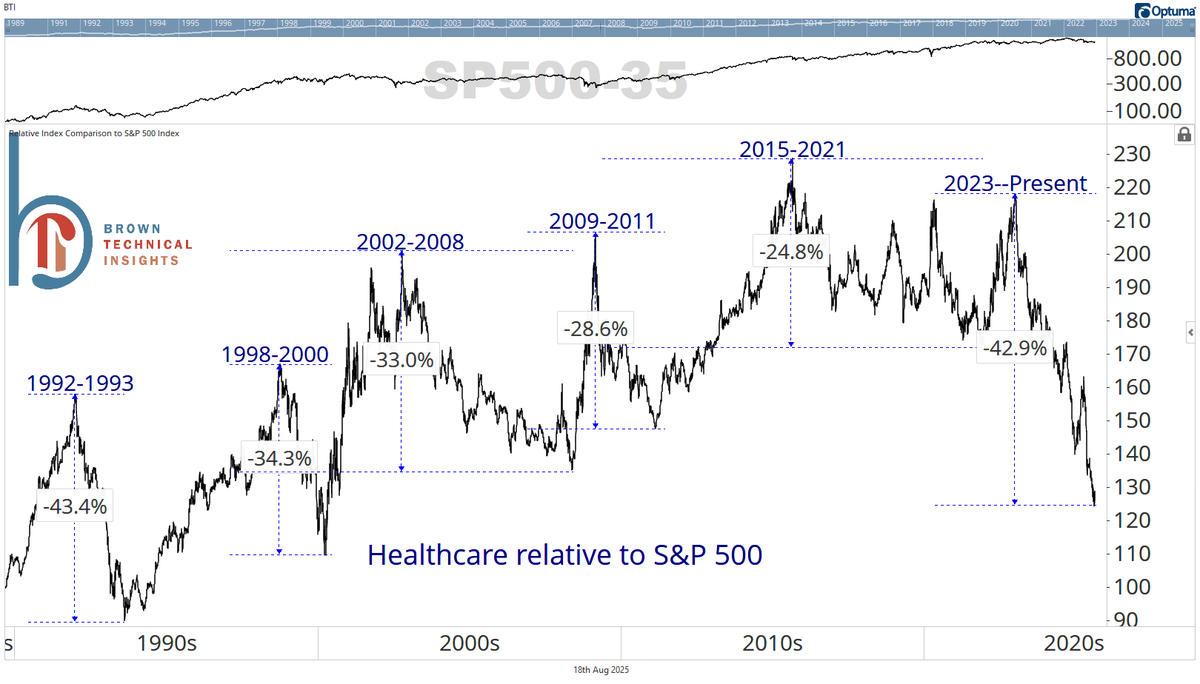
How does the current stretch of healthcare underperformance stack up historically? If you start from the beginning of 2023, it's now tied with '92-'93 for the worst run ever. Of course, you could argue it began in 2015, in which case this is clearly the worst run ever

One of the most bullish charts out there: Crude oil upside down. Today's 3.5% drop seems to be aiding the consumer discretionary sector


Good run, but this trade looks over short-term

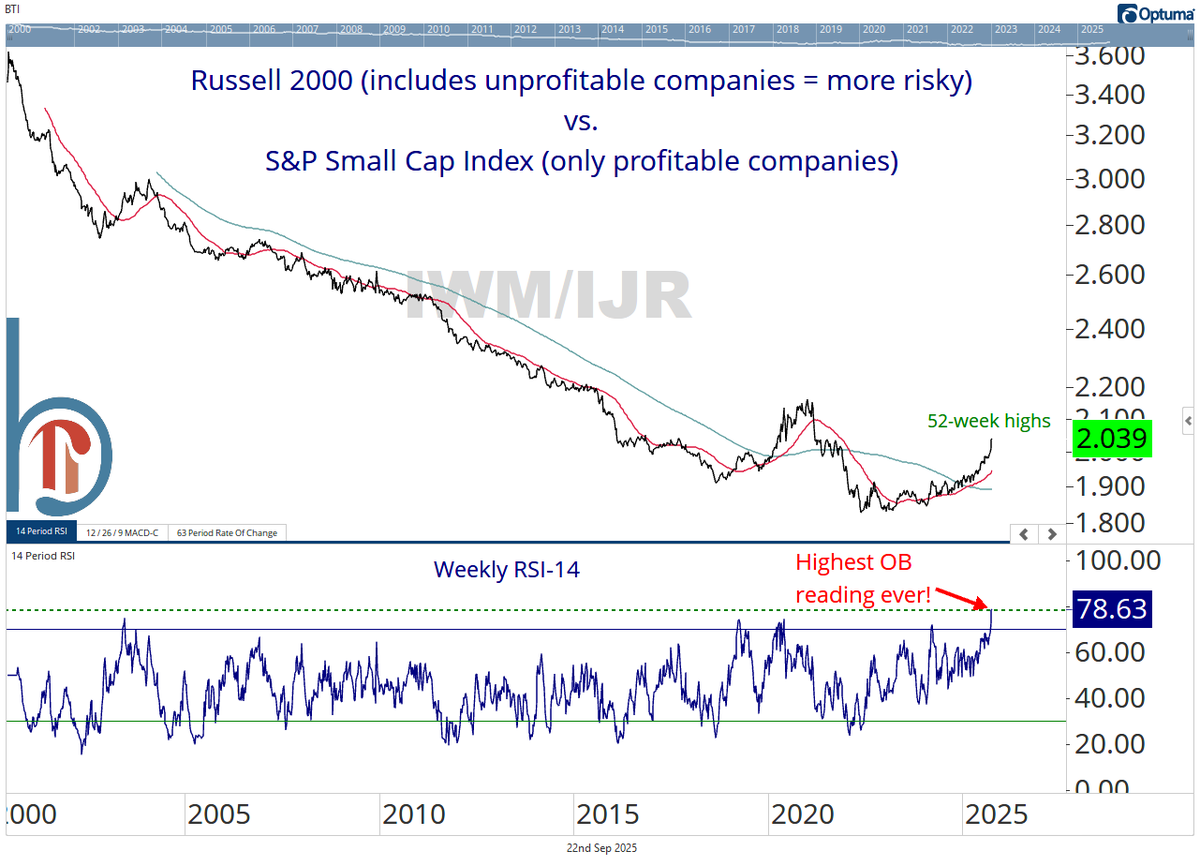
Screening for quality has killed small cap investors. The ratio of the lower-quality Russell 2000 to the S&P 600 Small Cap Index (screens for profitability) has never been more overbought on a weekly basis
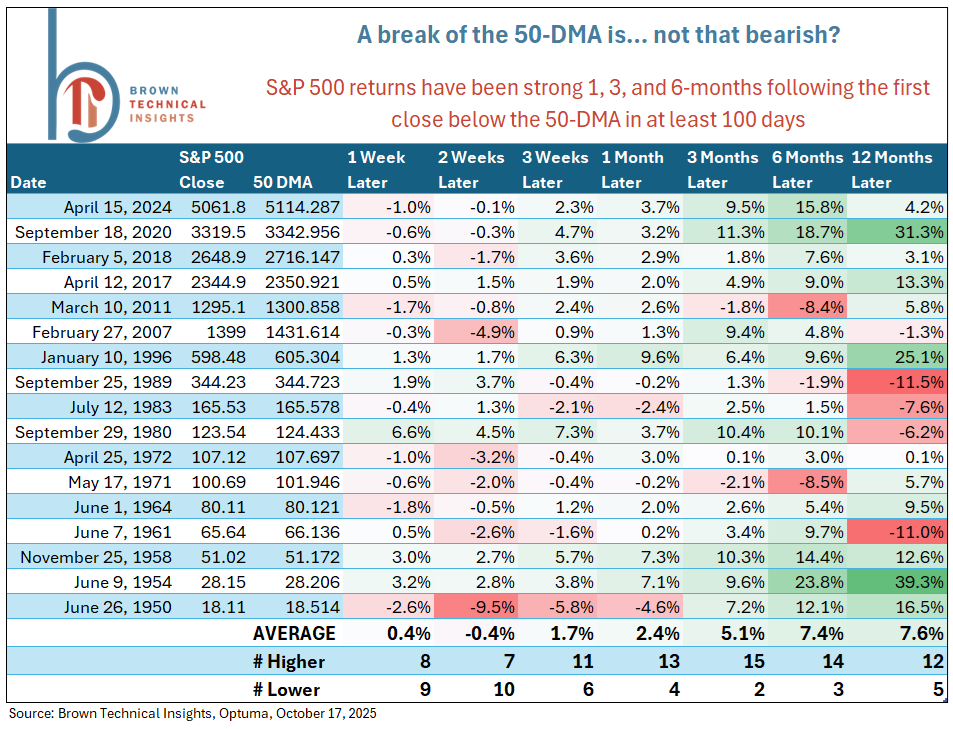
Quick reminder as the S&P 500 is on track to close below its 50-DMA for the first time in 132 trading days 👇
A break of the 50-DMA would be... not that bearish? The S&P 500 has been lower three months later only 2 out of 17 times that it broke the 50-DMA after at least 100 consecutive closes above. Pretty normal to see some downside follow-through over the following two weeks though


United States الاتجاهات
- 1. #twitchrecap 8,672 posts
- 2. #GivingTuesday 27.2K posts
- 3. Larry 46.5K posts
- 4. So 79% 1,855 posts
- 5. Joe Schoen 7,469 posts
- 6. Cabinet 68.7K posts
- 7. Costco 53.3K posts
- 8. #AppleMusicReplay 10.2K posts
- 9. Haaland 21.7K posts
- 10. Susan Dell 7,420 posts
- 11. Pat Leonard N/A
- 12. Trump Accounts 14.9K posts
- 13. #SleighYourHolidayGiveaway N/A
- 14. NextNRG Inc. 3,704 posts
- 15. Sleepy Don 2,649 posts
- 16. #Rashmer 28.5K posts
- 17. Sabrina Carpenter 33.4K posts
- 18. Jared Curtis 2,964 posts
- 19. Foden 12.1K posts
- 20. King Von 2,089 posts
قد يعجبك
-
 David Keller, CMT
@DKellerCMT -
 Willie Delwiche, CMT, CFA
@WillieDelwiche -
 Dean Christians, CMT
@DeanChristians -
 The Chart Report
@TheChartReport -
 Ryan Detrick, CMT
@RyanDetrick -
 Steven Strazza
@sstrazza -
 Todd Sohn
@Todd_Sohn -
 Chris Verrone
@verrone_chris -
 Strategas Asset Management
@strategasasset -
 Shane C. Murphy, CMT
@murphycharts -
 Strategas
@StrategasRP -
 Rob Anderson, CFA
@_rob_anderson -
 David Lundgren, CMT CFA
@dlundgren3333 -
 Andrew Thrasher, CMT
@AndrewThrasher -
 Alfonso De Pablos, CMT
@AlfCharts
Something went wrong.
Something went wrong.