
Soapboxuncle
@soapboxuncle
#Activeinvestor. Enjoys basic #charting #technicalanalysis #cryptocurrency #silver #gold Not financial advice.
Potrebbero piacerti


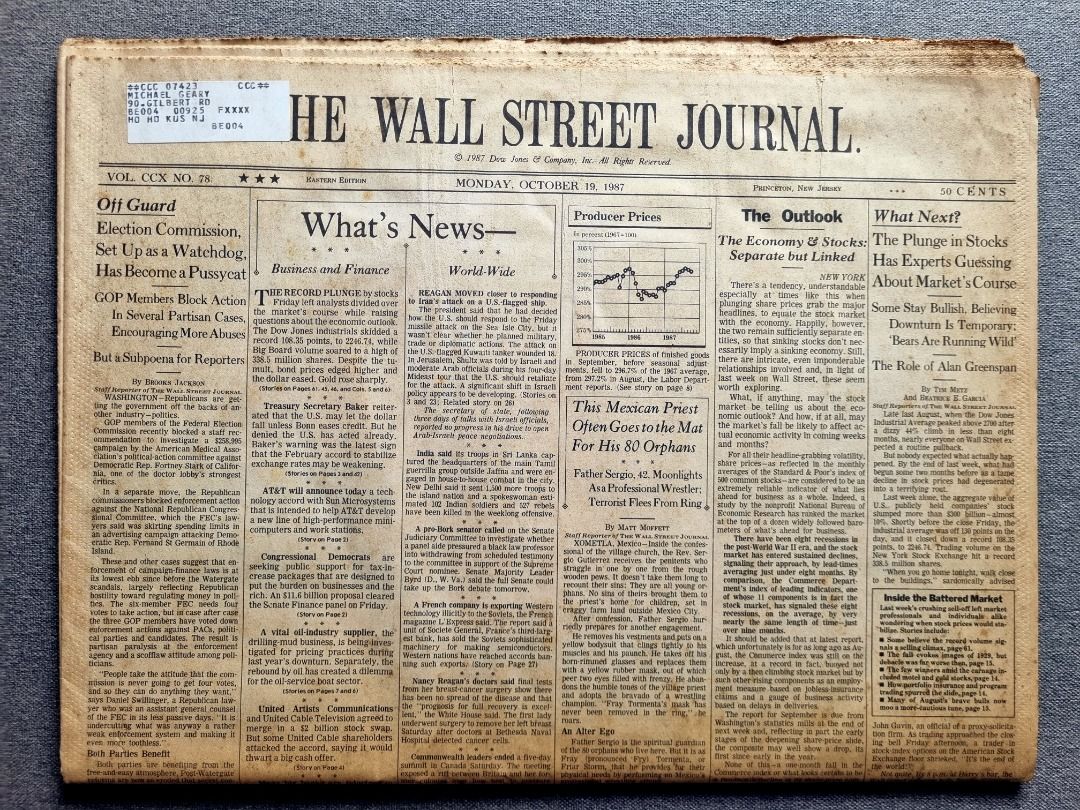
I have an old copy of the Wall Street Journal that was published on Black Monday (October 19, 1987). What many people may not recall is that there was a stock market plunge on Friday 16 October, and it is very reminiscent of what happened over the previous 24 hours. #StockMarket…
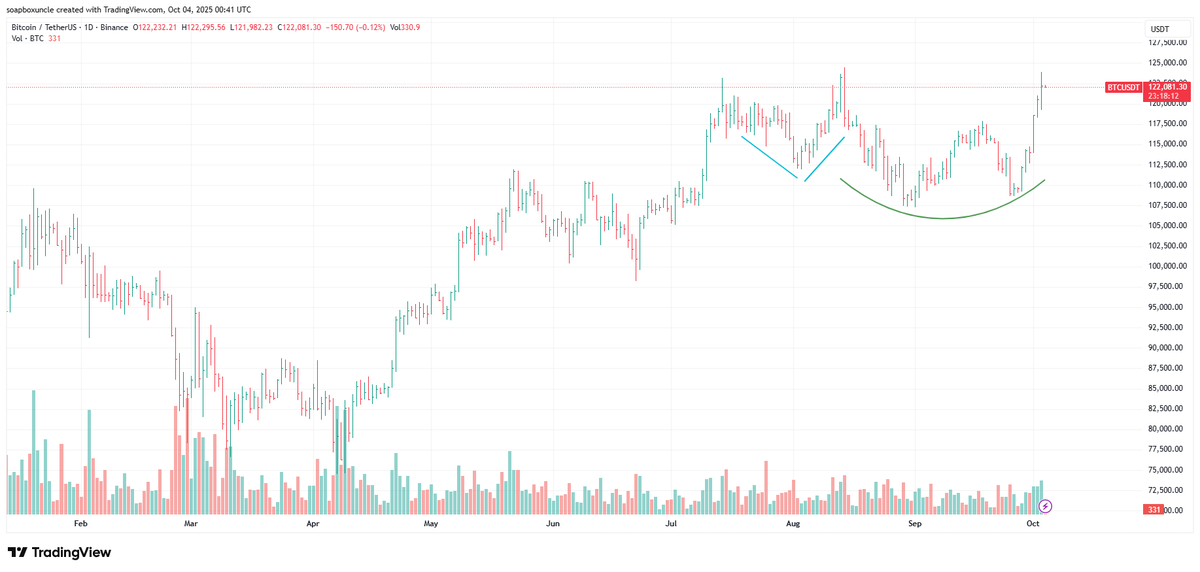
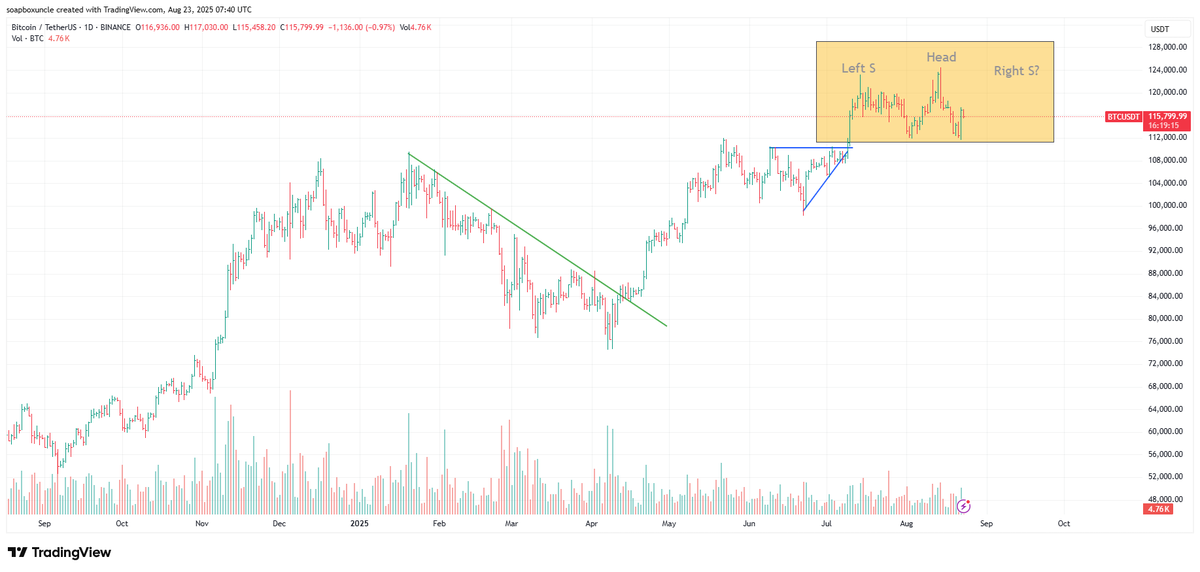
Bitcoin price appears to be setting up an Adam and Eve double bottom which is bullish. #BTCUSDT #CryptoTrading #CryptoTrading
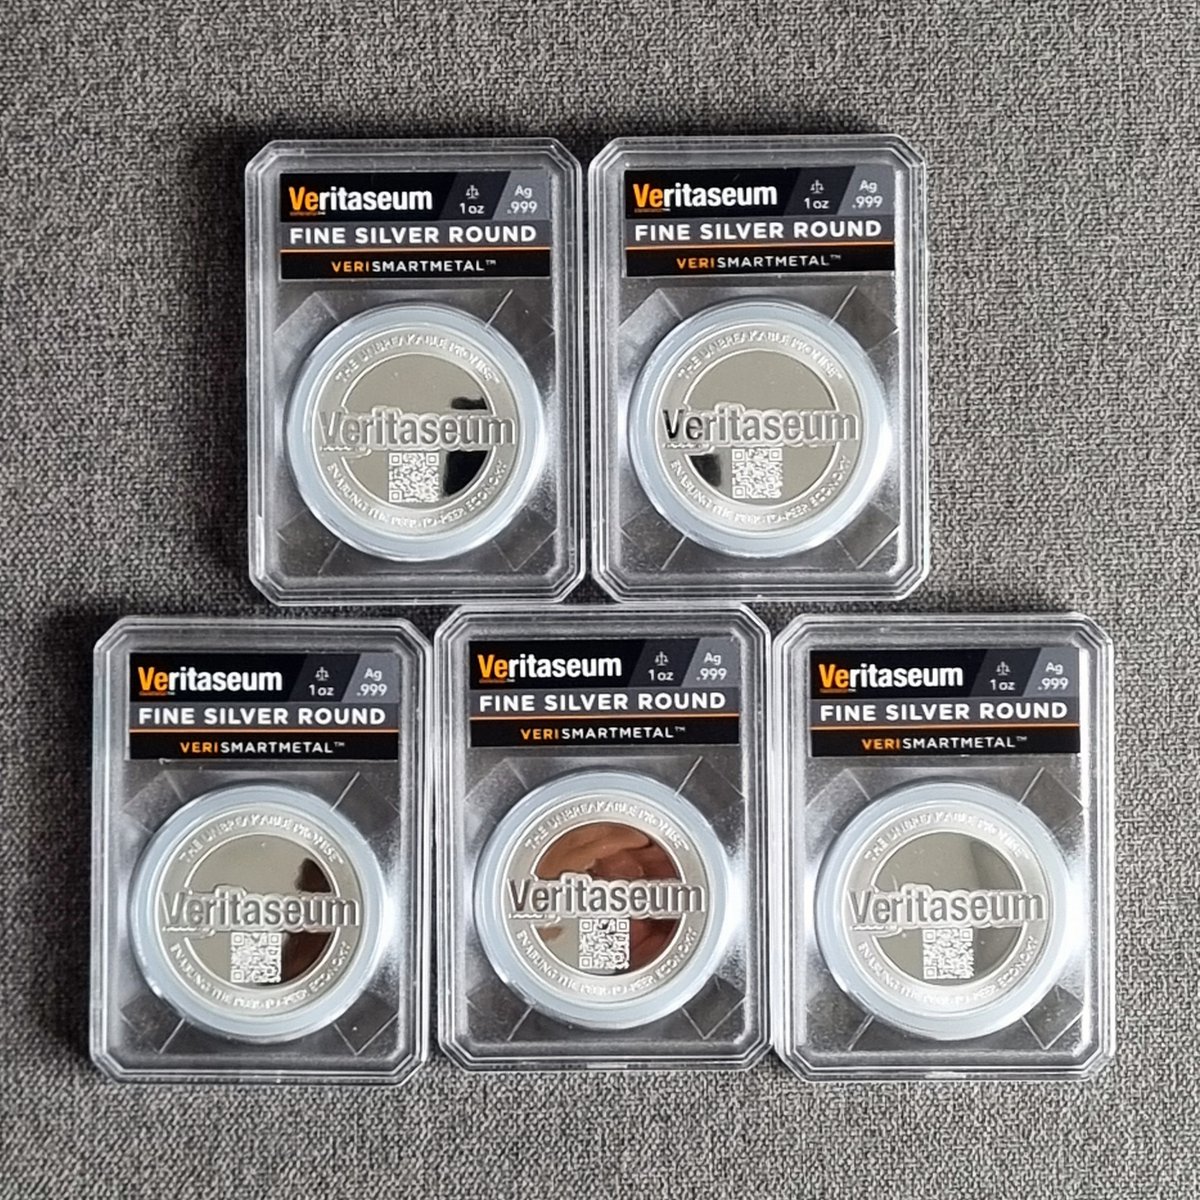
Greetings from Singapore! The second batch of Veritaseum silver rounds that I had purchased have arrived safely to me. Wishing much success to @ReggieMiddleton and @dao_veri
Greetings from Singapore! I am perhaps the first person from my country to report receiving the Seeker @solanamobile phone, and it has indeed arrived to me safely. I look forward to using it but could you please share videos so that I could get up to speed?

Altcoins, led by Ethereum, had a great day yesterday. I have capital waiting on the sidelines to add to my crypto stash, but nonetheless, I don’t have a good feeling about the market and am waiting a couple more days to see how it plays out. In particular, when looking at…
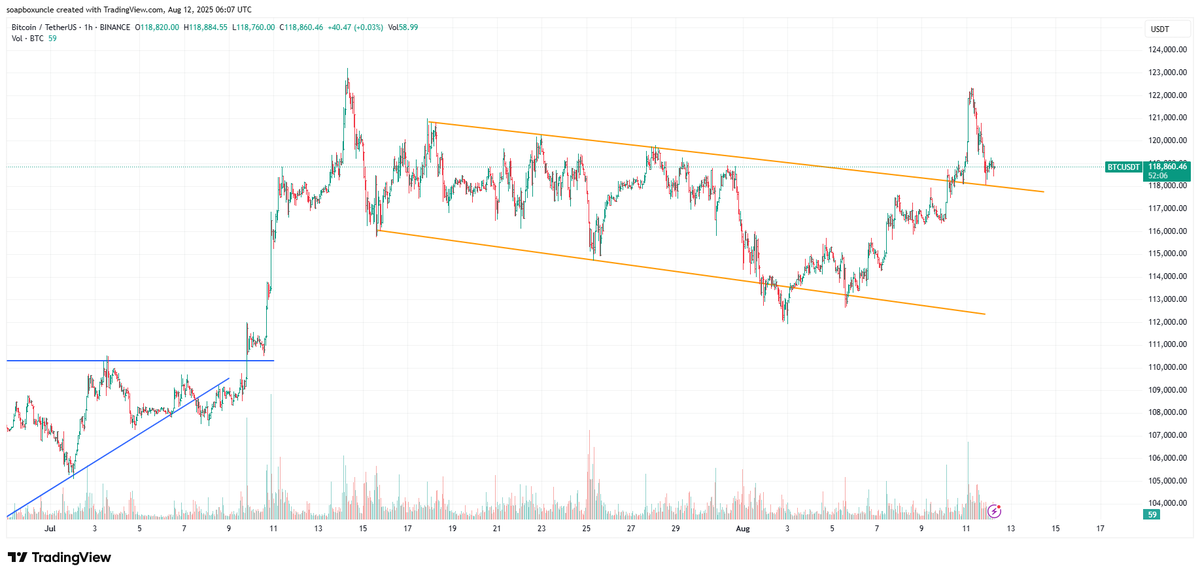
On the 1-hour chart, Bitcoin has broken out of a descending channel (yellow lines) and successfully tested the upper trendline as support twice. This signals a higher probability of an upward move rather than a decline. #Bitcoin #BTC #Crypto #TechnicalAnalysis #Bullish
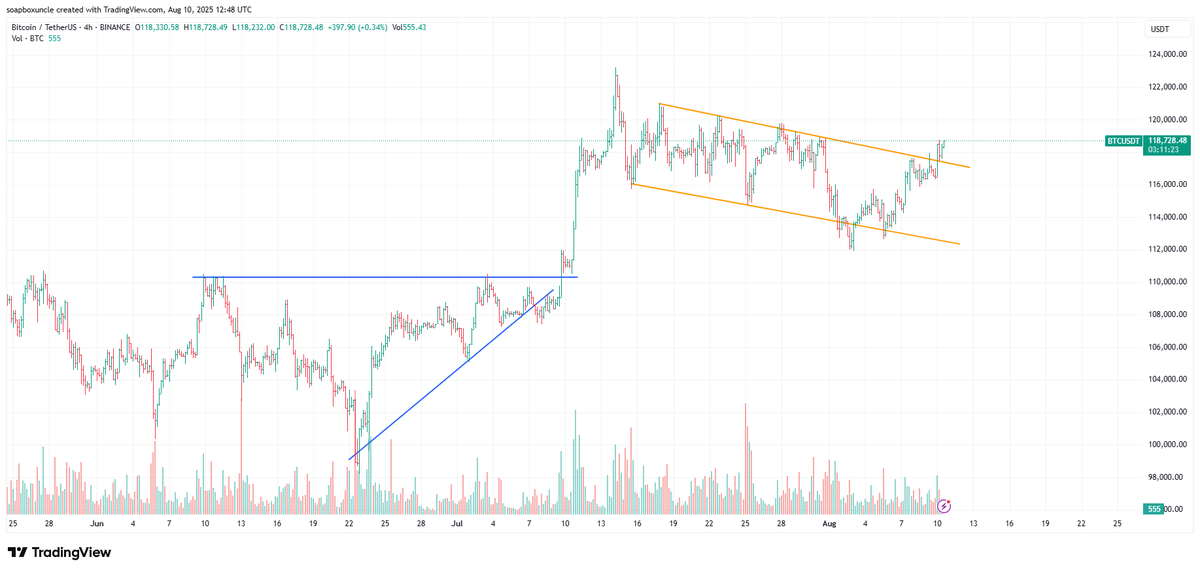
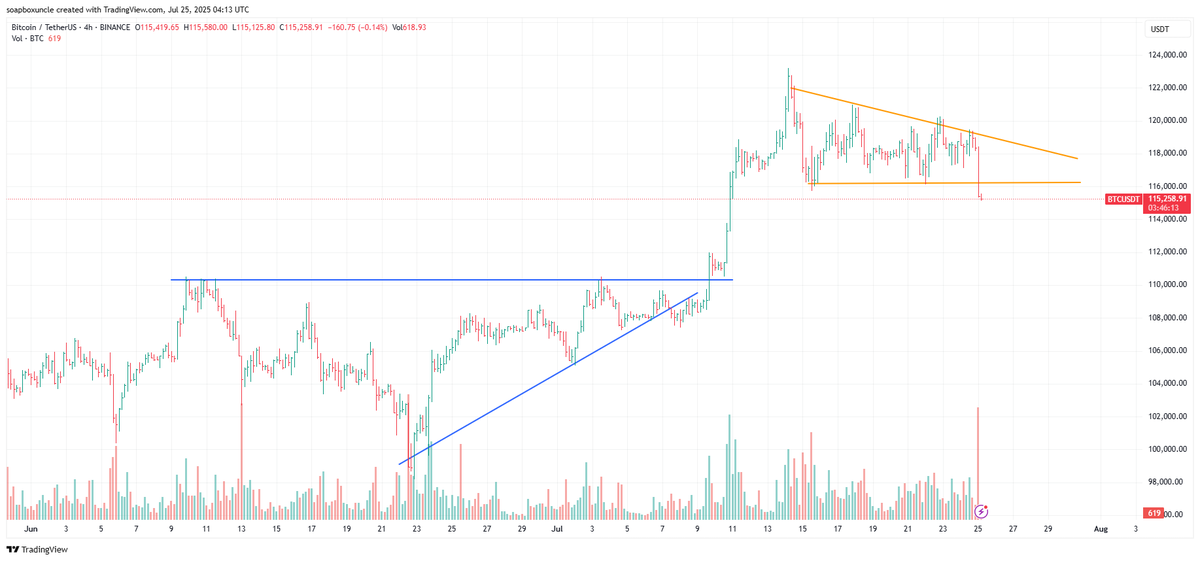
On the 4-hour chart, Bitcoin price has broken out of a descending channel (yellow lines). The top trendline was tested for support two candlesticks ago and is now rising, indicating increased bullish momentum. #Bitcoin #BTC #Crypto #Bullish #Trading #MarketAnalysis
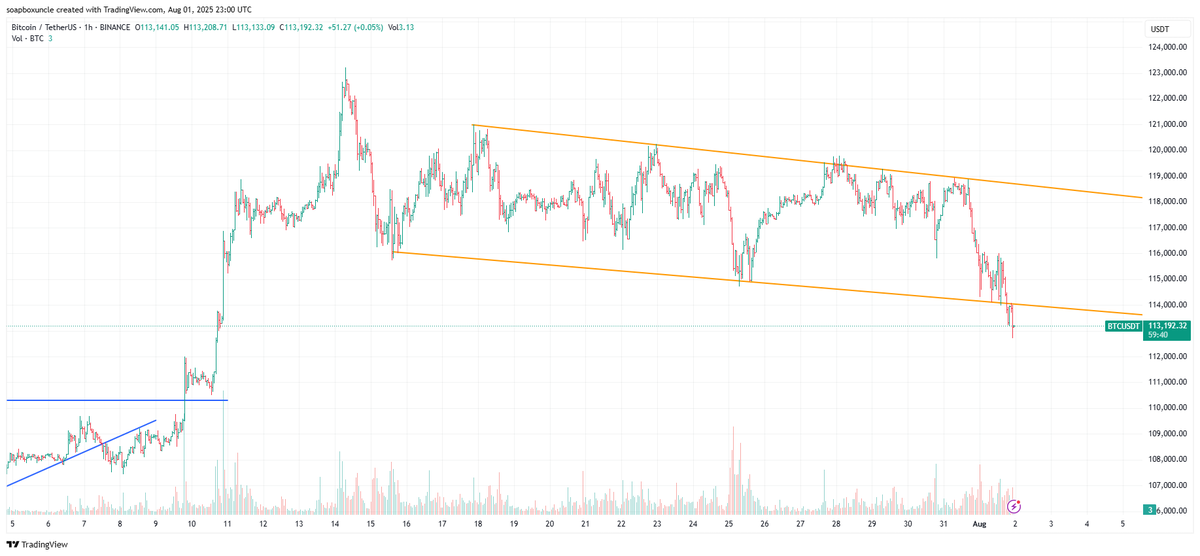
On the 1-hour chart, Bitcoin price has broken below a falling wedge pattern formed since mid-July. The support trendline was tested as resistance an hour ago, suggesting a potential continued decline in price. #Bitcoin #BTC #Crypto #Cryptocurrency #Trading #TechnicalAnalysis…
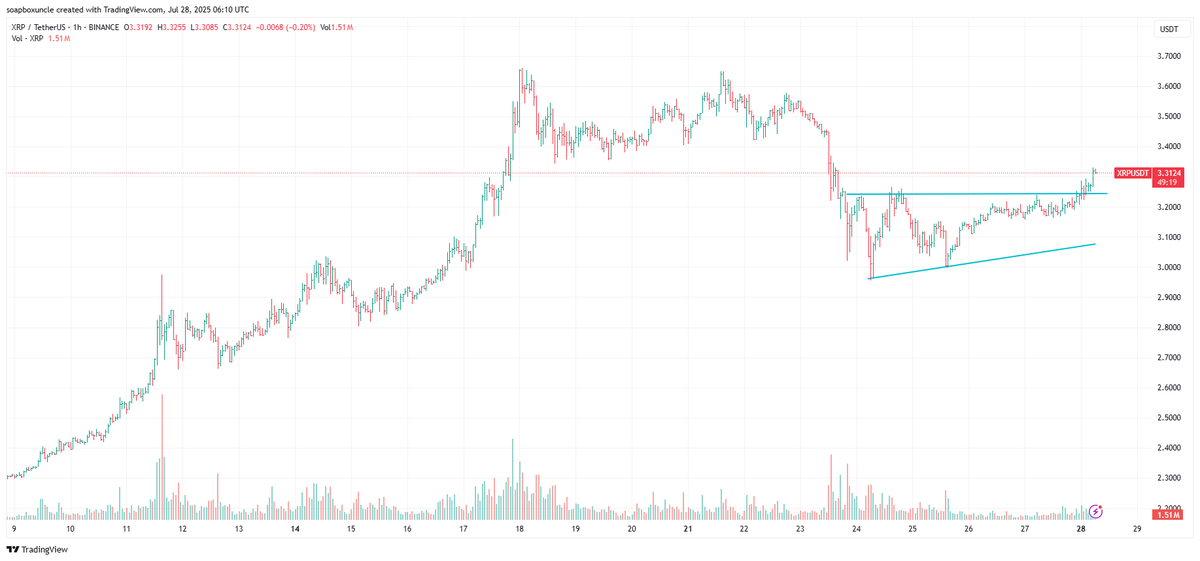
XRP broke out of an ascending triangle on the hourly chart (blue lines). Support tested a few hours ago. Near-term target: $3.60. #XRP #Crypto #TechnicalAnalysis #Priceprediction
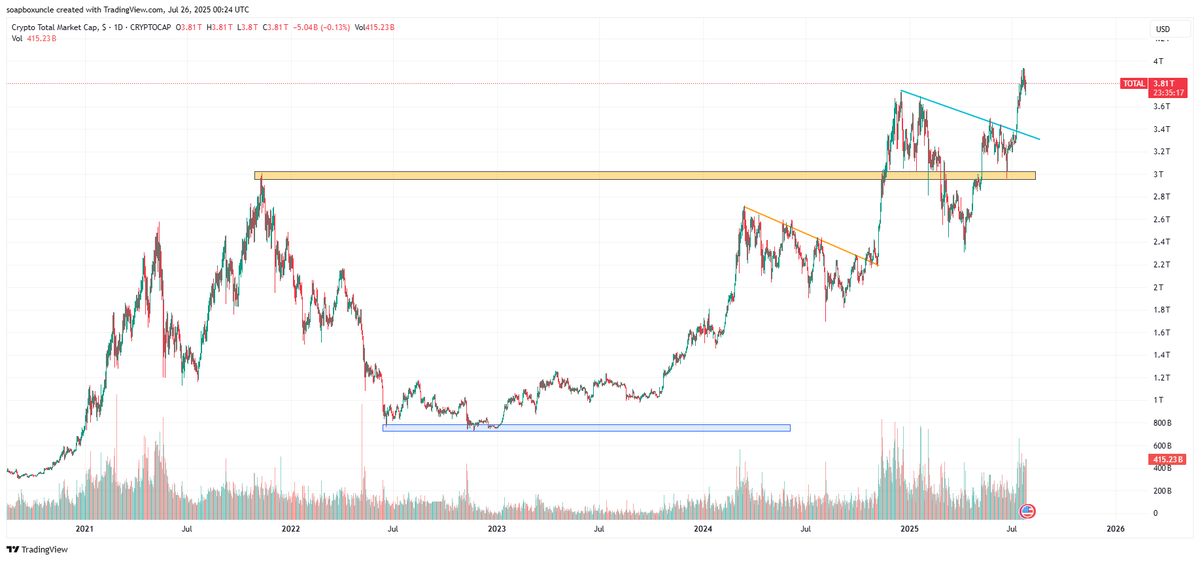
It may seem unusual to think that the total cryptocurrency market cap follows chart patterns, but this daily chart illustrates it clearly. Notably, the yellow down-sloping trendline in 2024 was broken and retested before the price surged. Now, a parallel down-sloping trendline…
On the 4-hour chart, Bitcoin price is breaking below a descending triangle pattern (yellow lines), signaling bearish momentum. #Bitcoin #BTC #Crypto #TechnicalAnalysis #CryptoMarkets
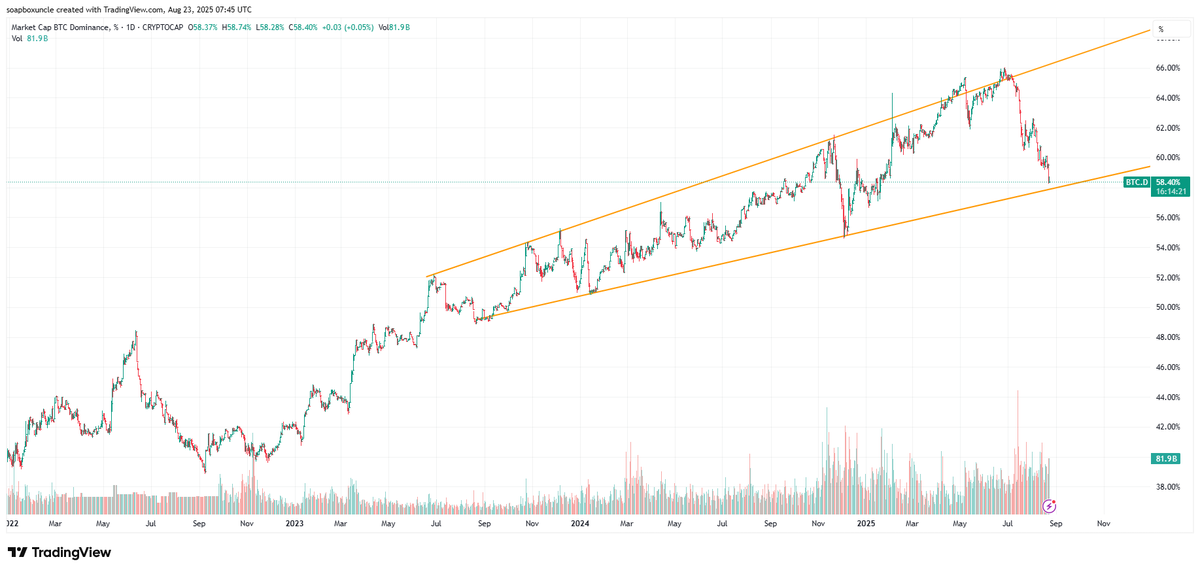
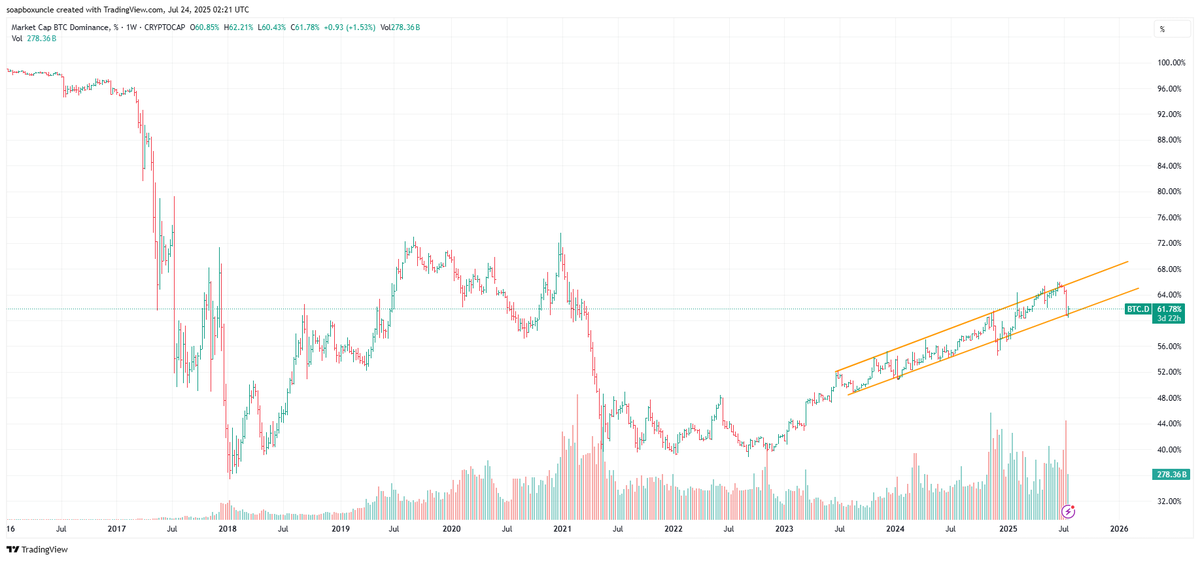
Bitcoin dominance on the weekly chart forms an ascending channel (yellow lines). Near the lower line, Bitcoin outperforms altcoins as total market cap grows. Near the upper line, altcoins may lead. Currently, Bitcoin looks stronger. Watch BTC.D near 70—historically a key…
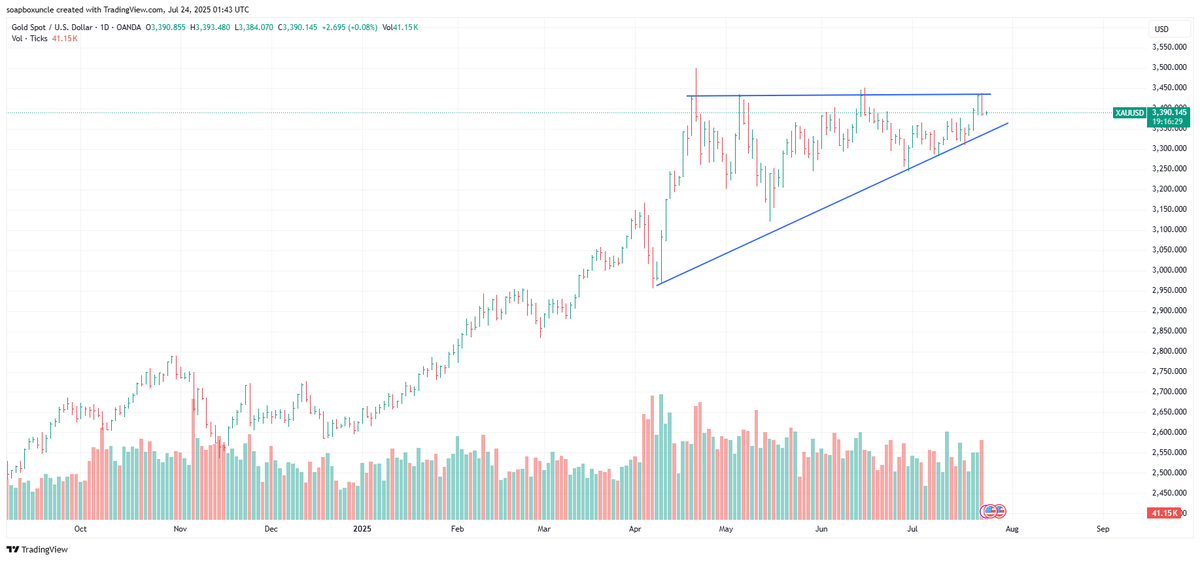
Gold price on the daily chart is forming an ascending triangle. A breakout above the upper trendline could signal strong bullish momentum. #Gold #XAUUSD #TechnicalAnalysis #Trading #InvestingTips
Silver price is at a major milestone. Specifically, price had recently broken out of a rising pennant (yellow lines) and tested the upper trendline for support. At the same time, it had also bounced off the upper trendline of an ascending channel (top blue line) and is now…

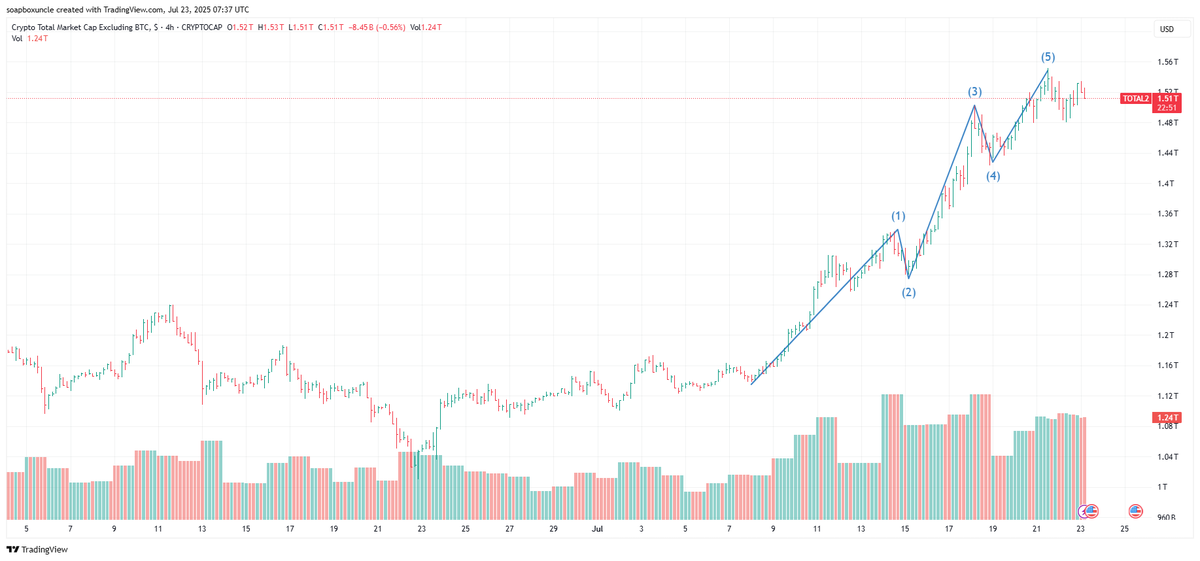
Further evidence that #altseason may be over. Using #ElliotWaveTheory, the 4-hour chart of #TOTAL2 (total market cap excluding #BTC) seems to suggest that Wave 5 has been completed. #Crypto #MarketAnalysis
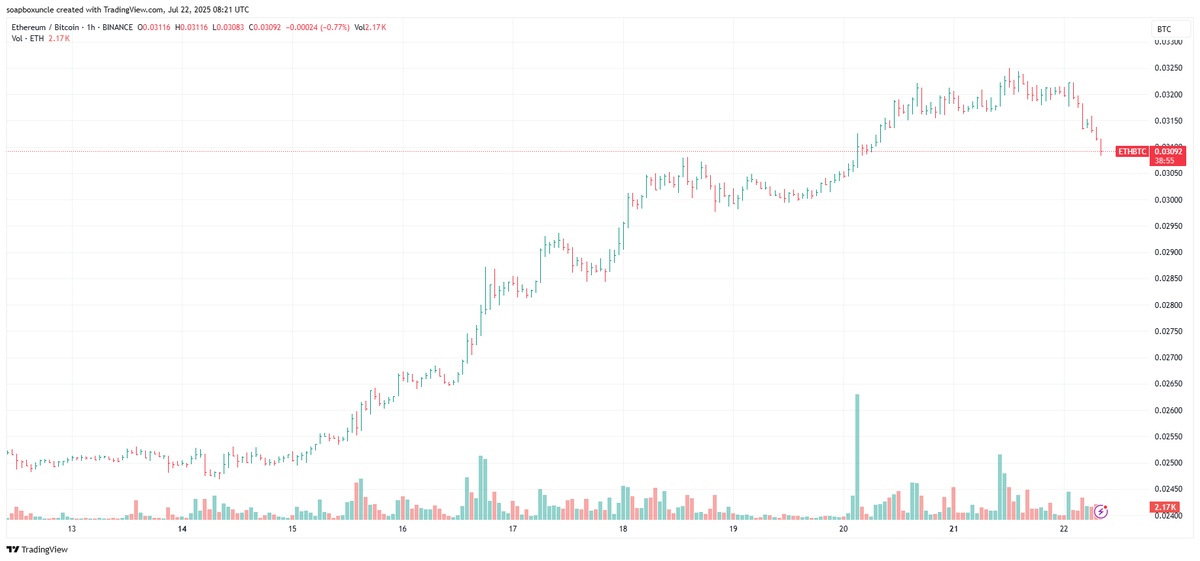
Altseason may be over. One sign of this is the 1 hour ETHBTC chart, which shows price breaking below the 0.0315 to 0.0325 zone and seems headed to test the 0.03 level for support. #CryptoMarkets
Bitcoin's price is currently in a downtrend. On the daily chart, it has broken below the lower trendline of a symmetrical triangle formation (highlighted in blue), indicating a potential continuation of the decline. Further confirmation of this bearish bias can be seen on the…

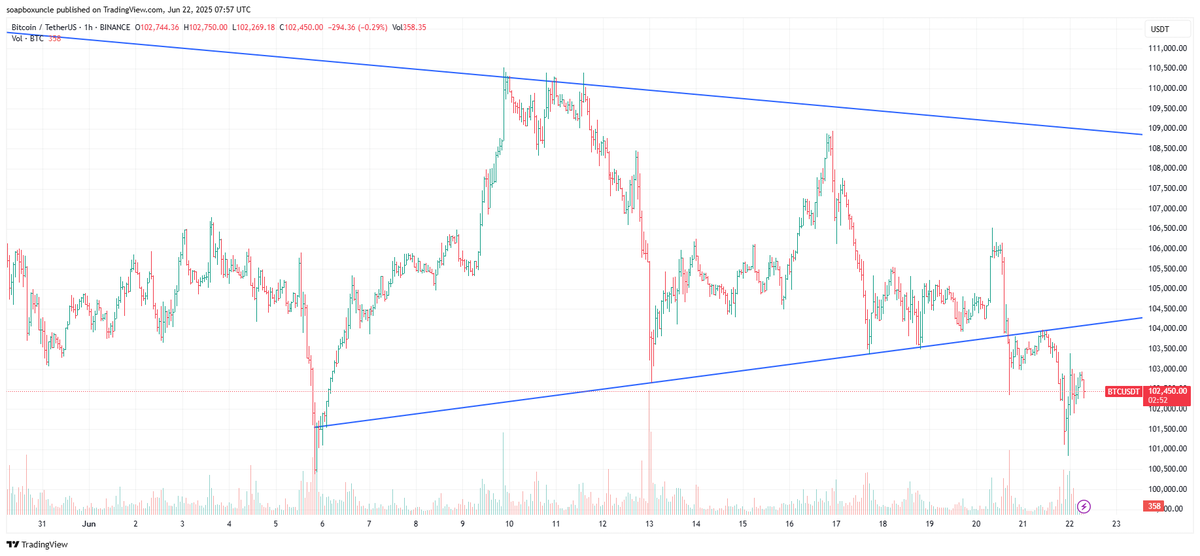
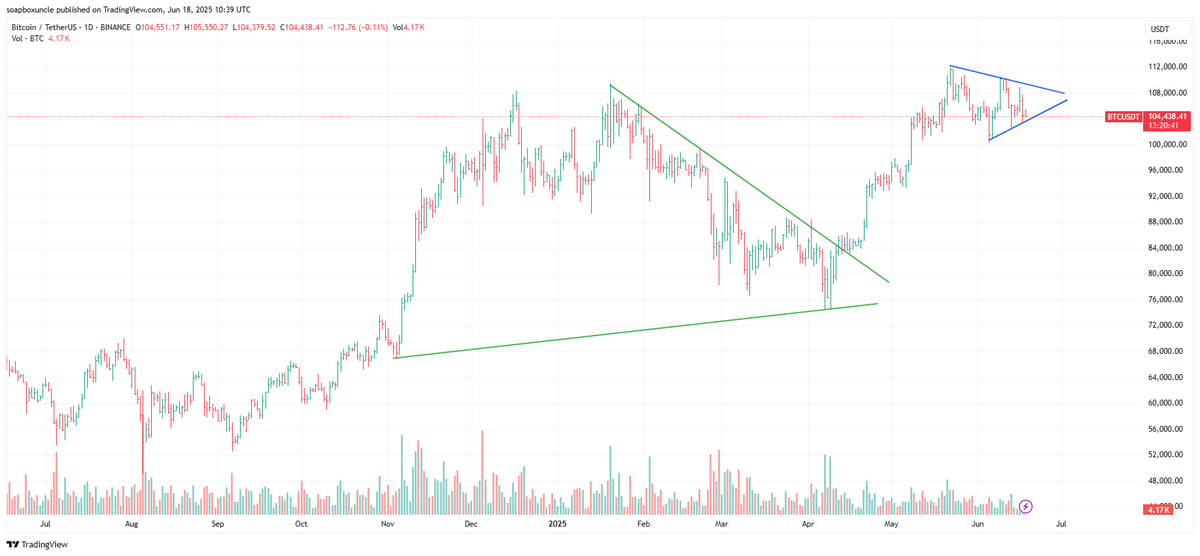
On the daily chart, Bitcoin's price has formed a symmetrical triangle pattern, as indicated by the blue trendlines. I'm currently monitoring the price action to see whether it breaks out above the upper trendline or below the lower trendline, as this will likely provide insight…
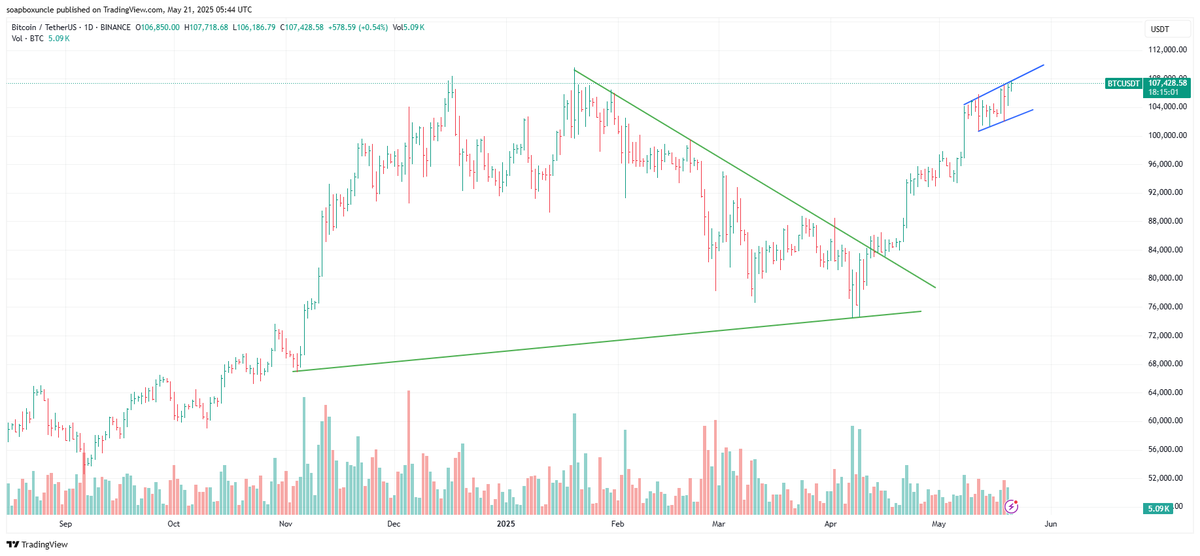
Bitcoin's price has broken out of the uptrending channel on the daily chart, a development that's further reinforced by the recent breach of the previous all-time high at $109K. This combination of technical signals is extremely bullish, suggesting a potential shift in momentum…

On the daily chart, Bitcoin's price is currently trending within an uptrending channel (blue zone). Given the nature of this pattern, there's a higher probability of the price breaking downwards rather than upwards. As a result, I'm exercising caution with buying Bitcoin at this…


United States Tendenze
- 1. #UFCQatar 9,840 posts
- 2. Good Saturday 32K posts
- 3. Delap 19.5K posts
- 4. GAME DAY 27.3K posts
- 5. Guiu 10.6K posts
- 6. #SaturdayVibes 4,540 posts
- 7. Burnley 40.2K posts
- 8. Andrey Santos 8,801 posts
- 9. Camp Nou 37.4K posts
- 10. #Caturday 3,468 posts
- 11. Chelsea 118K posts
- 12. #MeAndTheeSeriesEP2 869K posts
- 13. Lewandowski 9,938 posts
- 14. Enzo 38.5K posts
- 15. #BURCHE 25K posts
- 16. Denzel Freeman N/A
- 17. Gittens 10.9K posts
- 18. Maresca 21.1K posts
- 19. Neto 27.7K posts
- 20. Somali 89.9K posts


Something went wrong.
Something went wrong.