
.adooorah
@sql_yst
🟠data enthusiast || https://github.com/adoora-analytics || https://www.linkedin.com/in/emmanuel-obajimi-76275524 || fellow analysts let's connect
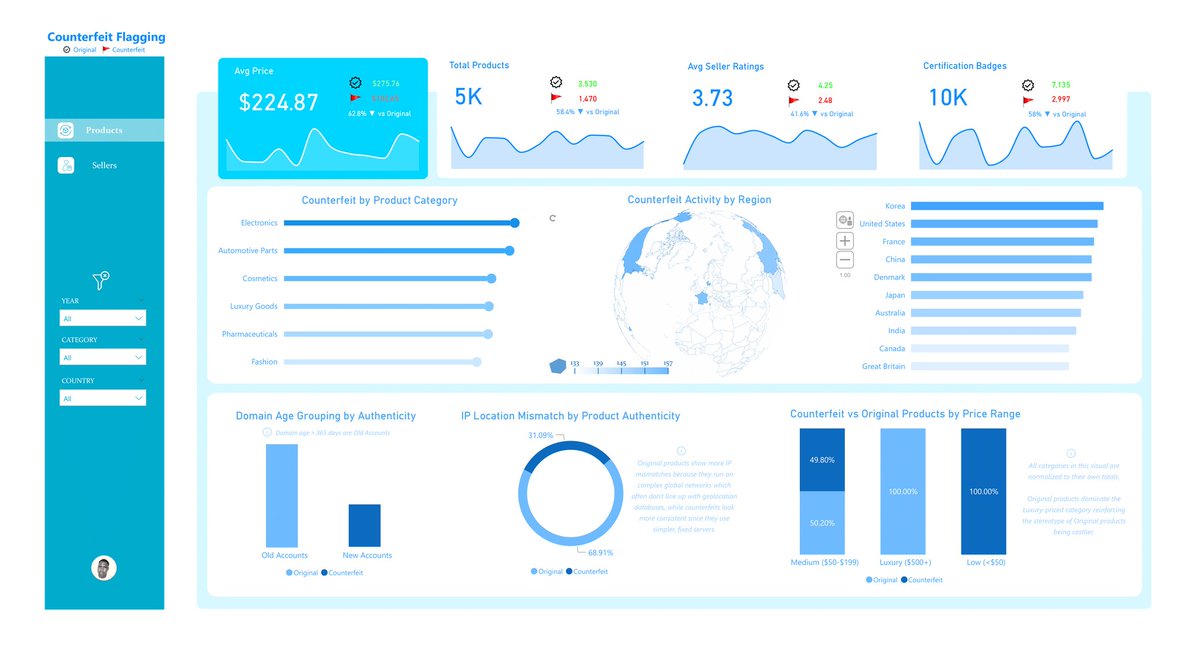
alrightyyy. i made this w power BI

September dump but let’s make it dashboard/report edition. 📊🔥 Shall we?👀 Quote yours…let’s go✨ PS: Saw this morning that this report also made it to Top 5 for Onyx challenge 😊💃 • Top 5 & 2nd runner up - ZoomChart mini challenge • Top 5 - Onyx challenge 👏👏

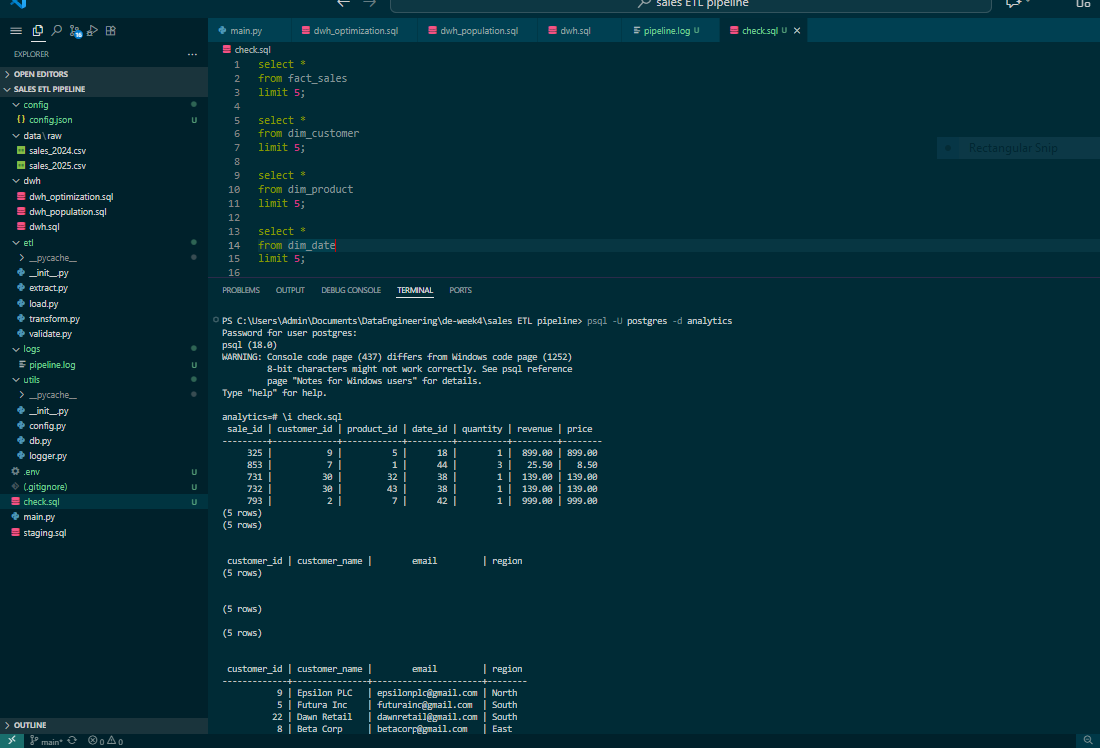
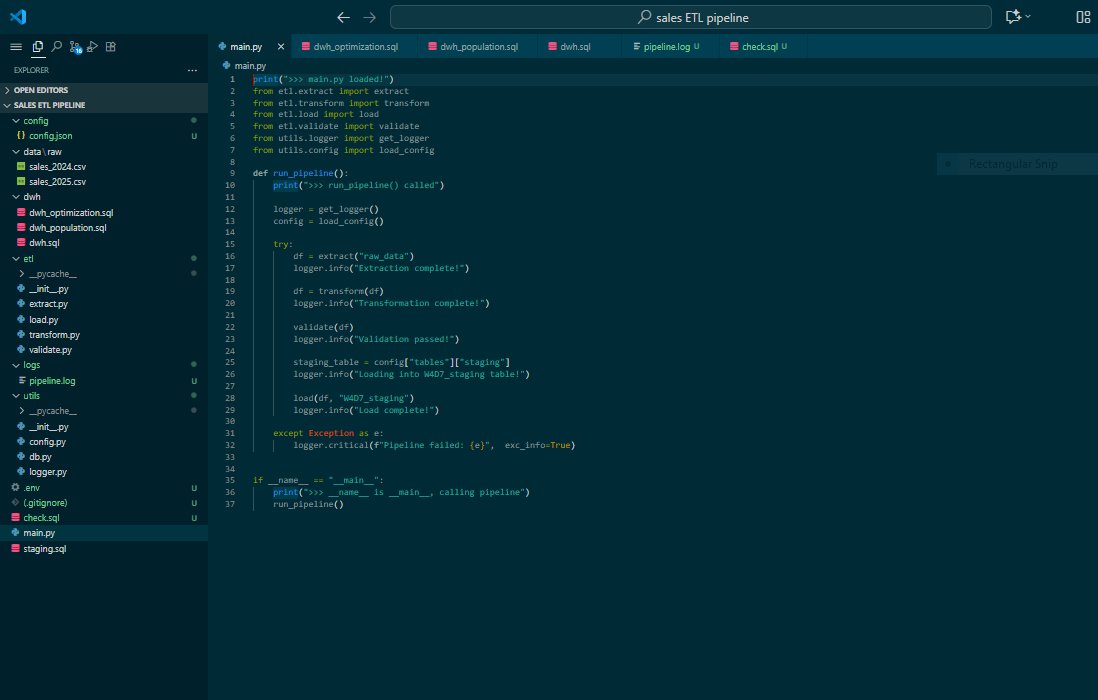
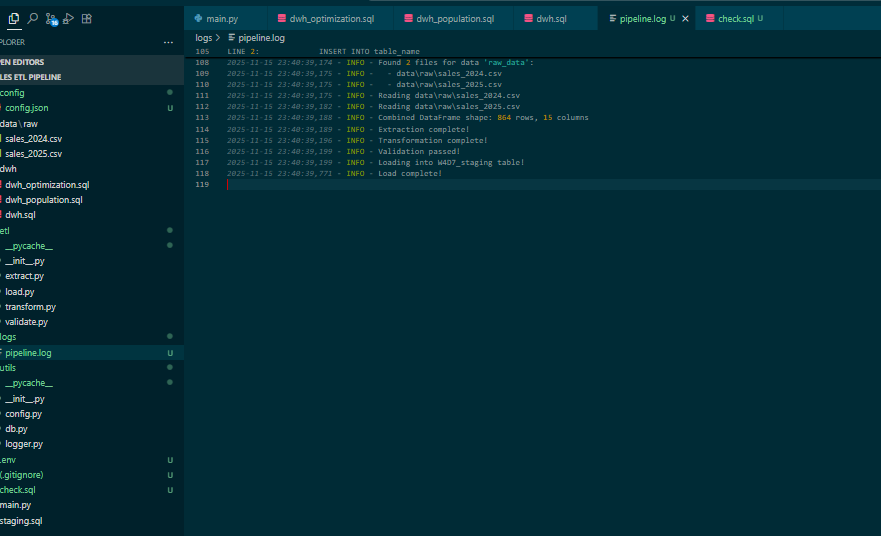
i’ve been off the timeline for a bit. been grinding and learning. today it paid off 💪 i just completed my first Data Engineering project: a beginner-friendly ETL pipeline for sales data → PostgreSQL. repo: github.com/adoora-analyti… #learninginpublic #python #dataengineering

Stage 4 ✅ This stage 5 is already hot
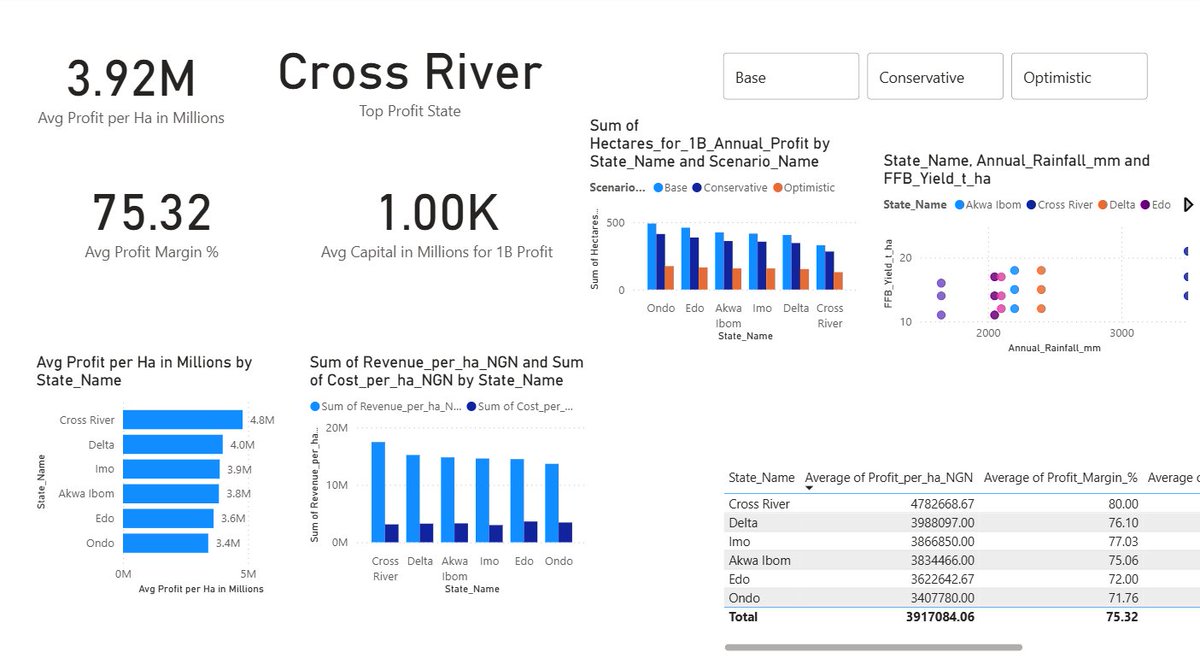
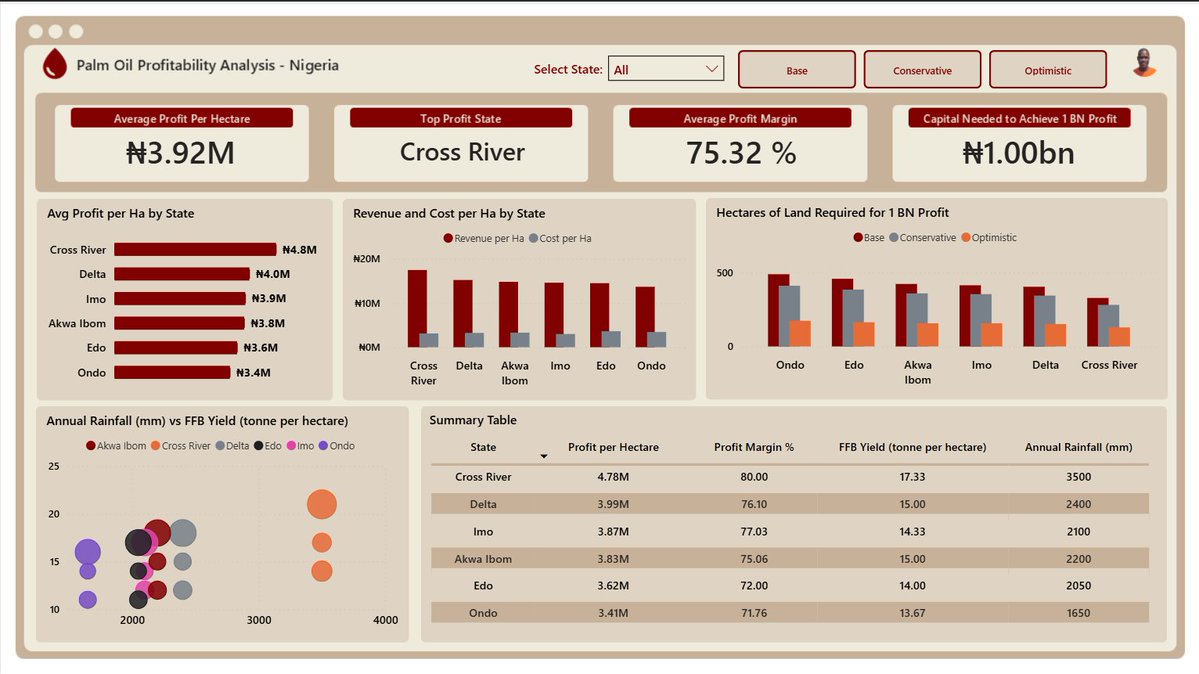
HNG Internship Stage 4: Palm Oil Profitability Analysis - Nigeria 🌴 I designed an interactive dashboard that displays the breakdown of yields, costs, and profit potential across major producing states.

𝗔𝘀 𝗮 𝗯𝗲𝗴𝗶𝗻𝗻𝗲𝗿, 𝗜 𝗰𝗮𝗻’𝘁 𝘀𝘁𝗿𝗲𝘀𝘀 𝘁𝗵𝗶𝘀 𝗲𝗻𝗼𝘂𝗴𝗵. Building in public can take you to the next level. I’m one month into my data engineering journey. One month of sharing what I learn. One month of building projects publicly. And already, an opportunity…

Okay guys, back to this project of mine 😅 So the data I scraped was Unilag cut off points for all faculties from 2019-2025. I was able to scrape the data from Unilag's website and change it to the structure in frame 2 thanks to Unpivot feature in Power Query. Dashboard ⏭️


I'm currently scraping 6 years worth of data from the internet, so I can run a yearly comparative analysis. Funny part is the visualization is going to be a one-pager or max two pages. The important thing is that it's a real data project, directly from the source.
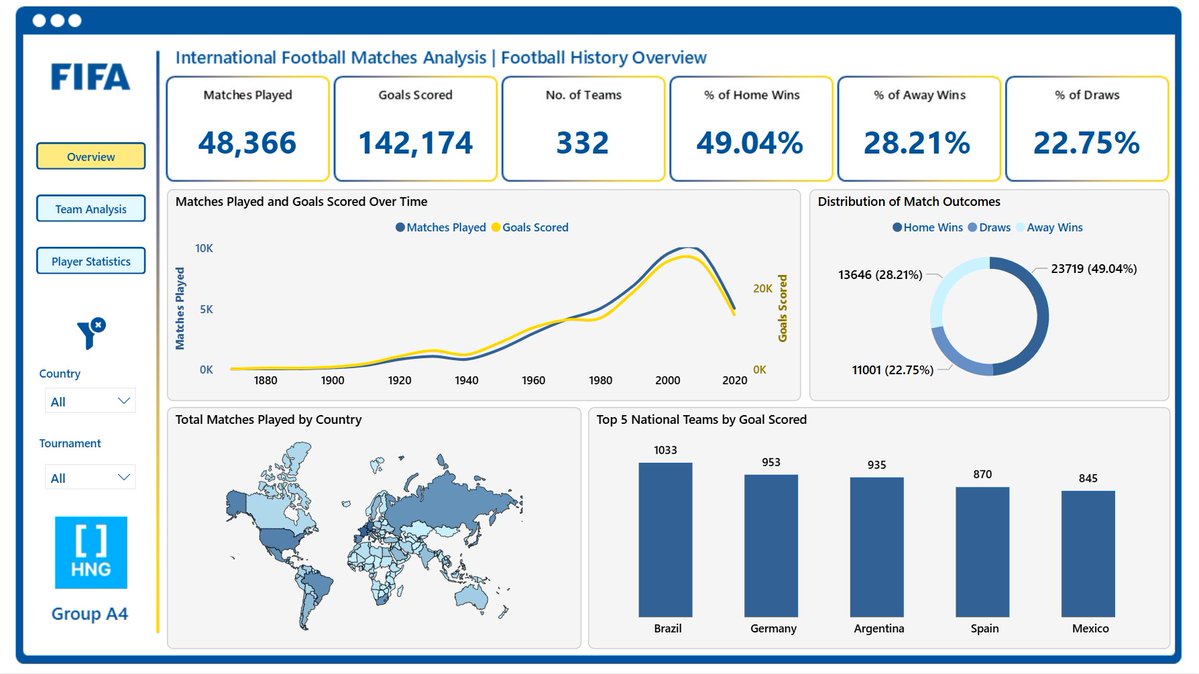
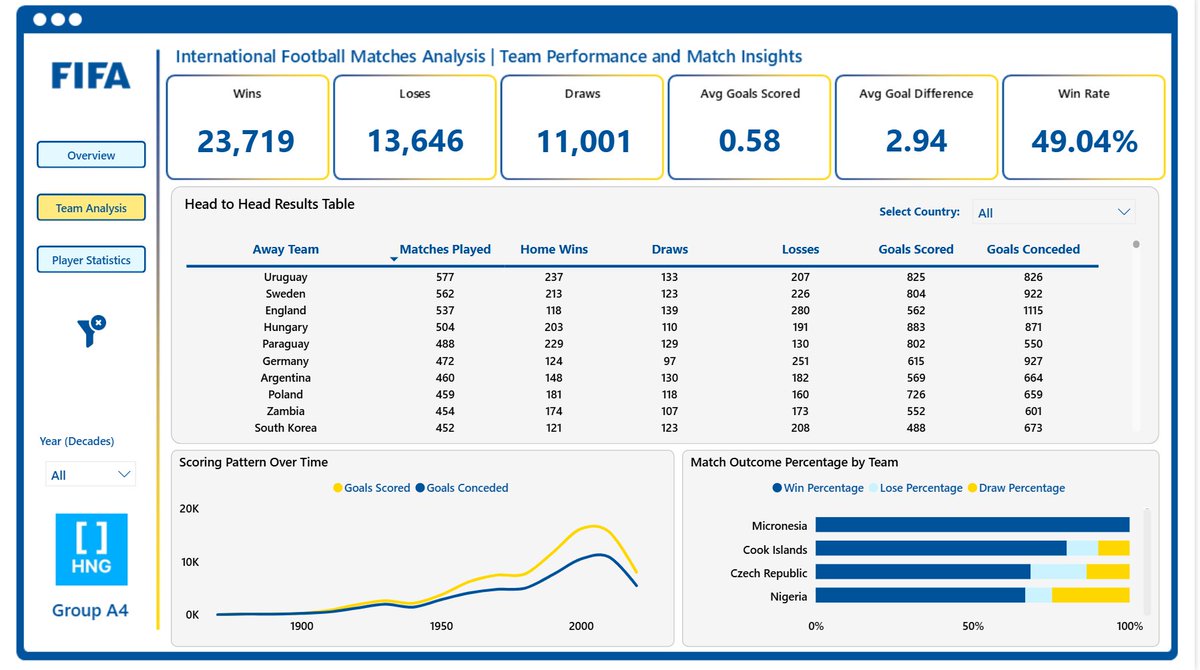
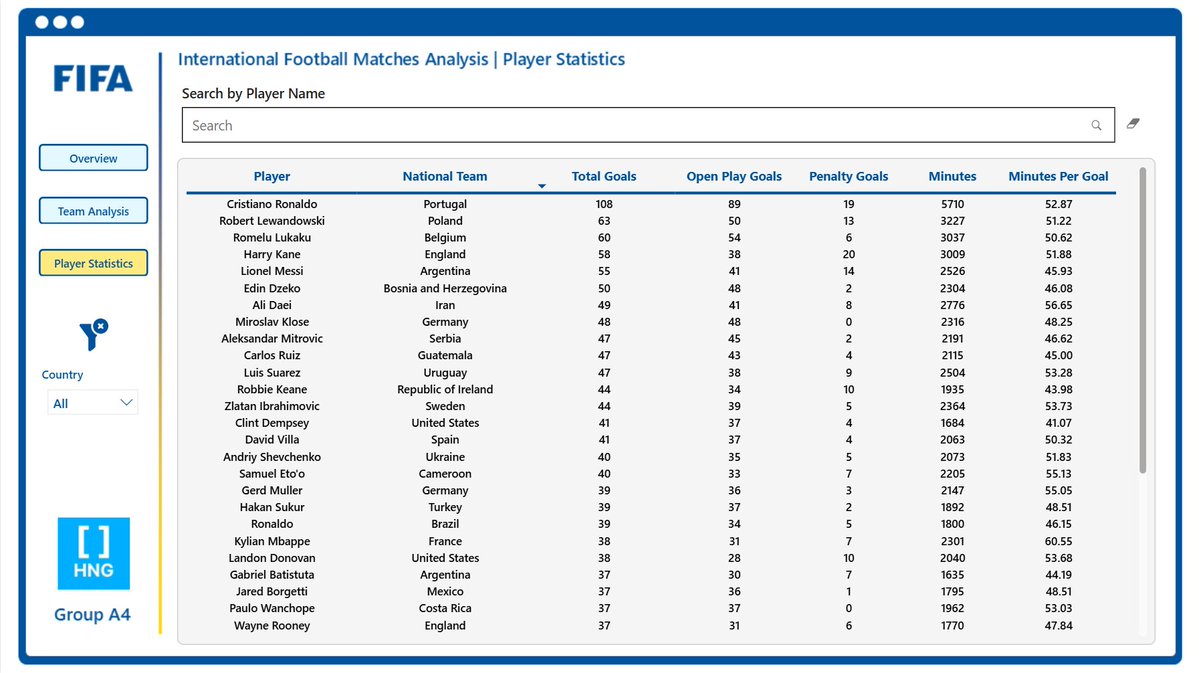
HNG Internship Task 3A was a group task. We stepped into the shoes of a data analyst at FIFA and analyzed over 150 years of international football data to uncover hidden insights and trends. I really enjoyed this one because it was something I could relate with.

The Nadradar site (which tracks DApp activity) doesn’t load data as regular HTML , it’s rendered dynamically through JavaScript. Meaning Power Query’s “From Web” can’t see it So instead of stopping there, I went deeper, found the API endpoint feeding the site, pulled it to Excel
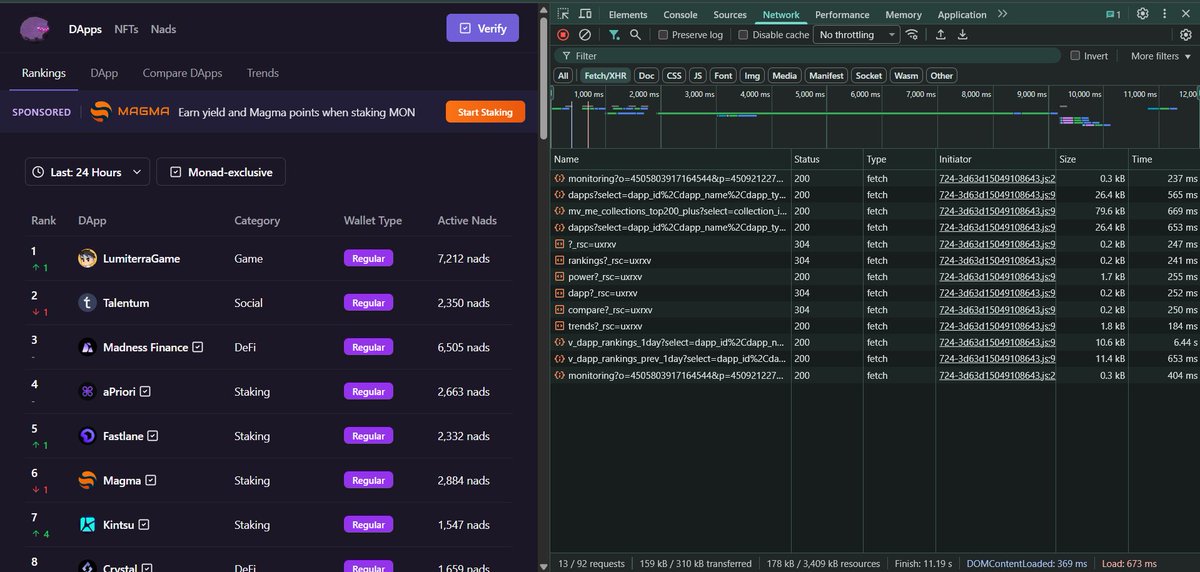
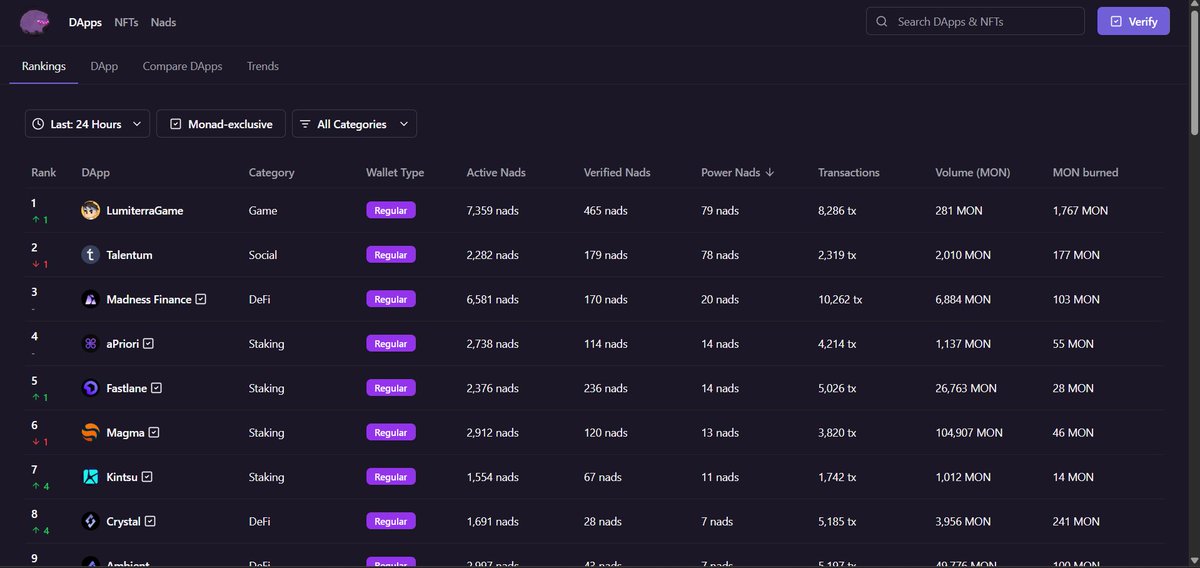
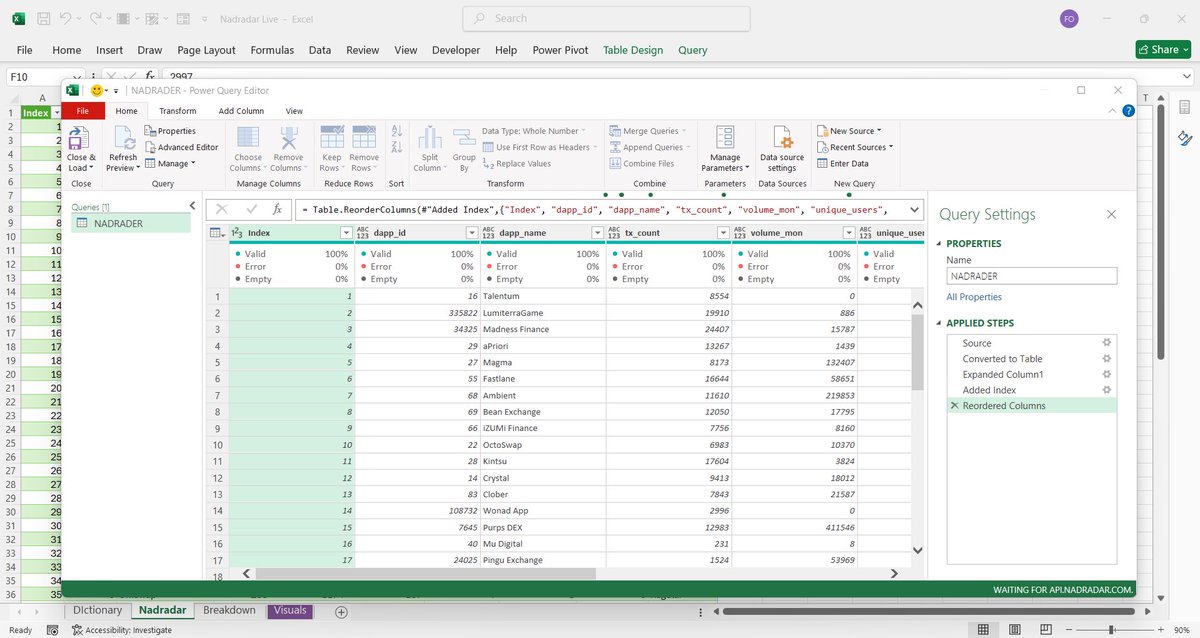
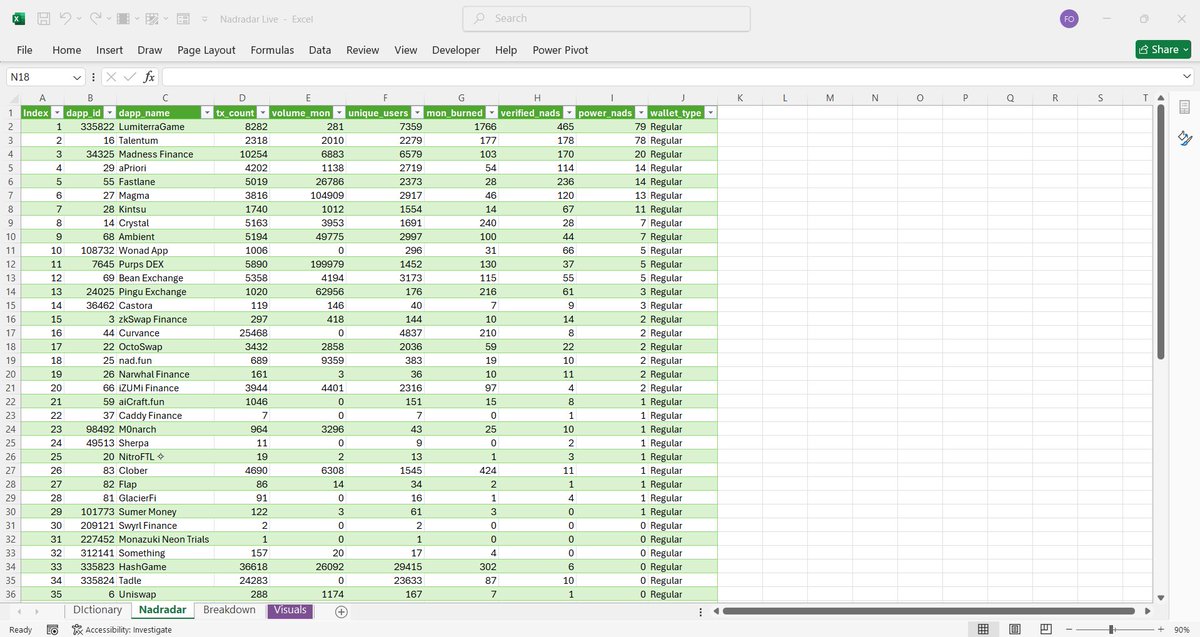
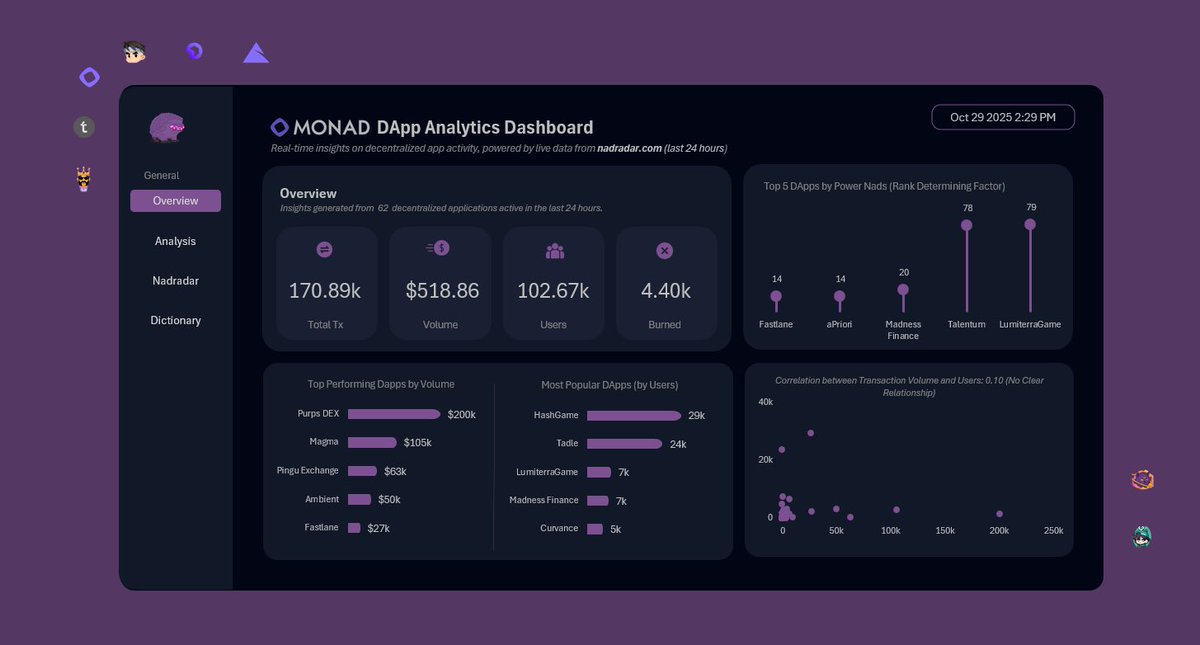
Been hearing about @monad from @0xmar00 So I went digging 👀 Dashboard auto-refreshes every 24hrs from @nad_radar in real time !! What do you think ? #dataanalysis #excel #Monad #DApp #web3
Learnt how to do this on YouTube just this morning. If you want to apply multiple slicers on Power BI, and there isn't enough space, no issues. Just design a filter panel YouTube video link: youtu.be/-VXZh-vDmP0?si…

🍕 From cravings to queries: What pizza taught me about data. I kept seeing pizza dashboards everywhere, so I challenged myself to do one too. But not just a pretty viz. I did real quantitative analysis in SQL and built a full Power BI story. Here’s what I discovered 🧵👇🏽

alrightyyy. i made this w power BI
September dump but let’s make it dashboard/report edition. 📊🔥 Shall we?👀 Quote yours…let’s go✨ PS: Saw this morning that this report also made it to Top 5 for Onyx challenge 😊💃 • Top 5 & 2nd runner up - ZoomChart mini challenge • Top 5 - Onyx challenge 👏👏
chatgpt follow me do 3 truths and 1 lie 😭(first frame)


💡 How to Automatically Generate Documentation for your Power BI Reports 🔗 medium.com/microsoft-powe… 👉 For more: powerbi-masterclass.short.gy/linktree

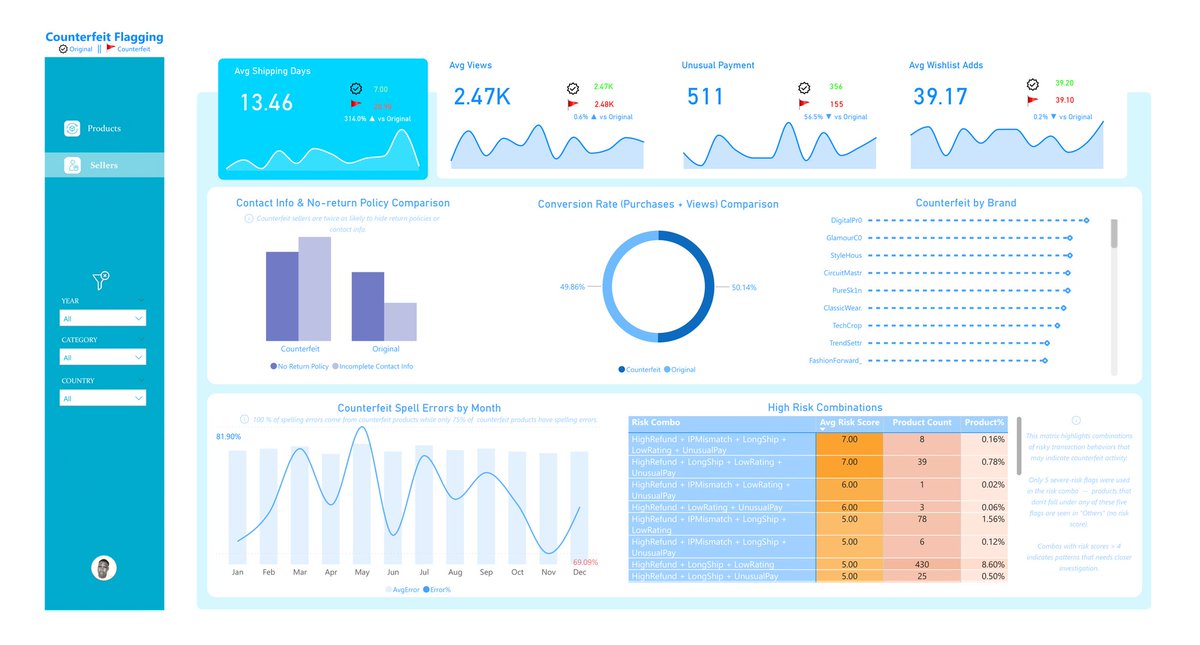
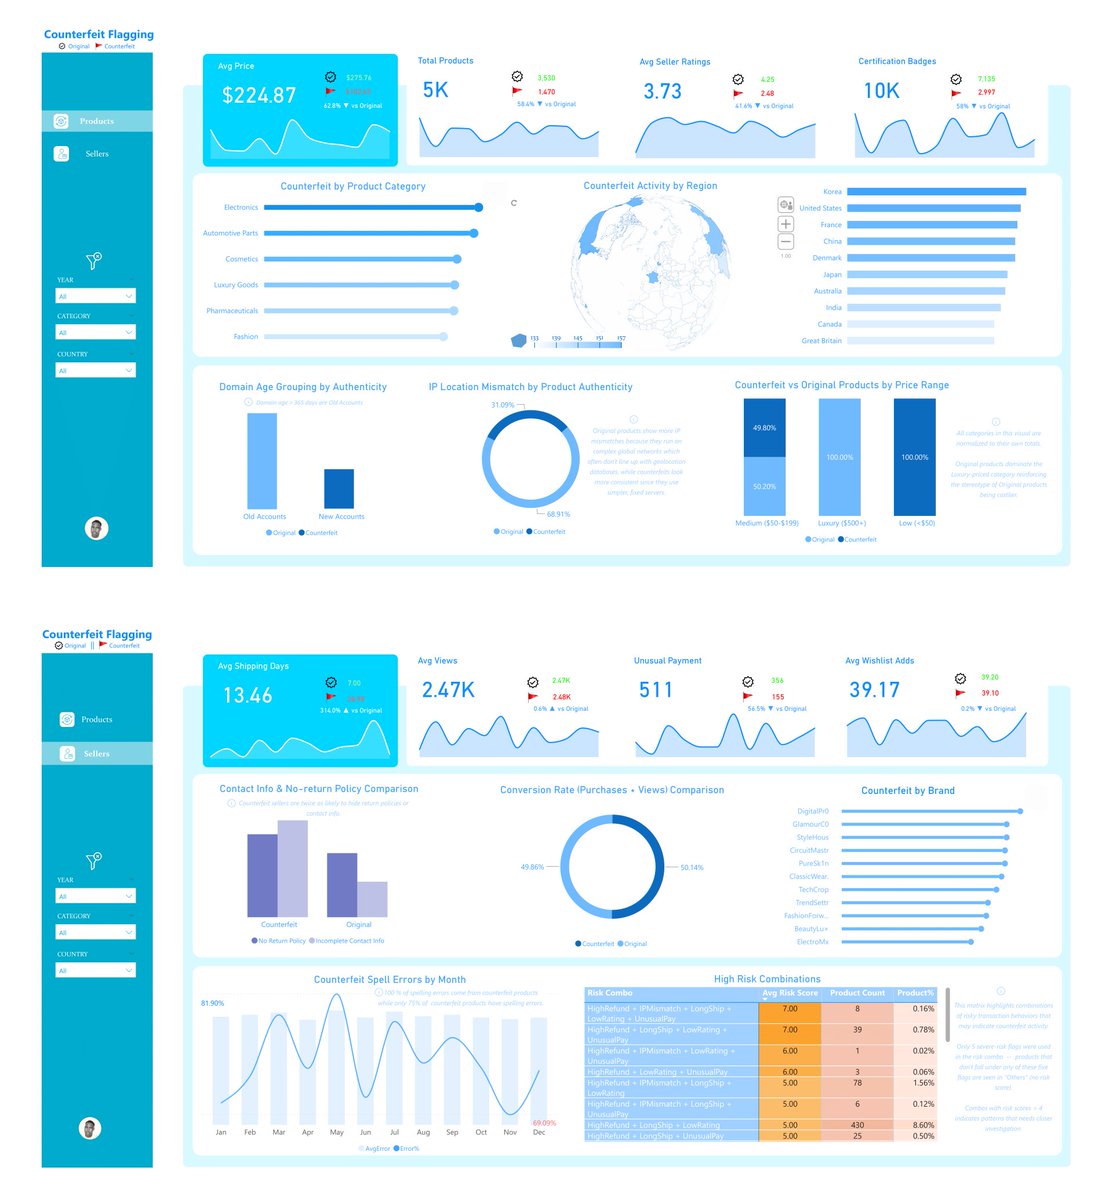
counterfeits aren’t just cheaper — they behave differently. 📊 63% lower price 42% lower ratings 314% slower shipping 100% of spelling errors 🚩 built a power BI dashboard to uncover the red flags. Which signal would you trust most? linkedin.com/posts/emmanuel…
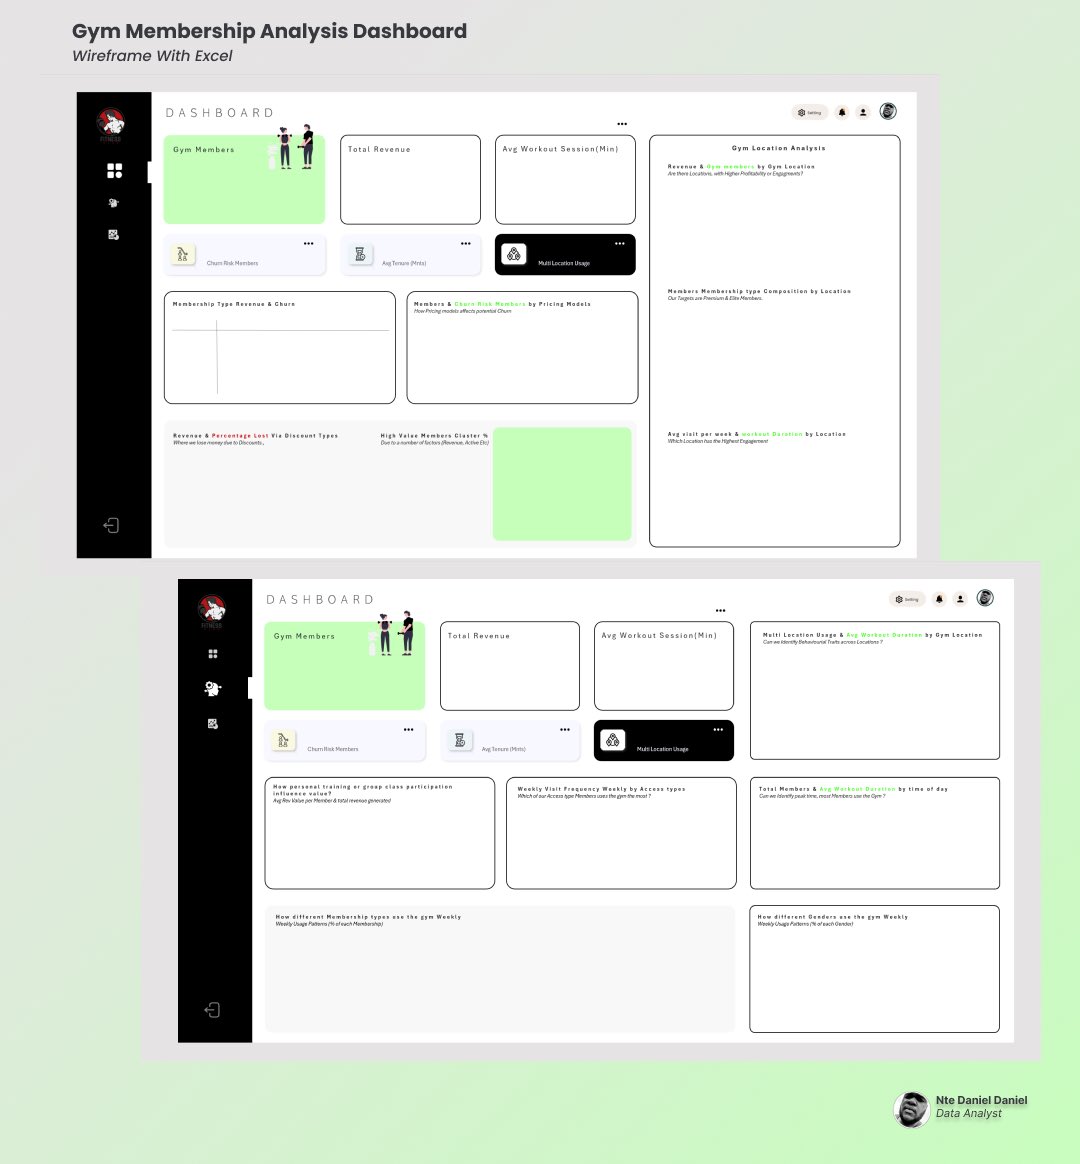
Think you need fancy tools for wireframing? 👀 Nope. I built this entirely in @msexcel . Wireframing = storytelling + visualization done right. If enough of you are interested, I’ll host a free class so we can build it together, say this weekend Deal? 😂😂 #datafam #excel
It’s here! A full End-to-End Power BI E-Commerce Dashboard tutorial drops today at 6 PM! From Power Query → DAX → visuals → dashboard layout → PowerPoint, I show you how to turn raw sales data into interactive, beautiful dashboards. 📺 Watch here: [youtu.be/RprFfyOgw98]

this ucl draw without manchester united


United States Trends
- 1. Josh Allen 36.3K posts
- 2. Texans 57.1K posts
- 3. Bills 151K posts
- 4. Joe Brady 5,144 posts
- 5. #MissUniverse 401K posts
- 6. #MissUniverse 401K posts
- 7. Anderson 27.4K posts
- 8. McDermott 4,508 posts
- 9. Troy 12.3K posts
- 10. Maxey 12.3K posts
- 11. #TNFonPrime 3,646 posts
- 12. #StrayKids_DO_IT_OutNow 44.7K posts
- 13. Cooper Campbell N/A
- 14. Al Michaels N/A
- 15. Dion Dawkins N/A
- 16. Costa de Marfil 24.3K posts
- 17. #htownmade 3,809 posts
- 18. Shakir 5,631 posts
- 19. STRAY KIDS DO IT IS DIVINE 46.7K posts
- 20. Stroud 3,479 posts
Something went wrong.
Something went wrong.