
The bigrock Capitals
@thebigrok11
Stock market trend/momentum traders with a risk-first approach. Posts are not investment advice.
NIFTY SMALL CAP 100 INDEX WEEKLY SET-UP ☺️ AS ANALYZED - good buy!!😊, brking out!!

NIFTY SMALL VAP 100 INDEX CHART AS ANALYZED: weekly set-up ☺️.


oracle chart 📈 as shown could be behaving. Daily TF. $240-245 buy area

Check out my #ORCL analysis on @TradingView: tradingview.com/x/uNUVeco6/

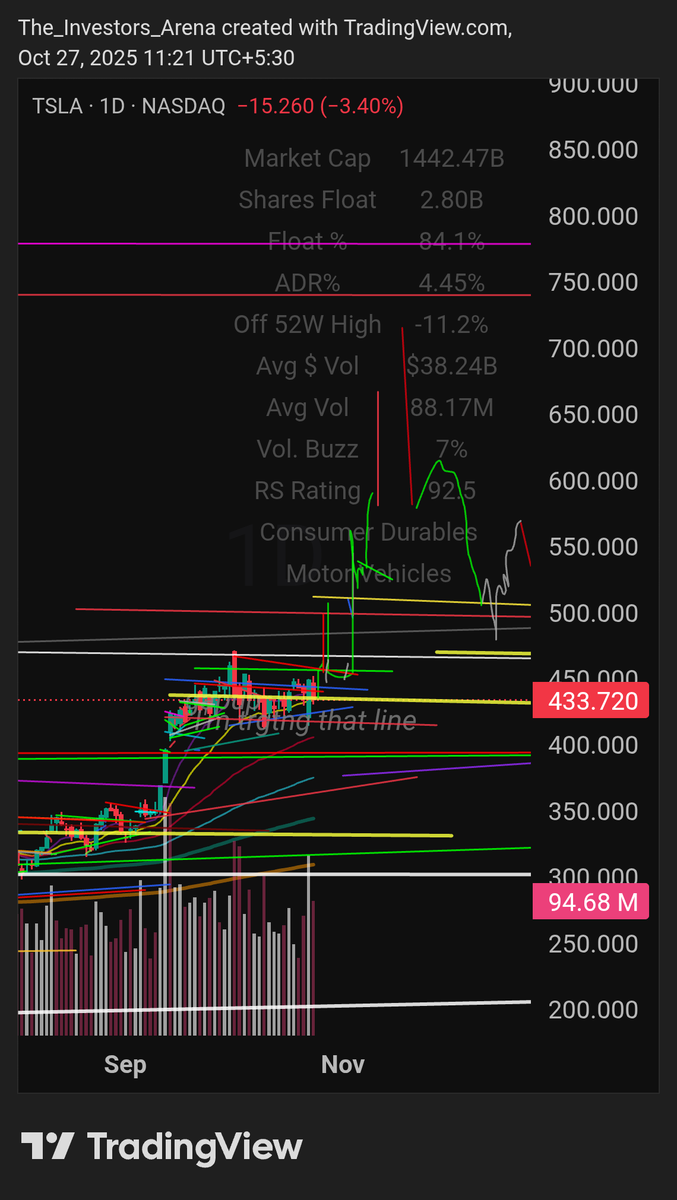
This is an hourly chartExpect $TSLA doing something similar 😊👍🏻☝🏻. a gap down and keep going up to late 500s

Tech vs. Everything. > $NVDA (16.7%) > $MSFT (13.15%) > $AAPL( 13.12%) > $GOOG (10.6%) > $AMZN (8.07%) The top five US stocks now represent 61.6% of US GDP The prior peak was 43.8% in 2021 During the dot-com bubble, it was 21.9%🤞🏻😊


United States الاتجاهات
- 1. #AEWDynamite 11.9K posts
- 2. #Survivor49 2,391 posts
- 3. #SistasOnBET 1,151 posts
- 4. #iubb 1,164 posts
- 5. Athena 10.9K posts
- 6. #ALLCAPS 1,237 posts
- 7. Binnington 1,270 posts
- 8. Savannah 5,118 posts
- 9. Ovechkin 5,194 posts
- 10. Godzilla 27.6K posts
- 11. Harley 11.6K posts
- 12. Cade Cunningham 1,474 posts
- 13. Claudio 50.5K posts
- 14. Mitchell Robinson N/A
- 15. Lamar Wilkerson N/A
- 16. Unplanned 3,751 posts
- 17. Paige 28.8K posts
- 18. Randle 2,872 posts
- 19. Jalen Duren N/A
- 20. Breeze 24.7K posts
Something went wrong.
Something went wrong.