
nearly everything that is a good repeatable trading idea looks like: "under <some circumstances> this thing is likely to be too cheap/rich because <some people> are being forced or greedy or stupid... so the thing is more likely to go up/down in the future"
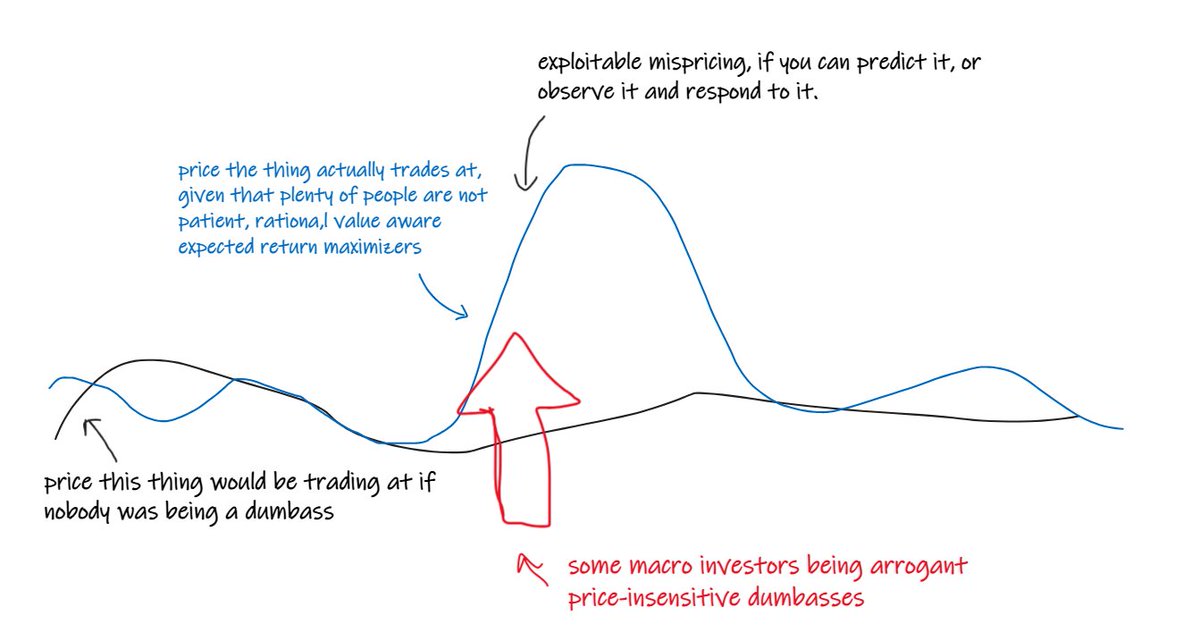
your job as trader, operating in an efficient, competitive market, is to tell yourself that your idea about that is probably bullshit. and quickly prove to yourself that it is indeed bullshit. destroy those hopes and dreams quickly... and move onto something more productive.

you can show that something is a BAD idea way quicker than you can show yourself that it's a good idea. and showing yourself quickly that something is a bad idea is a GOOD thing...
...cos then you can spend your valuable time and energy on other things. like looking at other ideas you have... ...or eating a burger, or petting your cat, or doing freaky stuff with your wife or her friend or whatever.

so if you have an idea, don't construct some perfect analysis project to investigate it. just try to show yourself that it's probably a crap idea using the most accessible data and simplest methods available to you. (90 delta it is a crap idea, so get there quick and move on)
here's one way to do that that is nearly always relevant - grab the most relevant data that is easily accessible to you - measure the condition you are interested in as a number - measure the price change of the thing, after all those measurements
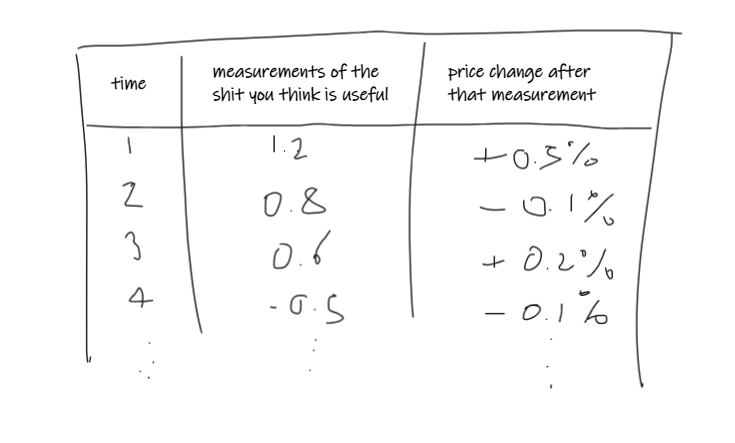
then you want to make a scatterplot where each of those measurements is a dot and... - the measurement of the thing you think is predictive is on the x-axis - the measurement of the price change subsequent to that is on the y-axis
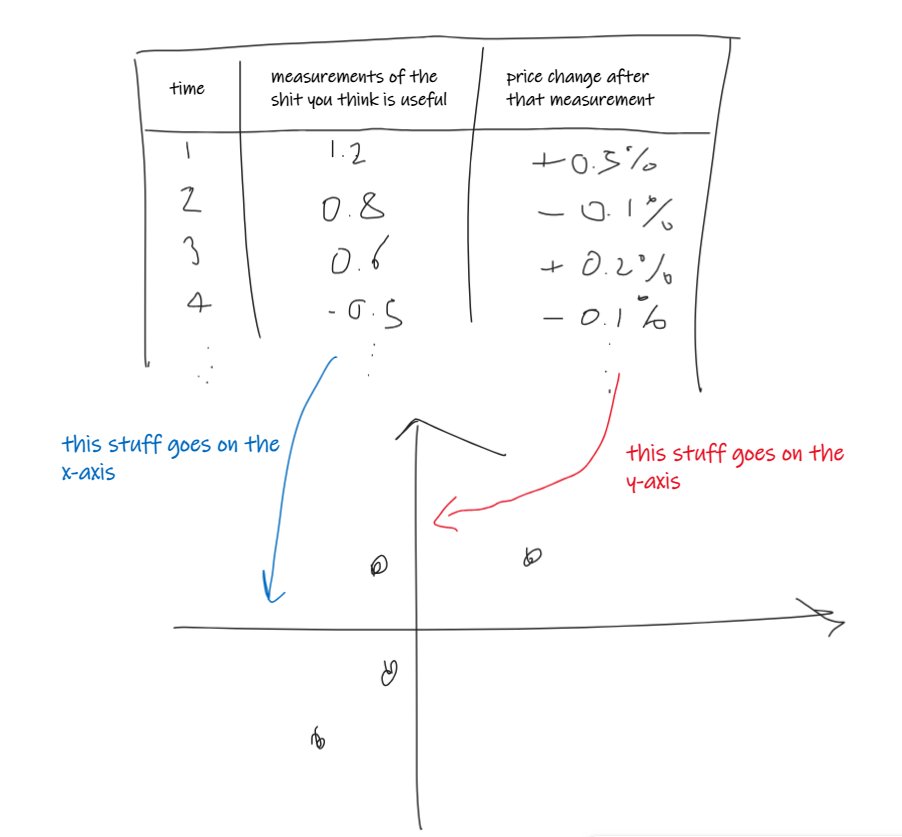
now probably that looks like a big old blob with no clear relationship between the thing you thought was useful and the price change subsequent to observing it.
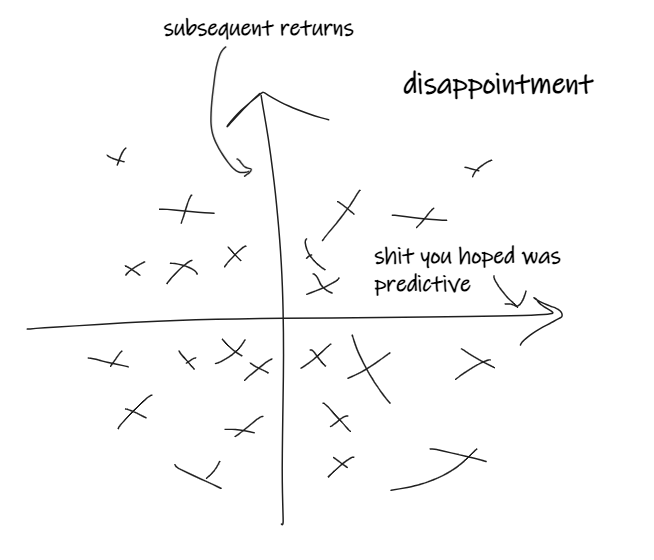
nearly everything looks like that and proving that nearly everything looks like that is important for ridding yourself of overconfidence and false hope. for example, nearly every midbrain on here will tell you that owning SPY below the 200d moving average is a dumb idea
you should bullshit on claims like this. you can... - get some daily SPY prices from yahoo - calculate the distance of the closing price from its 200d moving average each day - plot the percentage returns of SPY the next day against it
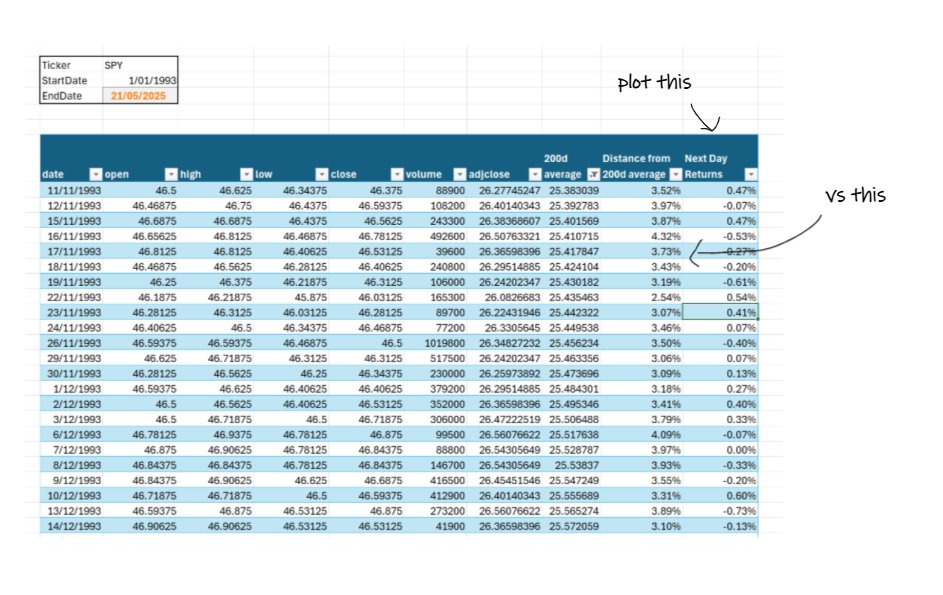
and, unsurprisingly to nobody who does this kind of thing regularly, it looks like a big blob. (the only obvious thing from this chart is that SPY moves more when it is a long way below its moving average... you know this cos people panic when number goes down)

so your claims of bullshit were probably right. holding SPY under the 200d moving average certainly ain't an obviously bad idea. intuitively you knew that ofc. nothing is that easy.
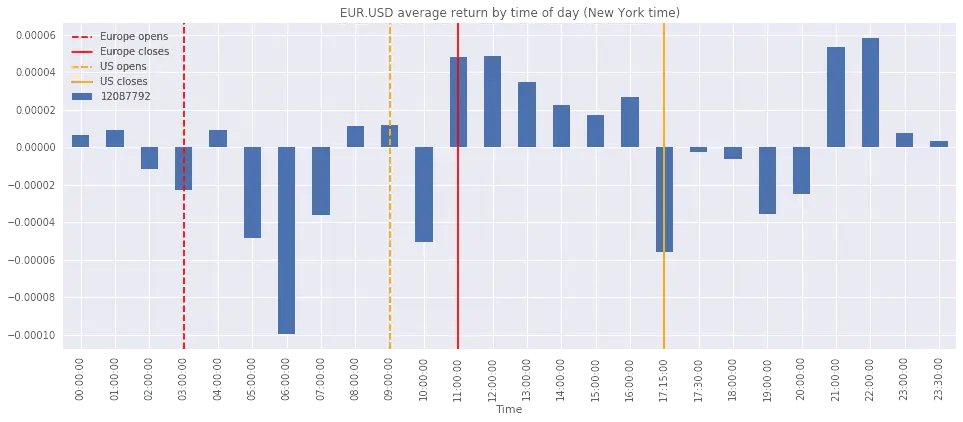
sometimes though, you'll find some things you can't immediately show are a bad idea so quickly... for example, here's some thing i trade on a monthly timescale.

if you find something like that, don't get excited though and bet the farm... the work has only just started. you just failed to show it was an obviously bad idea. now you need to think more carefully about causality. try to break things down.
and now you need to think about the fact that the market is changing underneath you and its never really totally reasonable to jam everything into the same scatterplot like this. but that's hard stuff. and you should never do the hard stuff before the easy stuff.
your job is to prove to yourself quickly that your pet idea is a bad one in the quickest way possible. you have all the time in the world to carefully analyze things that haven't disappointed you yet. beep...boop.

Or maybe, "they wake up at different times" quantrocket.com/blog/business-…

Your thread is very popular today! #TopUnroll threadreaderapp.com/thread/1925148… 🙏🏼@omegachigma for 🥇unroll

And once you figure out something that isn’t a random blob, you start looking here for actionable data, and then wen you’ve done that a lot you’ll maybe get lucky and find something that gives you data backed edges :)


The main variable missing is the time this takes, which could be an afternoon, or 5 years. Or Tesla which is now in its 10th year running (more or less).

A good place to start... SELECT feature_rank, AVG(logreturns) FROM features f INNER JOIN logreturns r ON f.lagged_datetime = r.datetime GROUP BY feature_rank


“Under VC funding crypto tokens is likely rich because founders & VCs are greedy and stupid and forced by their VC overlords to…so it’s likely to go down in the future “ Checks out

Just a comment on the plot analysis: Recently I have tested generating a random variable with an autocorrelatoon(1) of 0.05 Backtesting a signal based on t-1 has a pretty good sharpe on a resonable sample size - even though the scatterplot doesnt show a clear relationship


United States 趨勢
- 1. Good Sunday 59.8K posts
- 2. Troy Franklin N/A
- 3. Brownlee N/A
- 4. #sundayvibes 5,558 posts
- 5. #JetUp N/A
- 6. #AskFFT N/A
- 7. Jermaine Johnson N/A
- 8. Lutz 1,382 posts
- 9. #AskBetr N/A
- 10. Rich Eisen N/A
- 11. Nick Folk N/A
- 12. #DENvsNYJ 1,093 posts
- 13. Muhammad Qasim 21.3K posts
- 14. Pat Bryant N/A
- 15. Mason Taylor N/A
- 16. Miary Zo 2,244 posts
- 17. KenPom N/A
- 18. Discussing Web3 N/A
- 19. Wordle 1,576 X N/A
- 20. Bourne 1,549 posts
Something went wrong.
Something went wrong.