
mark Edgar
@tryhay
Swing trader / investor, follower of Stan Weinstein's approach.
You might like


Looks like ‘ABC’ on LHS chart, where as BHP is extended FWIW


I have a special gann screener that can make you a profitable trader , if you will follow it with full discipline. Just retweet and follow me to get everything in DM for free. Also comment " #WDGann " only in the comment section. #StockMarket #Gann
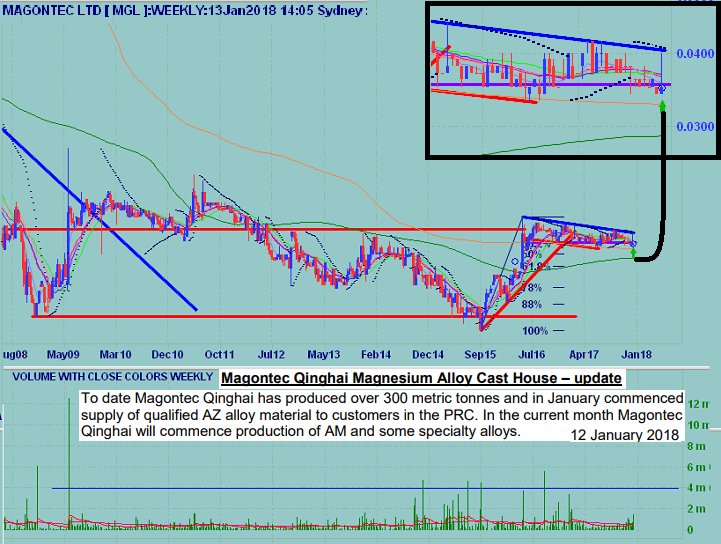
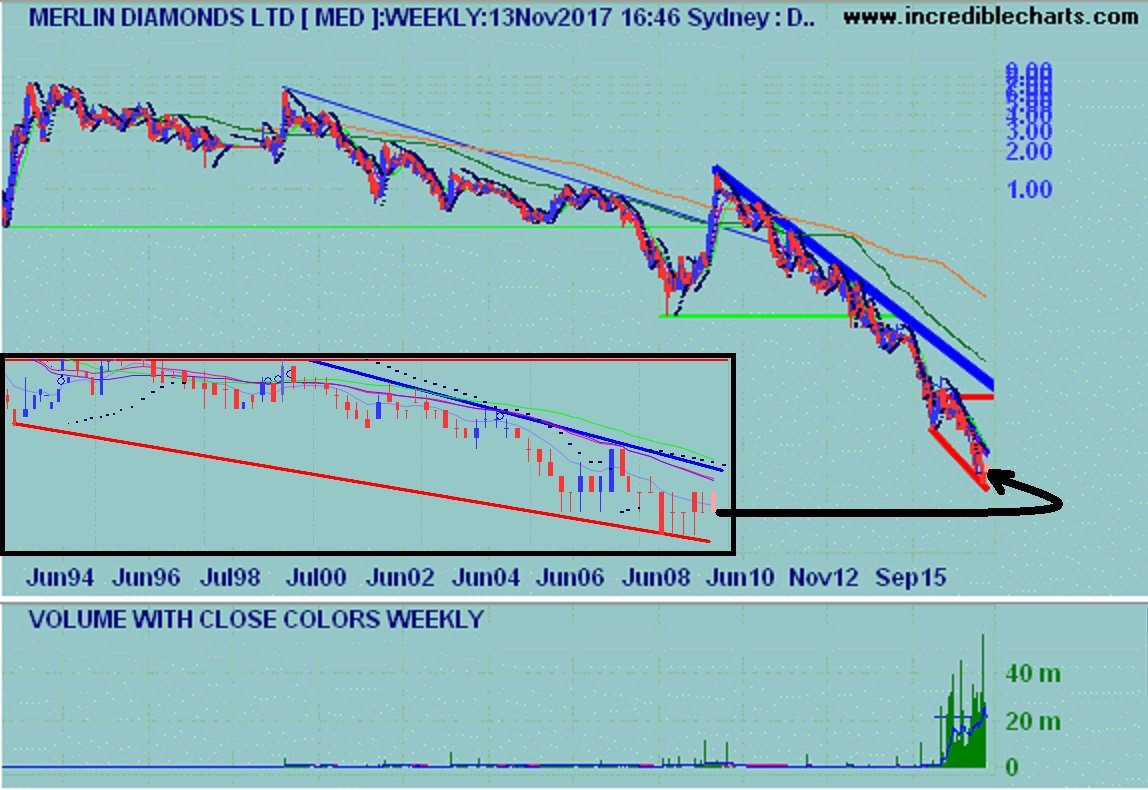
$MGL has been consolidating after its downtrend (which commenced in 1993) for so long that any mission critical fundamental news is likely to be well received by the market IMO Weekly chart: shows >10 yrs of consolidation; may well be ready to test resistance again with news.
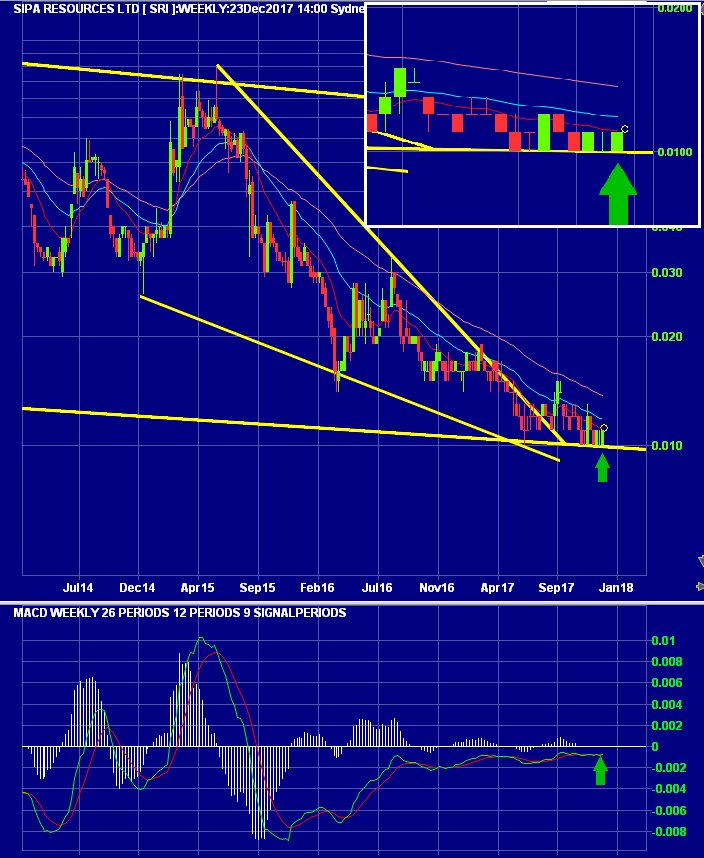
$SRI's share price is still sliding sideways, it is too early to top up; looking for price action to bounce off support. Weekly chart: most indicators are positive IMO
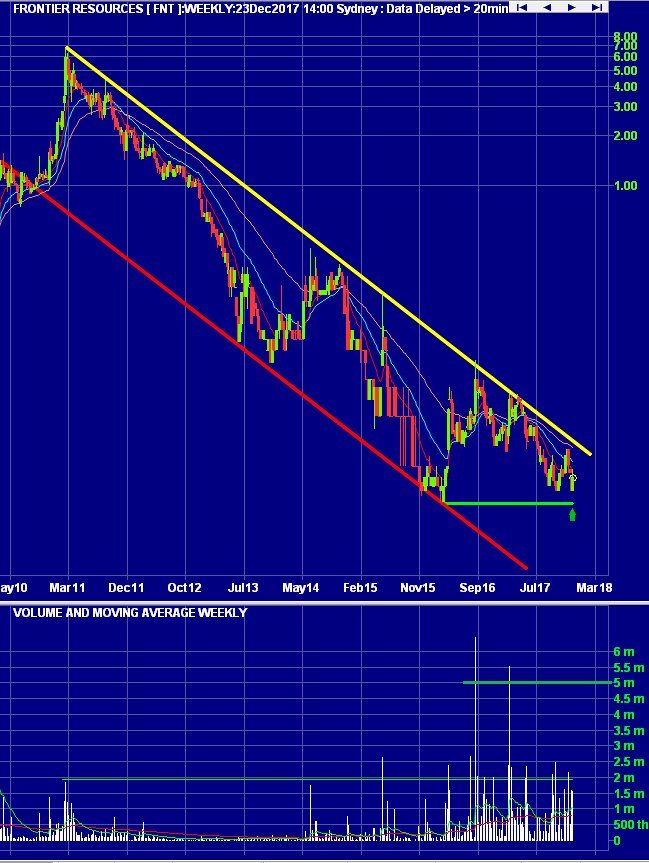
$FNT is a potential double bottom (at the all time low); if it respects say 1.1 cent then looks worth first tranche. Weekly chart: bit of accumulation around here...
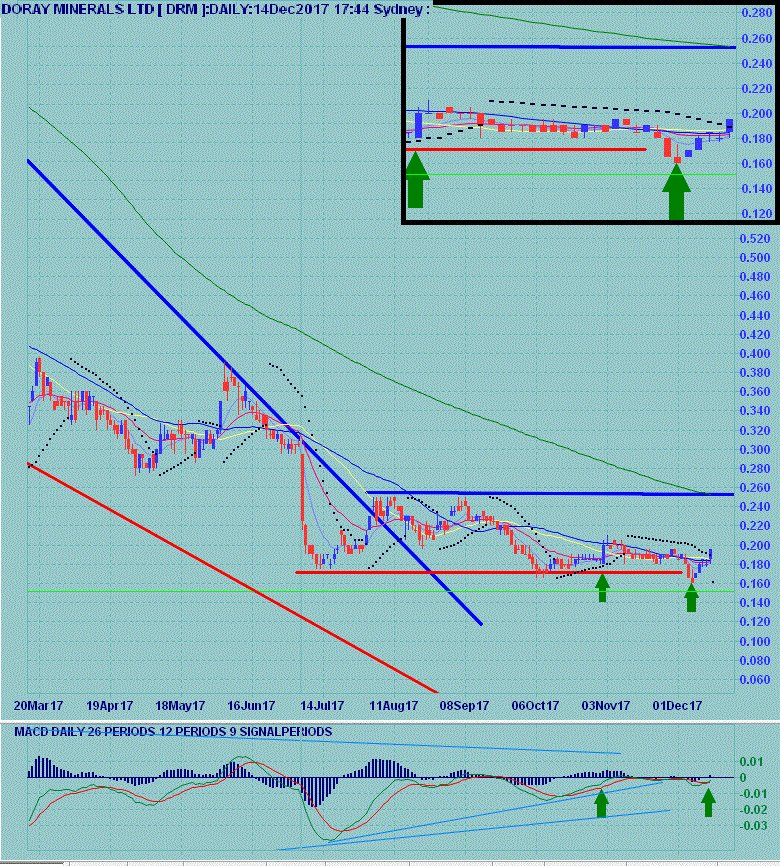
Looks like top up time on $DRM; would not be surprised if it tripped back to resistance. Daily chart: on a PSAR buy signal, most indicators looking good, on increasing volume.
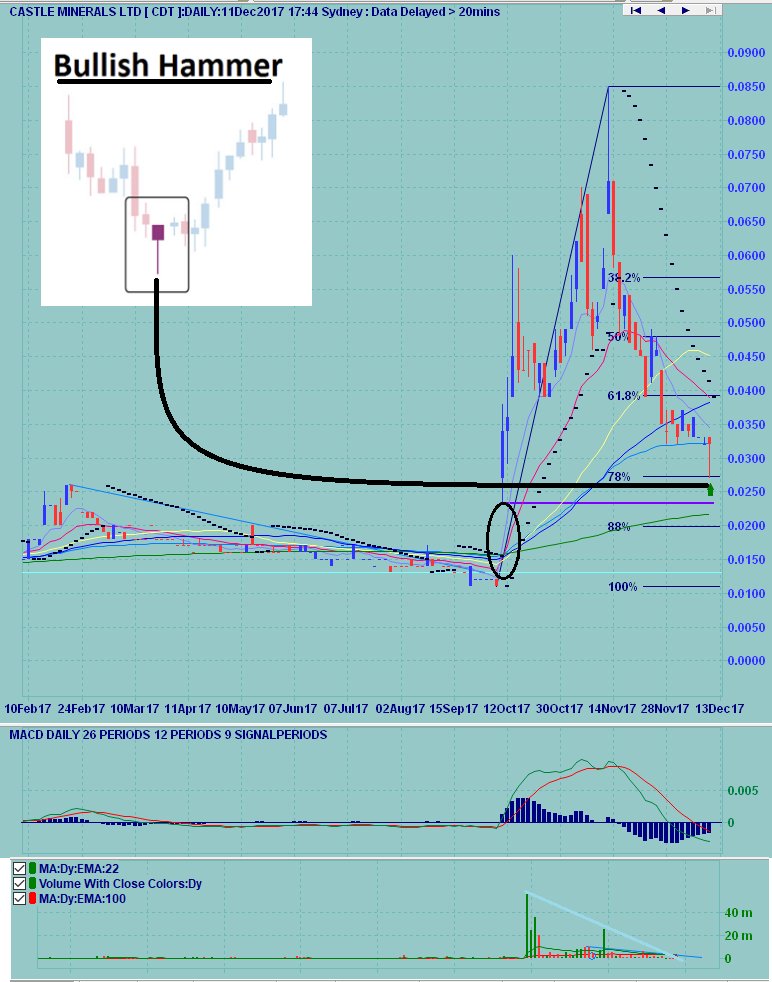
$CDT's retrace looks just about done: Hammer candlestick on the 78% Fib retracement just above potential gap support... Daily chart for any interested.
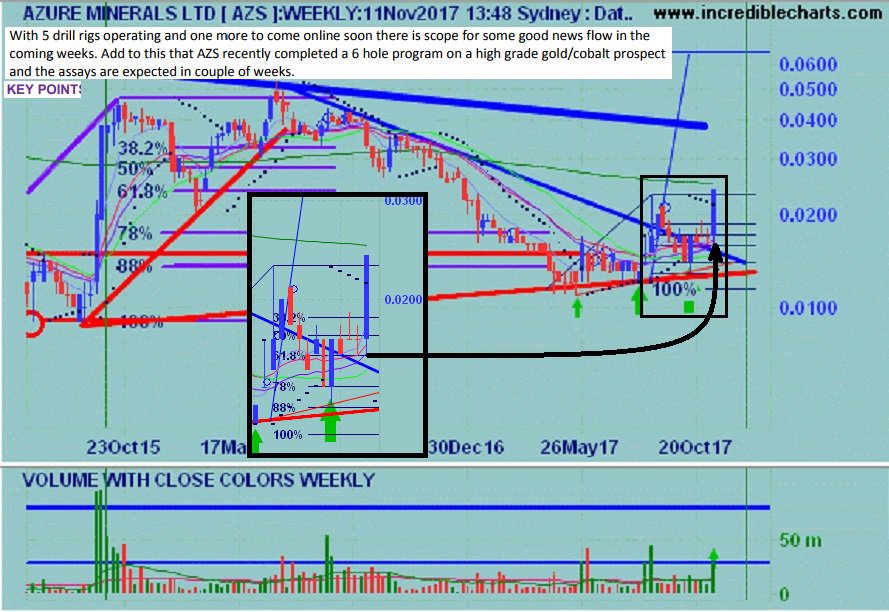
$AZS announcement: " Spectacular 6.6% Cobalt and 66g/t Gold Drilled at Sara Alici" Looks like breakaway gap today after consolidation & announcement!
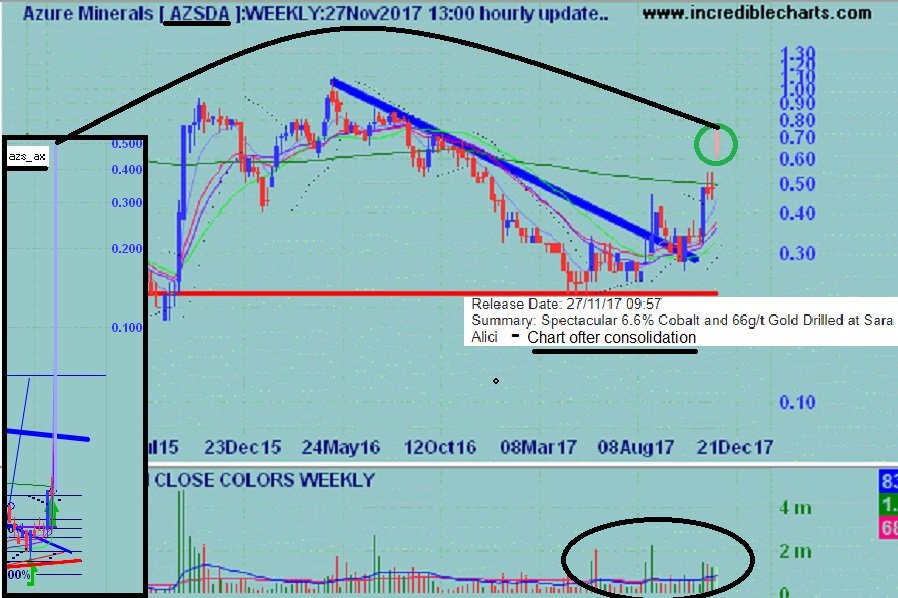
Looks like the 200_DMA has been done - may well be a strong swing higher from here... Weekly chart: can not complain about several indicators
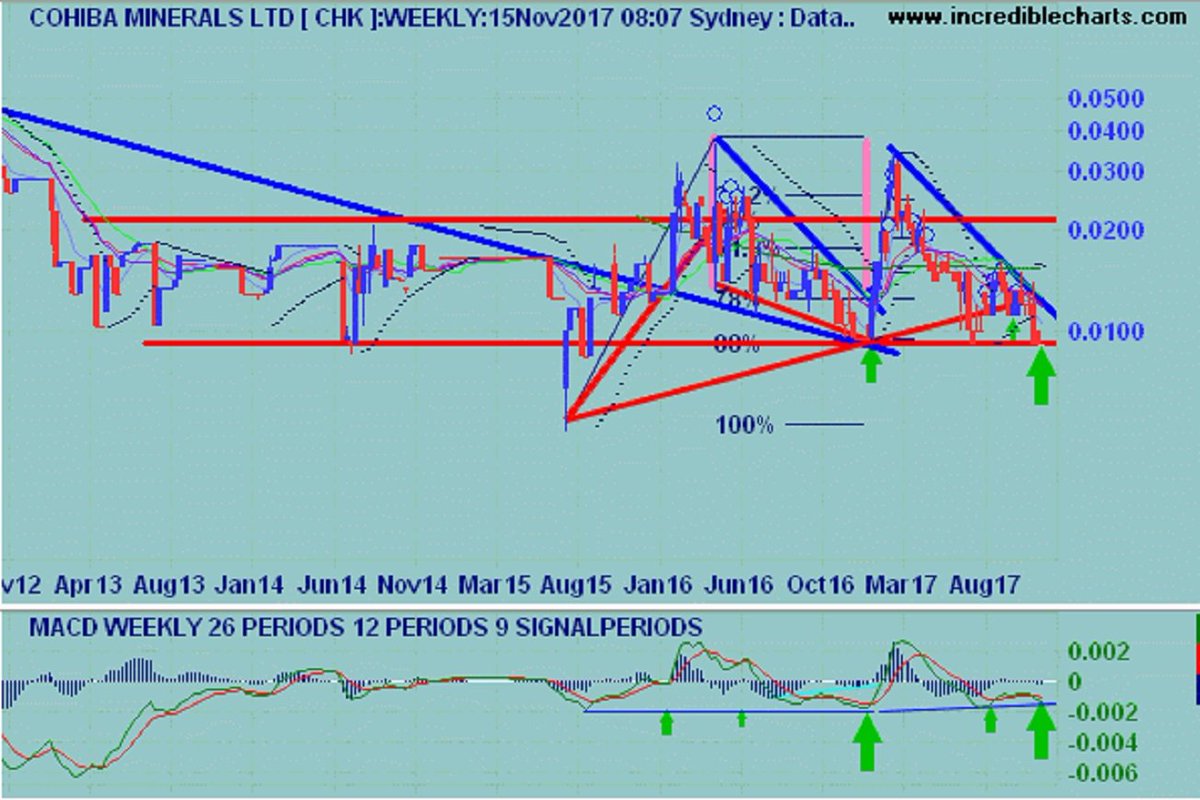
$CHK has formed an interesting pattern, which if it plays out may well see price action retest the recent highs Weekly chart:
$MED is at all time low with pattern complete (downtrend since 1993), not far off production with specialists/new plant employed. Gutnick & co are here for $$ - I think this is a steal! Weekly chart: Several attributes are attractive IMO...
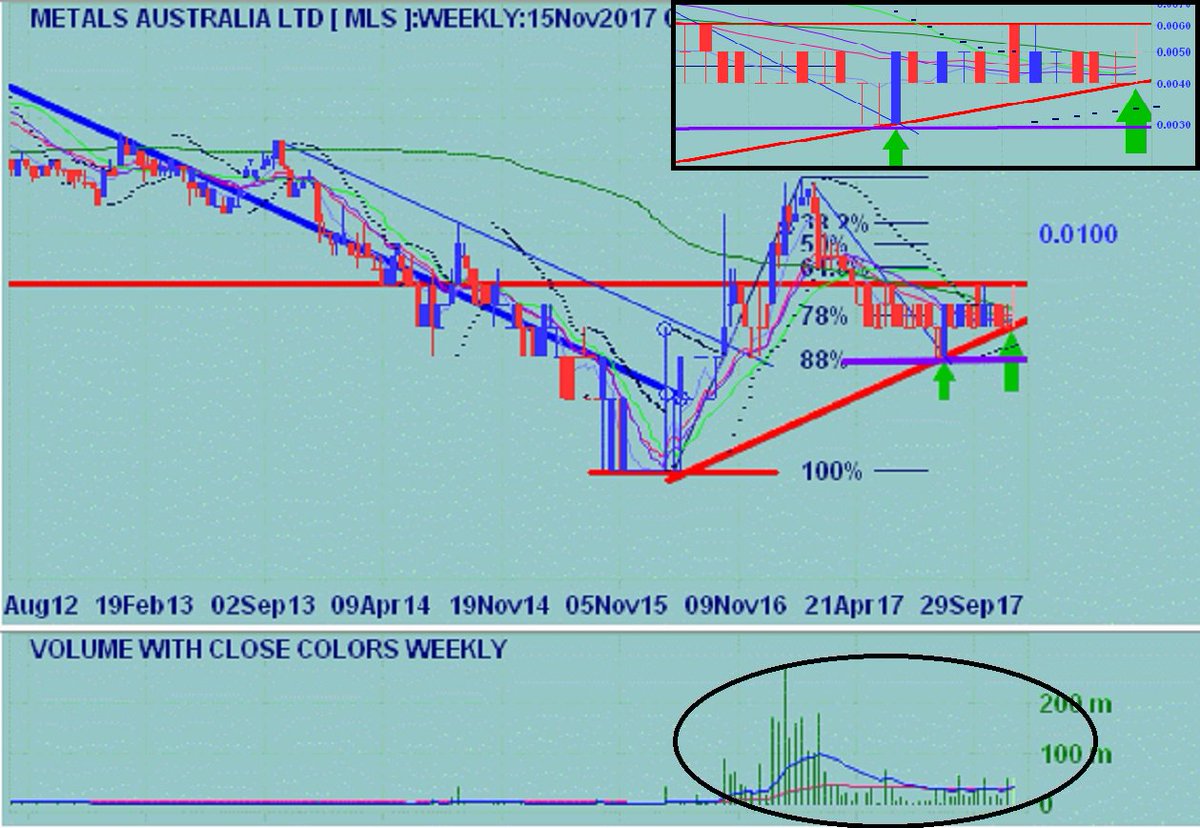
$MLS looks to have made a higher low (from the recent all time low - with reasonable accumulation volume) and may well be ready to retest the recent highs Weekly chart: Looks OK to me...
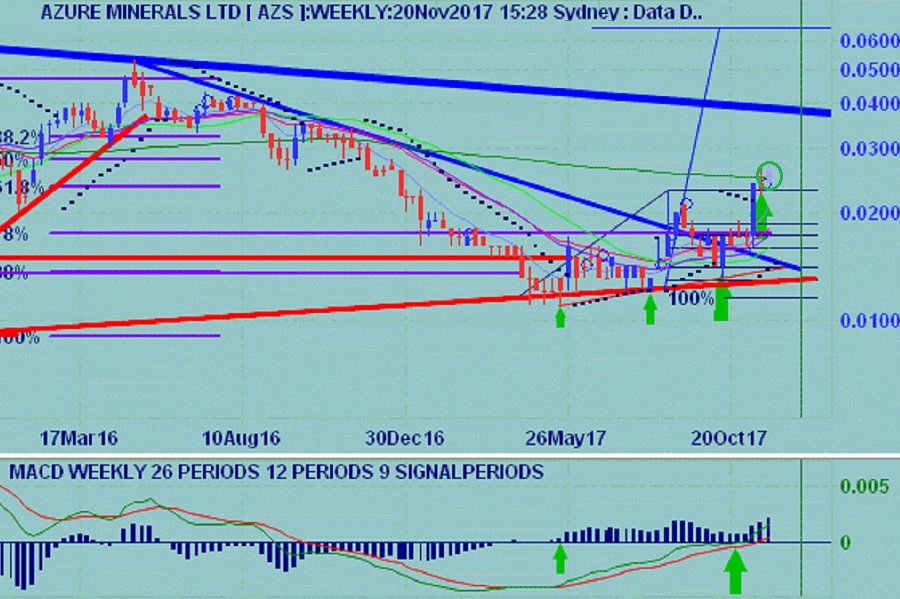
$AZS Chart & Fundamentals suggest that resistance will be sorely tested as drilling results are shortly received IMO.
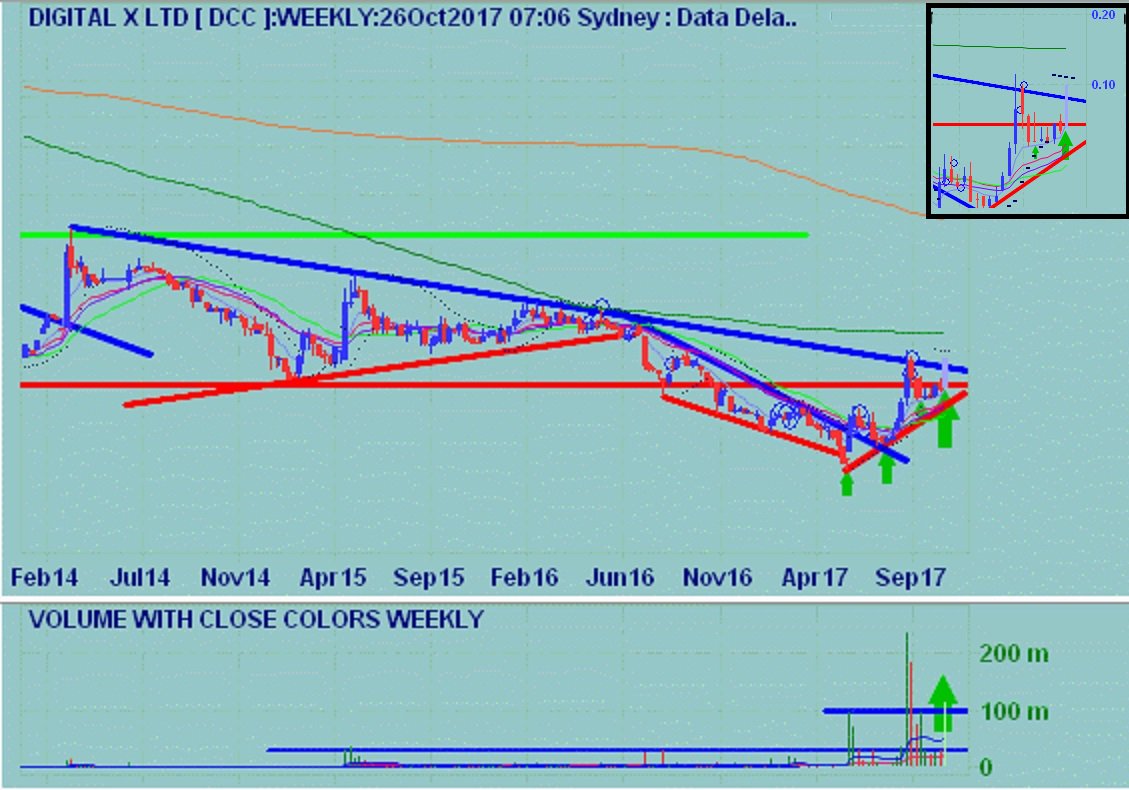
Looks like $DCC's break of recent downtrend Weekly chart: Looks neat
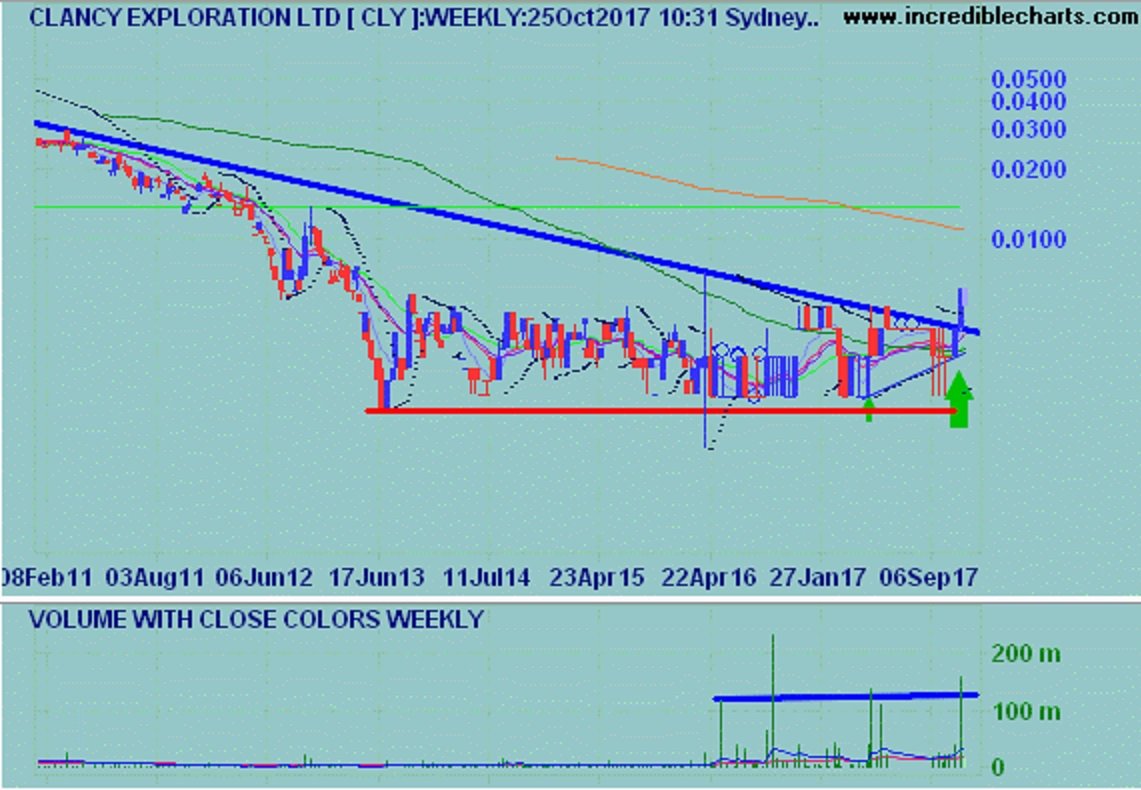
CLY has broken out of downtrend on accumulation volume! Weekly chart: Indicators looking positive here...

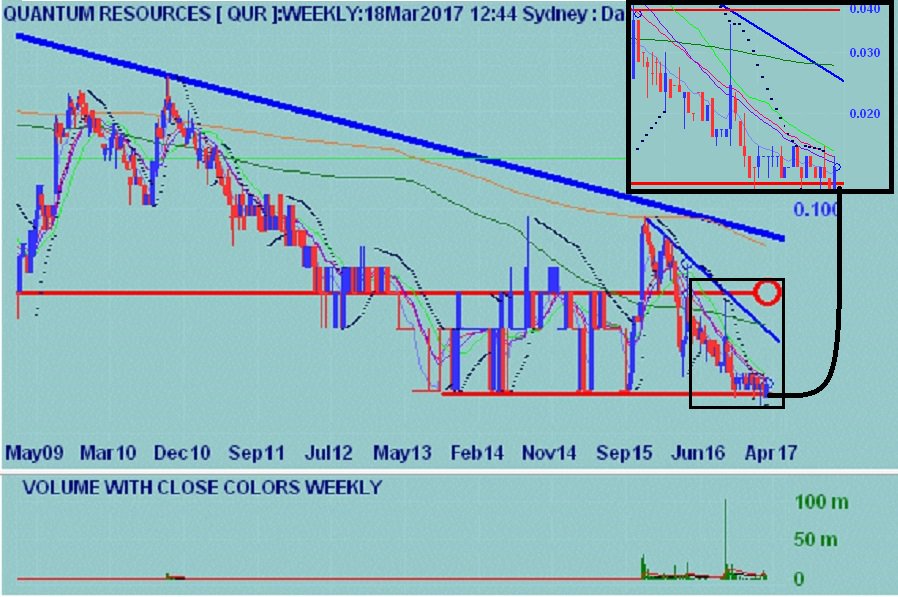
$QUR has been in downtrend since '95, been sliding sideways since '09 (made ATL in Feb '17), expecting it to pop to resistance, say 4 C
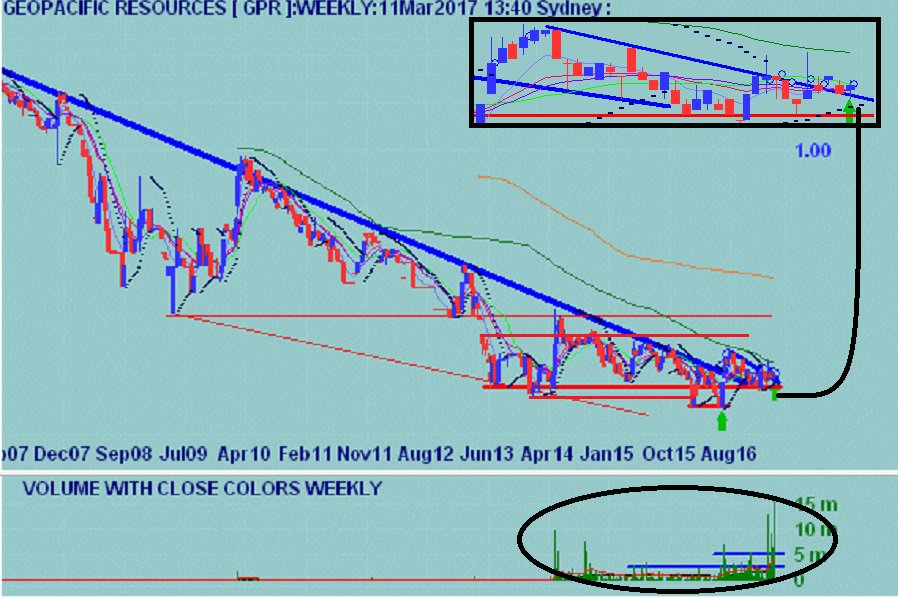
🏄♂️ Can not think of any reason not to buy $GPR on Monday. Weekly chart looks set for POP IMO


United States Trends
- 1. Valentines Day N/A
- 2. Good Saturday N/A
- 3. #RISERCONCERTD2 N/A
- 4. Lucas Raymond N/A
- 5. #ElAmorLoVenceTodo N/A
- 6. JASPER 2ND RISENSHINE N/A
- 7. #SaturdayVibes N/A
- 8. Range Rover N/A
- 9. #SaturdayMotivation N/A
- 10. Bayes N/A
- 11. #いきづらい部1st_Day1 N/A
- 12. Solar N/A
- 13. Senior Day N/A
- 14. Happy Love N/A
- 15. Reid Hoffman N/A
- 16. MATCH DAY N/A
- 17. MEET DAY N/A
- 18. Restore Britain N/A
- 19. Tory N/A
- 20. Zona 7 N/A


Something went wrong.
Something went wrong.