
Visual Capitalist
@VisualCap
Data-driven visual content focused on global trends, investing, technology, and the economy. 📲 Creator on @VoronoiApp
Was dir gefallen könnte


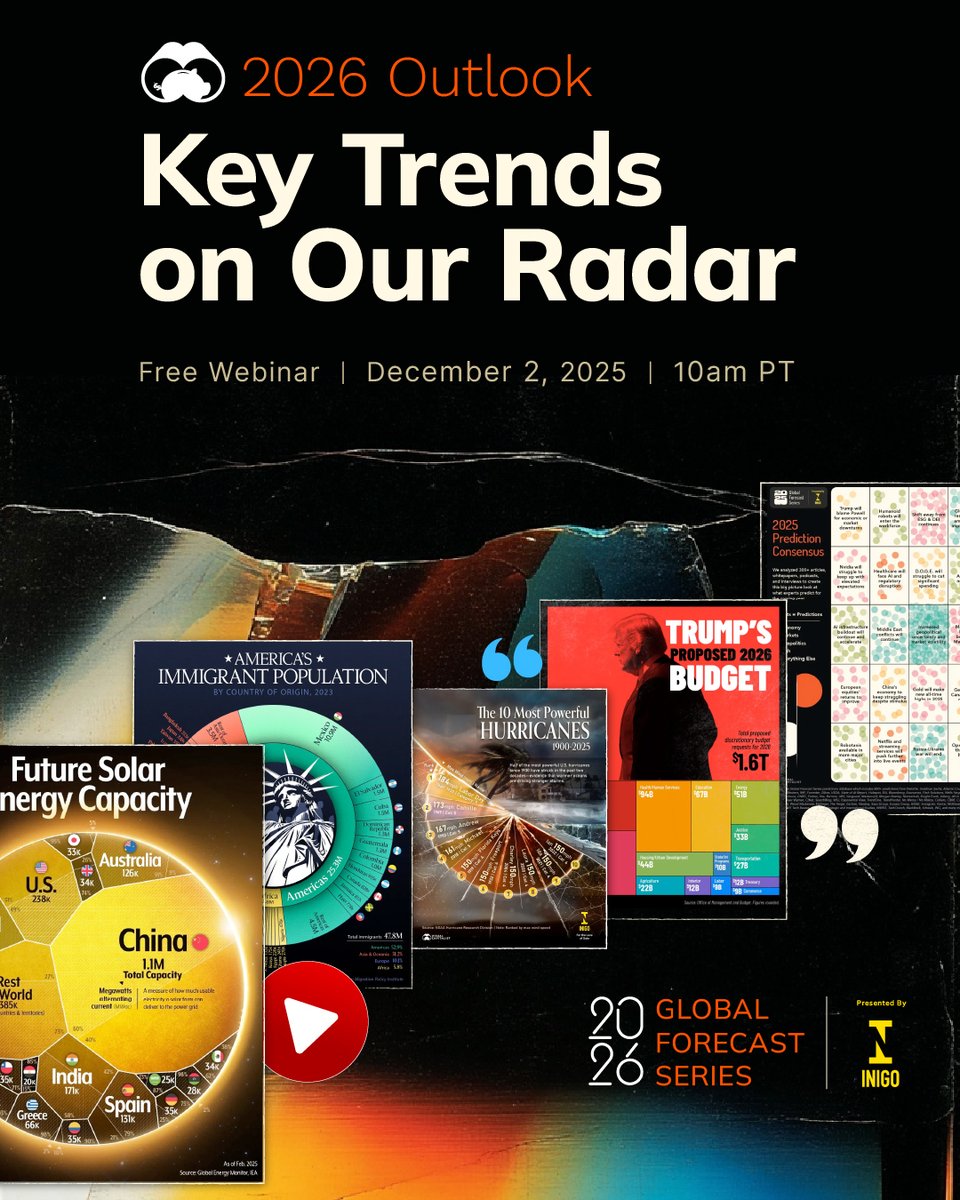
What did world’s experts got right (and wrong) in 2025? And what will be the key global trends to watch in 2026? 🔮 Join us as we kick off the 2026 Global Forecast Series presented by @Inigo_Insurance with an early look at the forces shaping the year ahead. 🗓️ December 2, 2025…
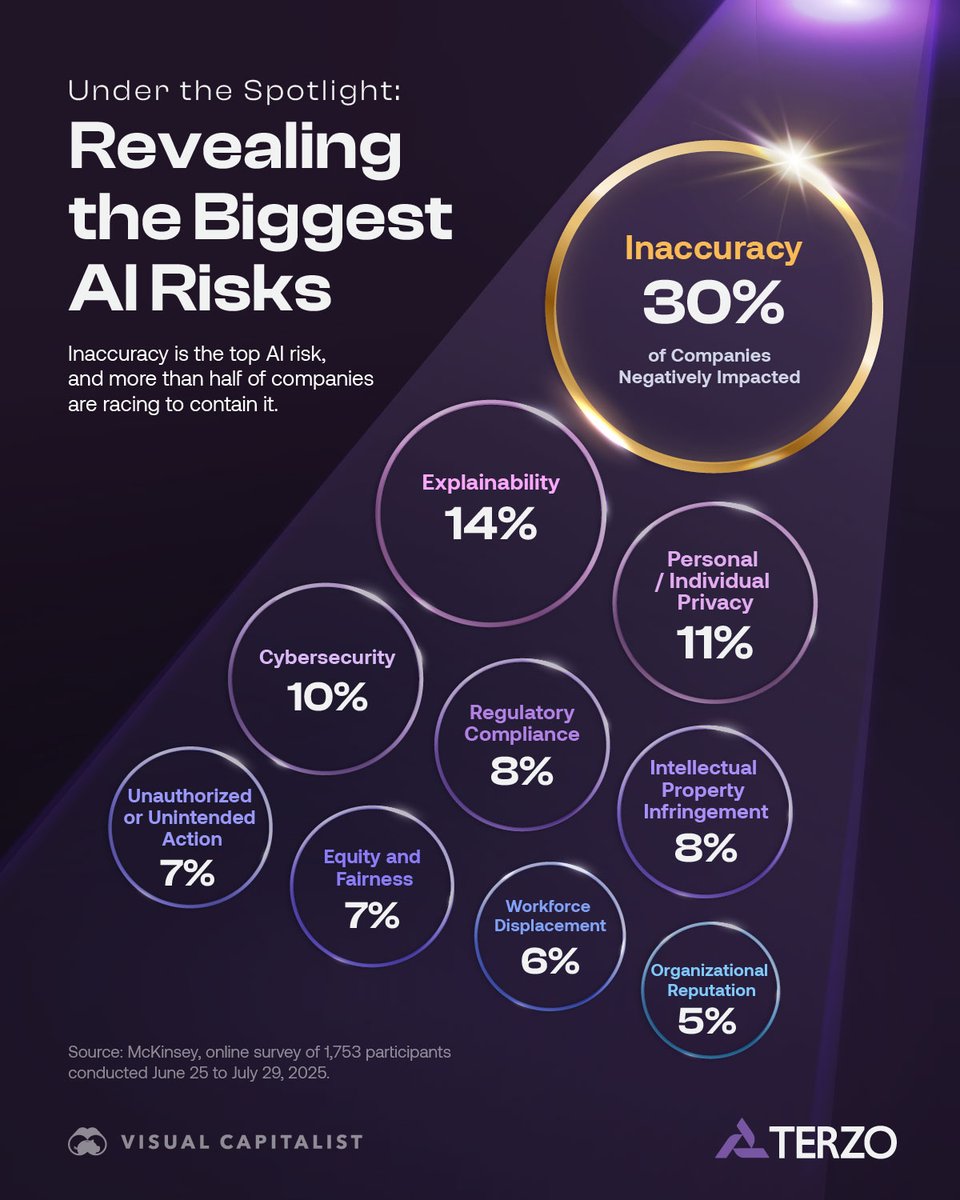
Nearly a third of companies have been negatively impacted by AI inaccuracy at least once ⚠️ This infographic breaks down the most common risks. It’s a preview of the brand-new executive guide done in partnership with @TerzoHQ, AI’s Illusion of Truth: The Data Behind AI Errors.…
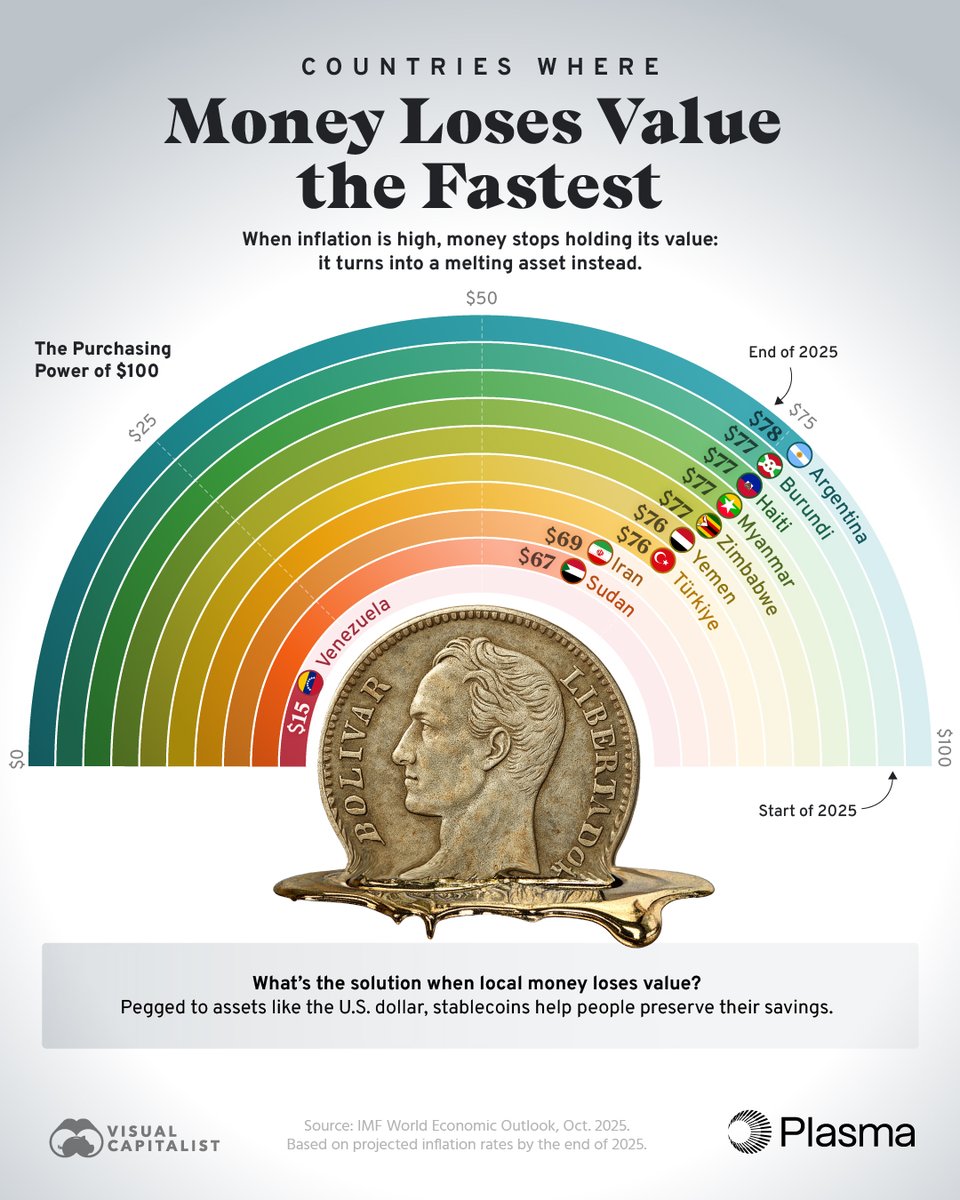
When prices rise, money's value melts away. See how inflation could shrink the value of $100 by the end of 2025 in the hardest-hit countries 📉 This graphic, created in partnership with @Plasma, highlights countries with the highest inflation rates and what $100 could be worth…
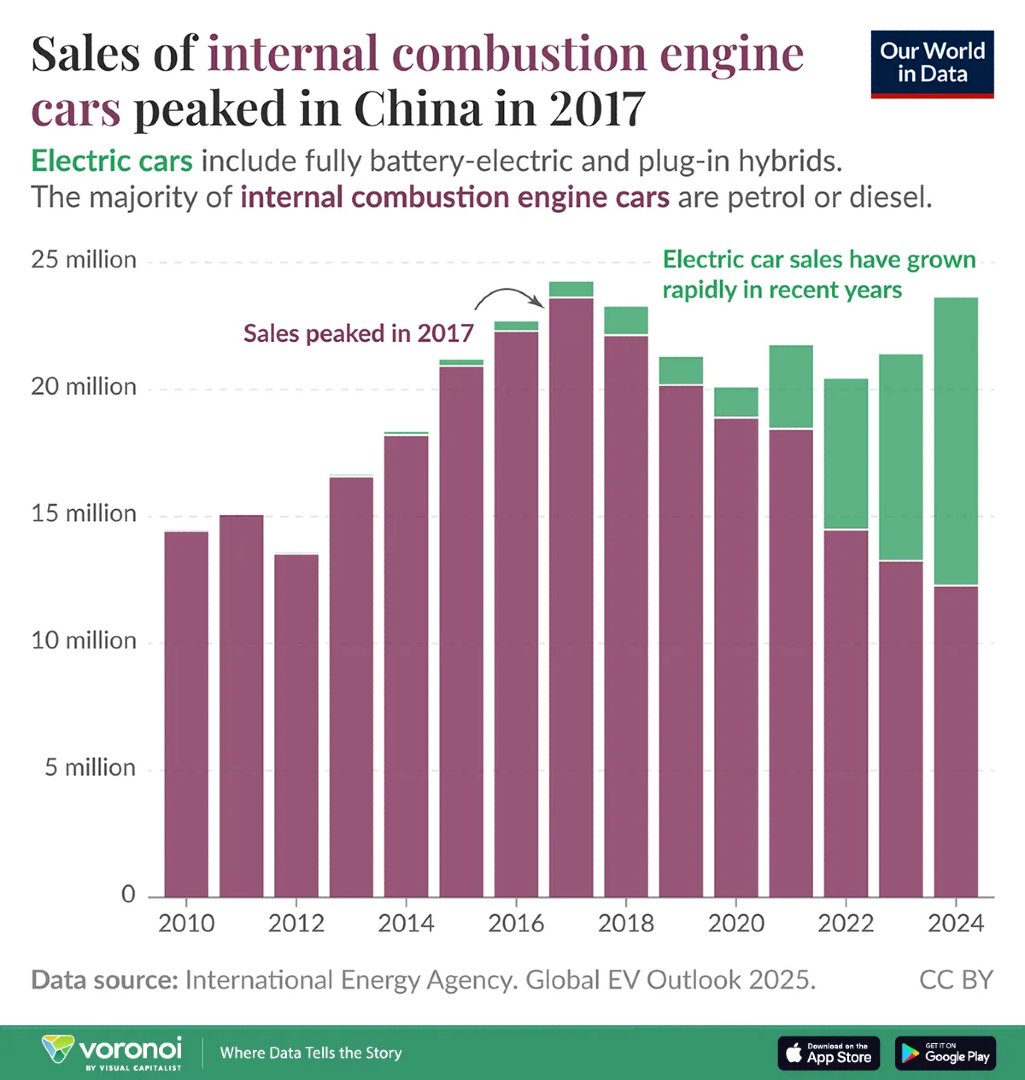
China’s EV Explosion, in One Chart (2010-2024) 🚗 This graphic by @OurWorldInData is one of the many incredible data-driven charts and stories from creators featured on our @VoronoiApp. ✅ voronoiapp.com/automotive/Chi…
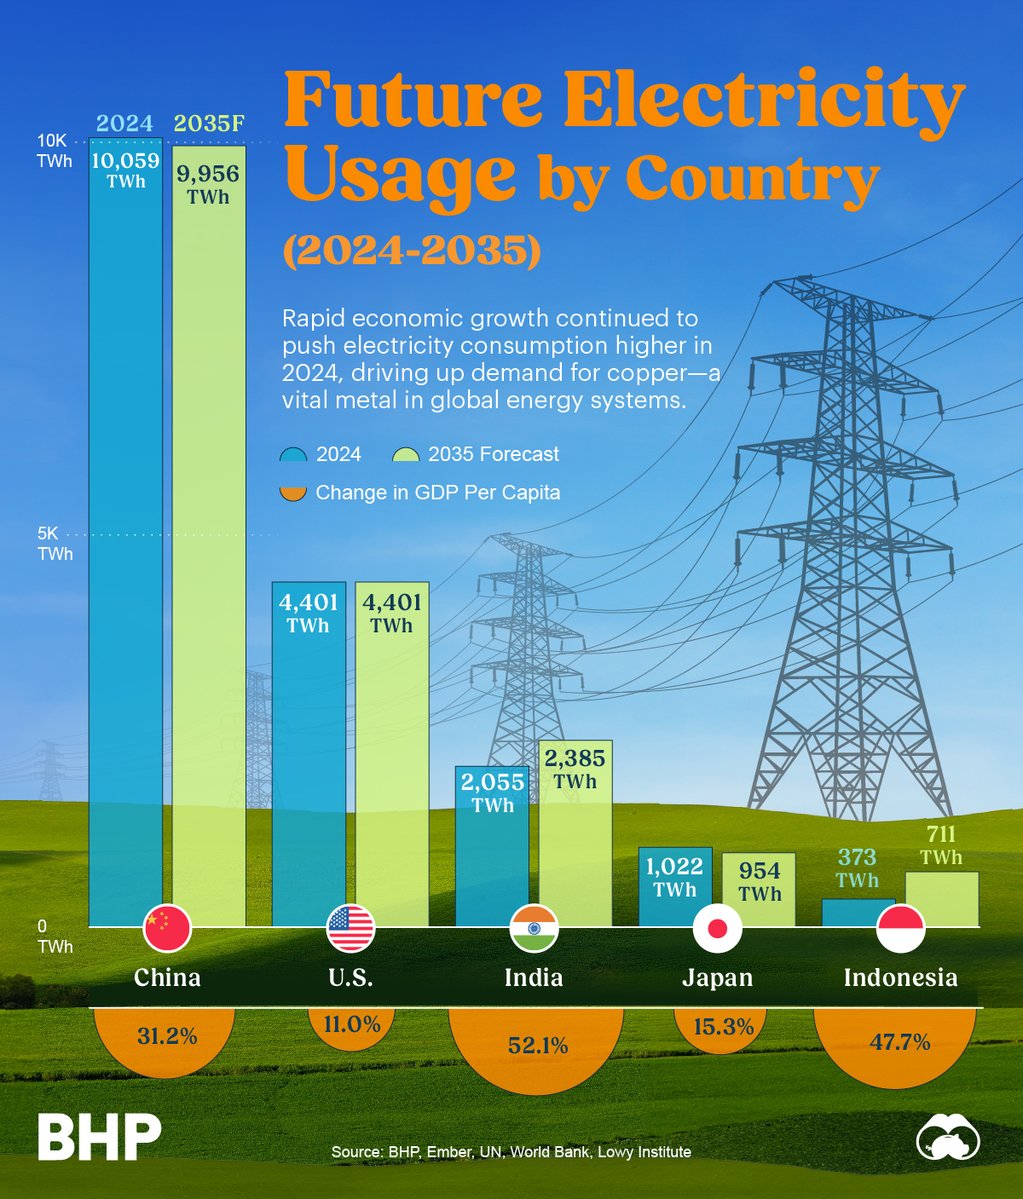
Projected electricity usage growth and economic development are driving global copper demand—see how energy use is rising from 2024 to 2035 ⚡ Here, we've partnered with @bhp to visualize the projected growth in electricity consumption and GDP per capita across five major…
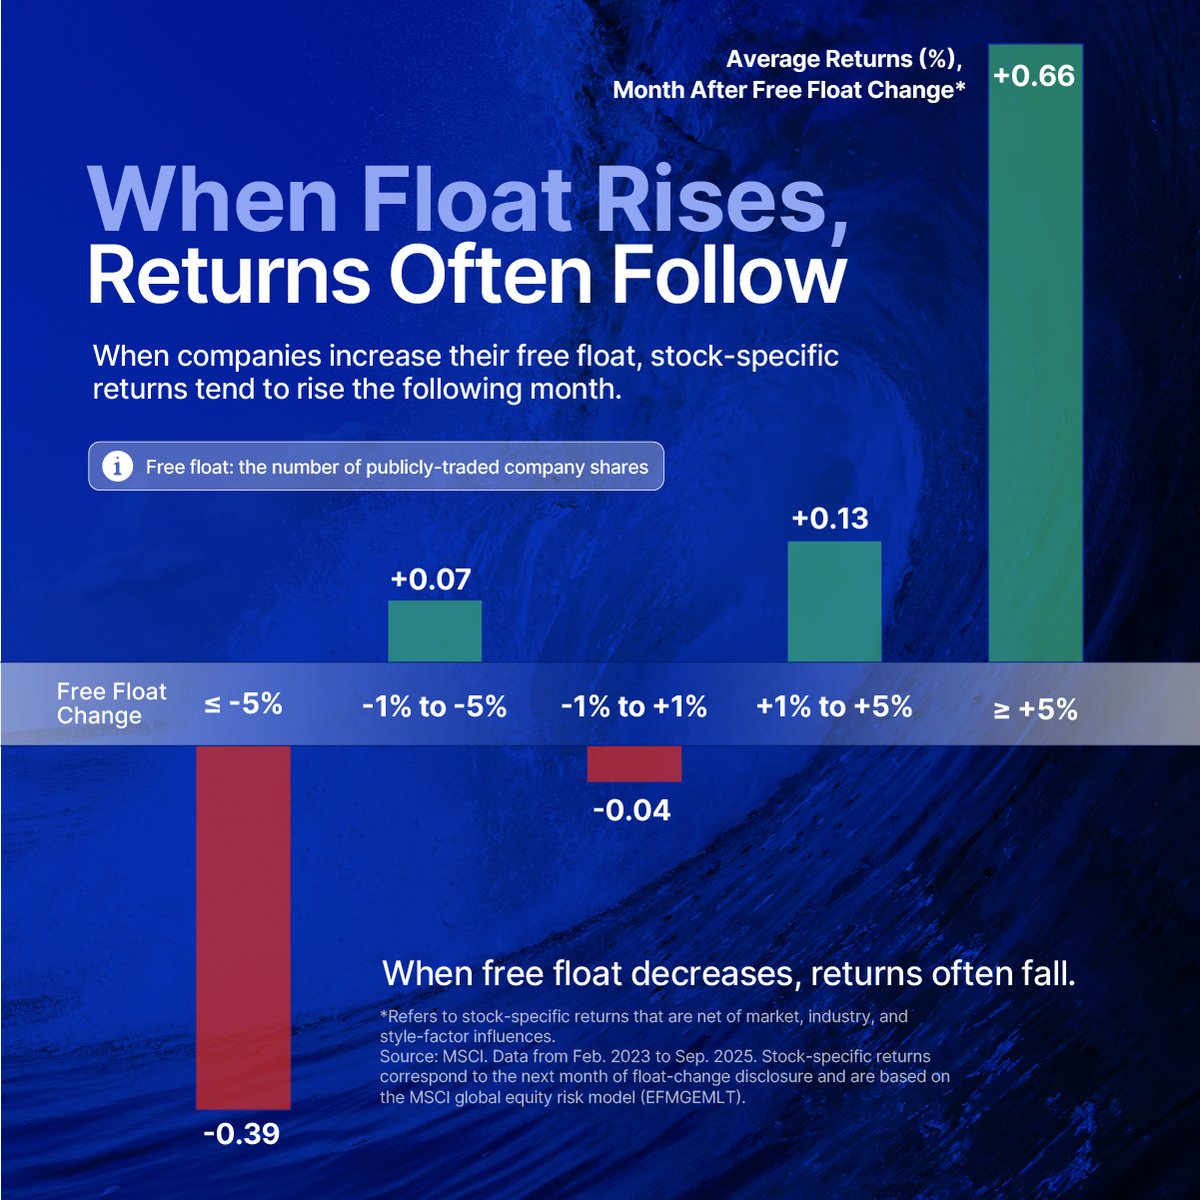
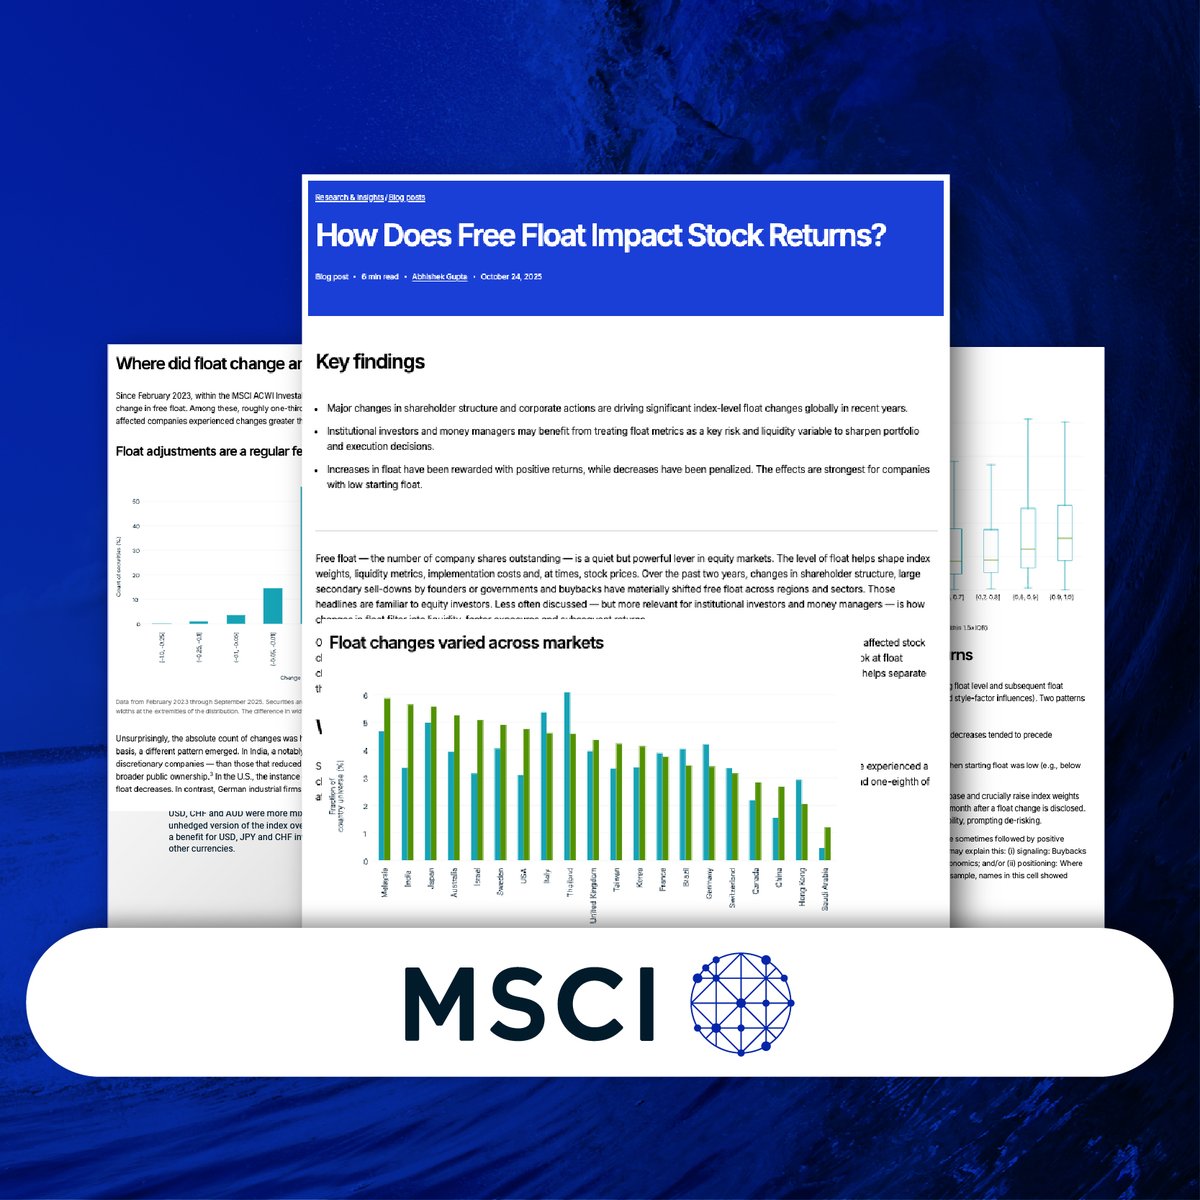
After an increase in free float, which is the number of publicly-traded company shares, stock prices tend to rise the next month 📈 This graphic, in partnership with @MSCI_Inc, shows how changes in free float have historically impacted the next month’s returns.…
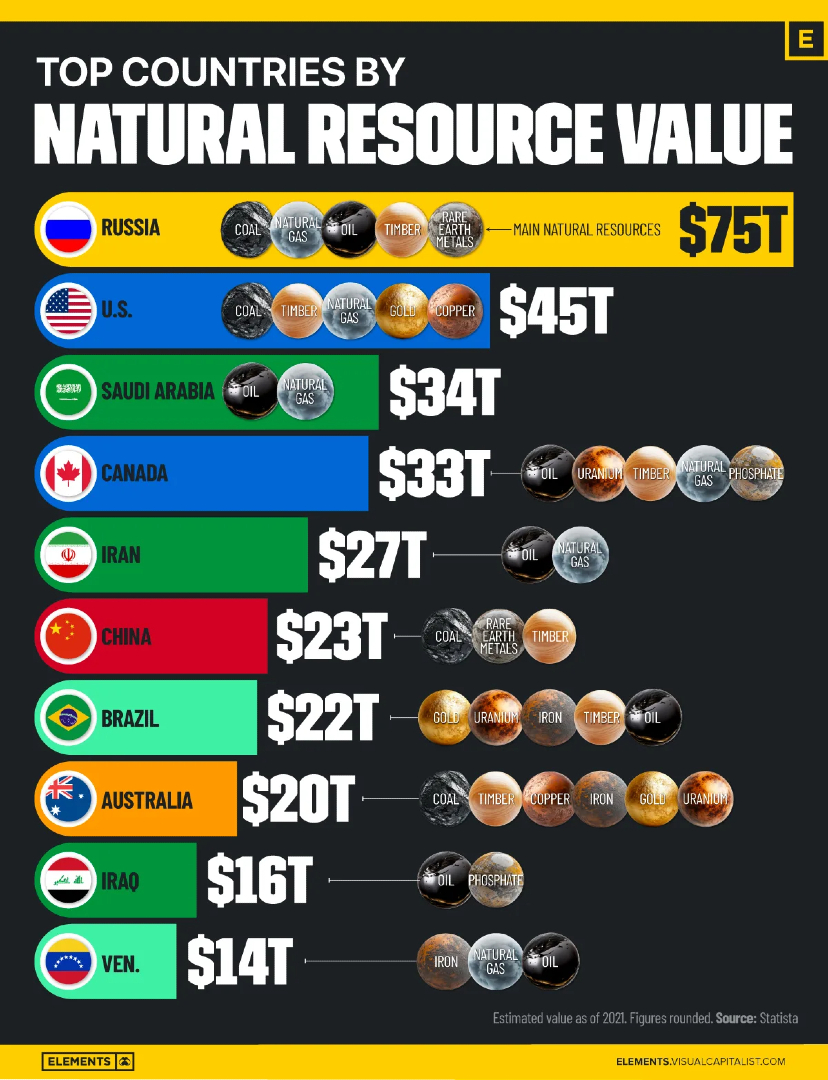
Flashback Favorite 🔙 Ranked: Top 10 Countries by Value of All Their Natural Resources ⛏️ From the Archive: visualcapitalist.com/ranked-top-10-…
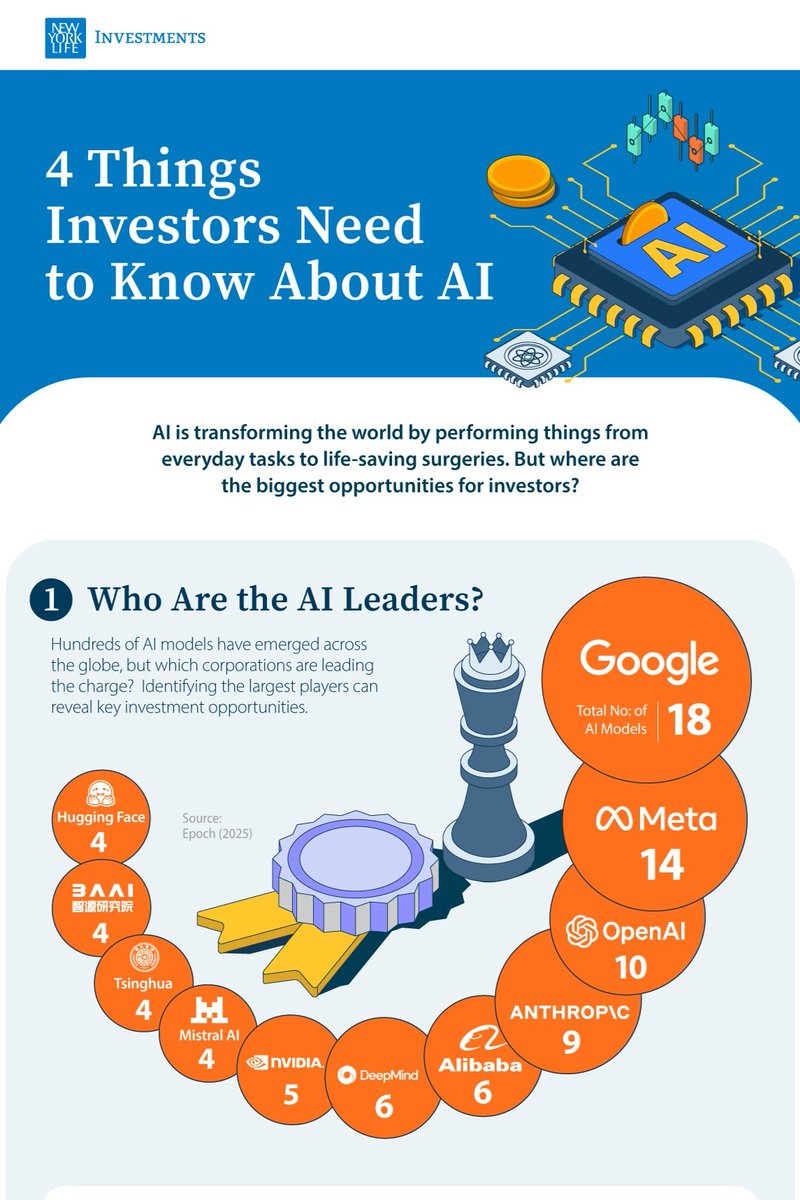
As AI adoption accelerates, investors are all asking the same question: where are the biggest opportunities? 🤖 Here, we've partnered with @NYLInvestments, to explore four key things investors need to know about AI and how to invest around it. See the full infographic:…
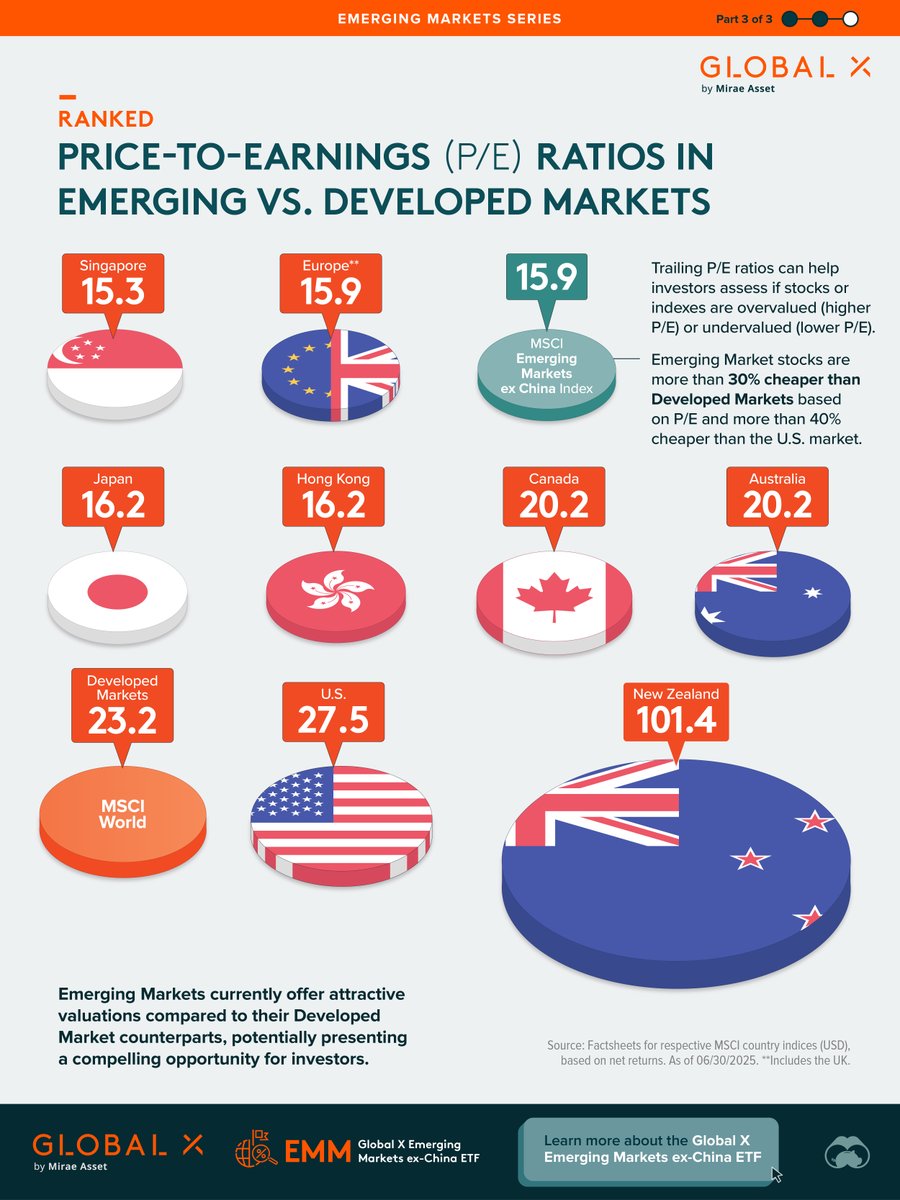
Emerging markets P/E ratios trade at a 30%+ discount to developed peers. Which countries are most undervalued today? 🪙 In this graphic, we've partnered with @GlobalXETFs to explore the P/E ratios of Emerging and Developed Markets. visualcapitalist.com/sp/gx03-ranked… #gx03
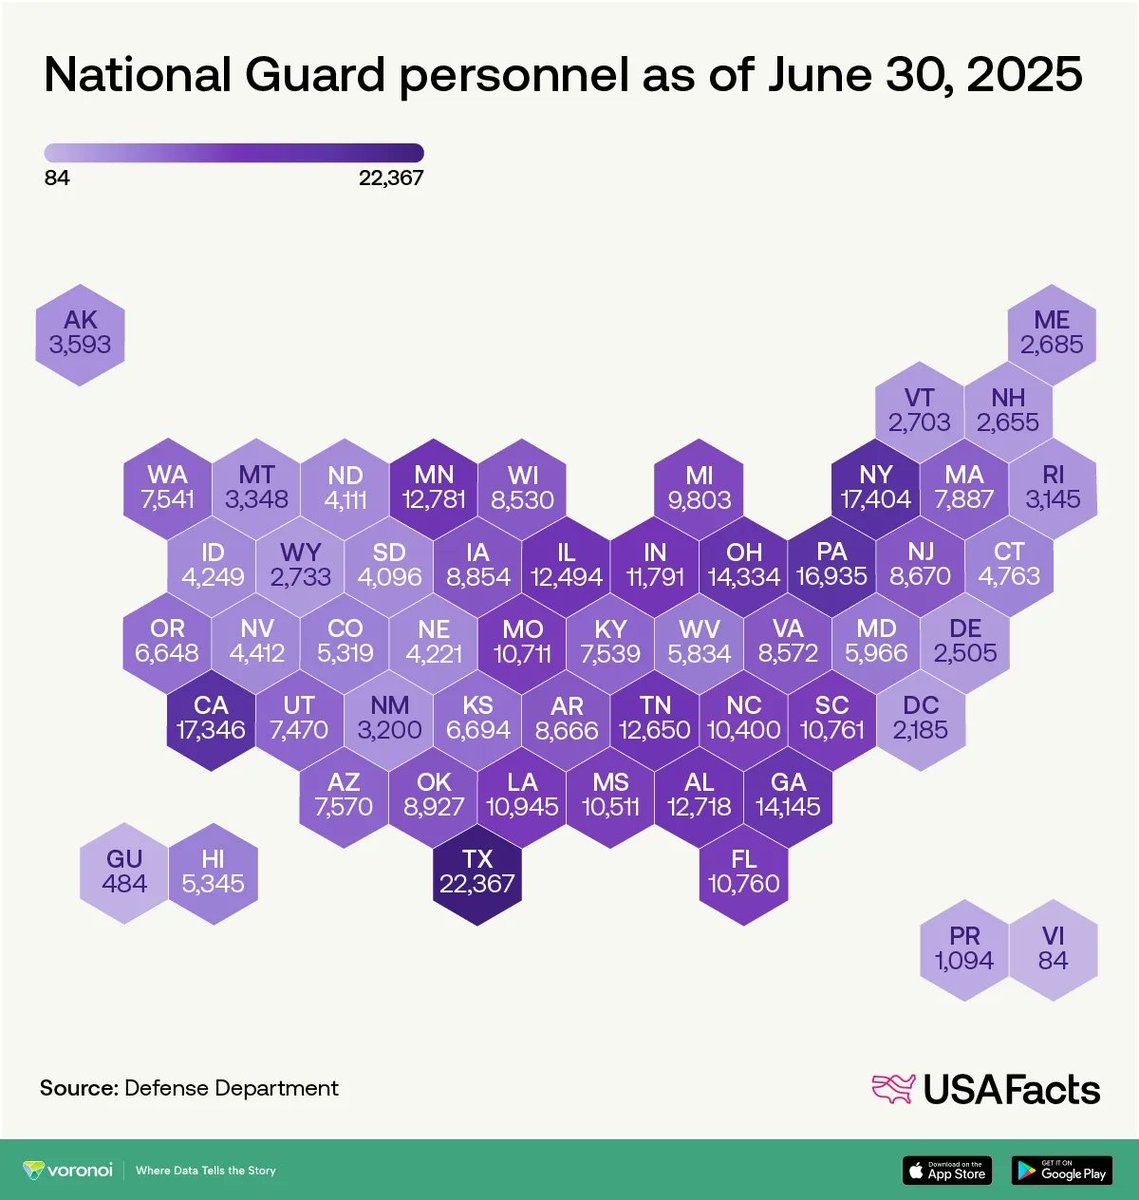
Mapped: America’s National Guard Personnel by State This graphic by @USAFacts is one of the many incredible data-driven charts and stories from creators featured on our @VoronoiApp. ✅ voronoiapp.com/military/How-m…


United States Trends
- 1. #StrangerThings5 42.7K posts
- 2. Afghan 102K posts
- 3. National Guard 410K posts
- 4. Thanksgiving 529K posts
- 5. #AEWDynamite 7,594 posts
- 6. Rahmanullah Lakanwal 39.2K posts
- 7. Cease 25.2K posts
- 8. Celtics 12.5K posts
- 9. Cade 32.6K posts
- 10. Okada 7,305 posts
- 11. Derrick White 1,927 posts
- 12. Blue Jays 10.6K posts
- 13. Blood 225K posts
- 14. Operation Allies Welcome 11.8K posts
- 15. Tony Brothers N/A
- 16. #triplegobble N/A
- 17. #AEWContinentalClassic 1,234 posts
- 18. Fletcher 16.6K posts
- 19. Josh Hart N/A
- 20. Al Sharpton 7,675 posts
Was dir gefallen könnte
-
 World of Statistics
@stats_feed -
 Naval
Naval
@naval -
 Elements
@VCElements -
 Prof. Feynman
@ProfFeynman -
 Compounding Quality
@QCompounding -
 Ray Dalio
@RayDalio -
 James Clear
@JamesClear -
 Howard Marks
@HowardMarksBook -
 Yardeni Research
@yardeni -
 Our World in Data
@OurWorldInData -
 (((The Daily Shot)))
@SoberLook -
 Steve Hanke
@steve_hanke -
 Long Equity
@long_equity -
 Statista
@StatistaCharts
Something went wrong.
Something went wrong.