
Visual Capitalist
@VisualCap
Data-driven visual content focused on global trends, investing, technology, and the economy. 📲 Creator on @VoronoiApp
You might like


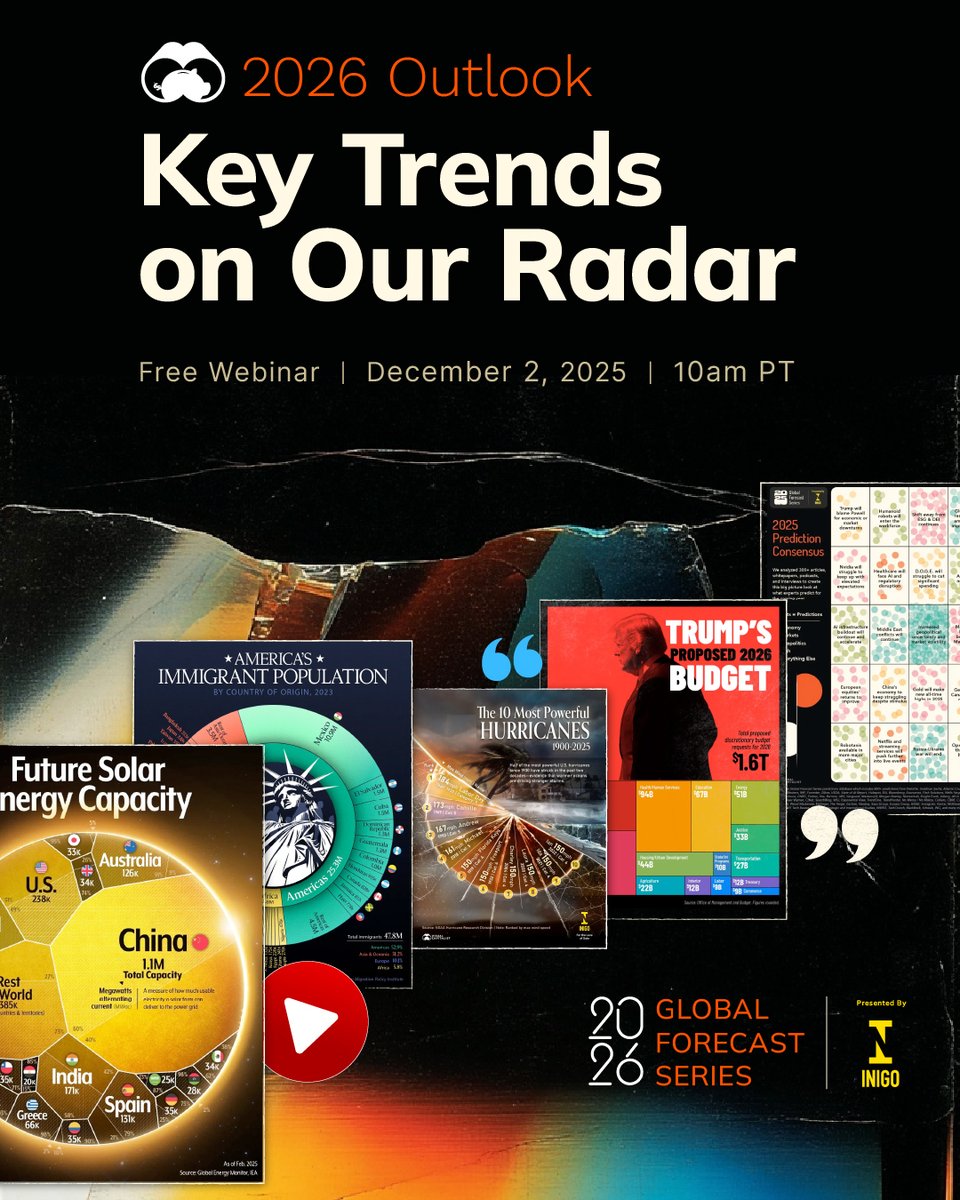
What did world’s experts got right (and wrong) in 2025? And what will be the key global trends to watch in 2026? 🔮 Join us as we kick off the 2026 Global Forecast Series presented by @Inigo_Insurance with an early look at the forces shaping the year ahead. 🗓️ December 2, 2025…
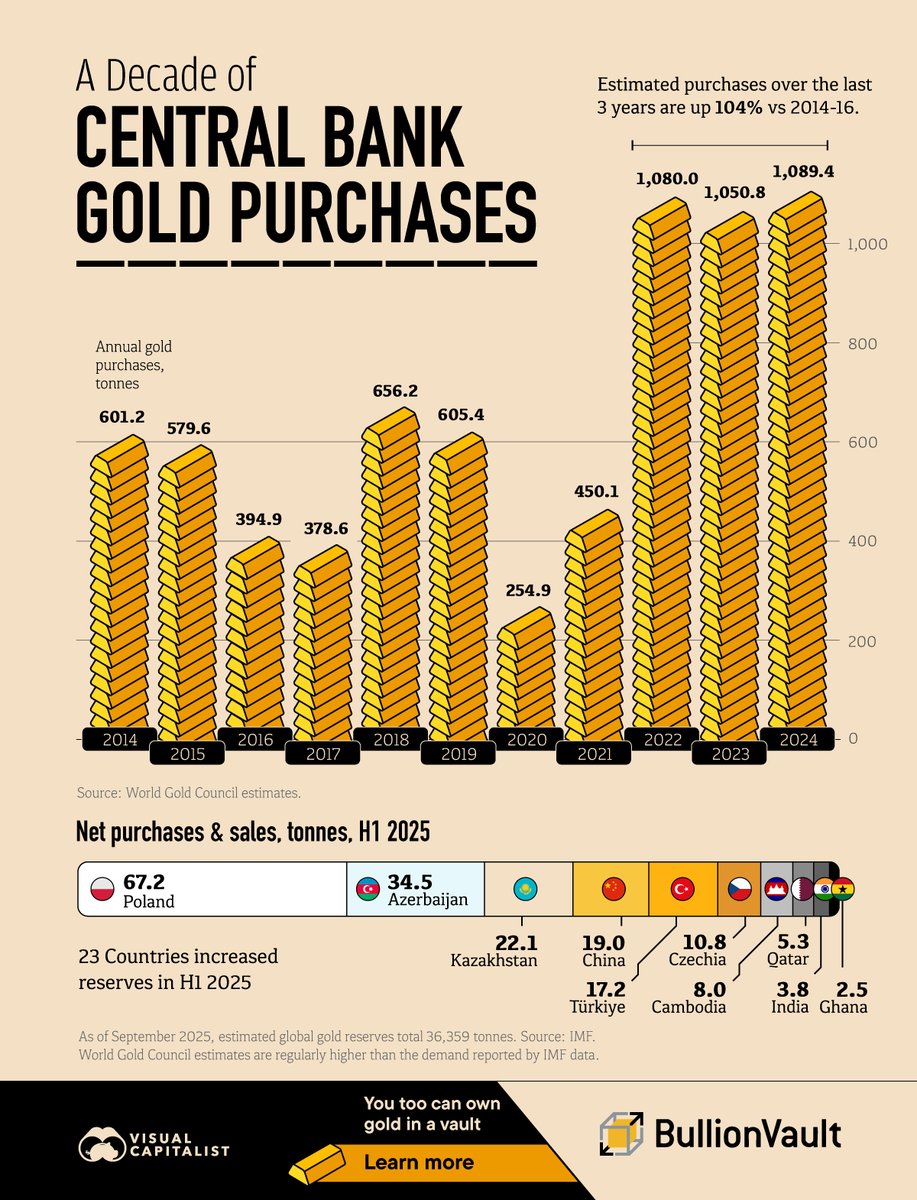
As inflation and geopolitical troubles linger, how have central banks responded in terms of gold buying? 🪙 This graphic, in partnership with @bullionvault, shows a decade of annual central bank gold purchases (2014–2024) and the top buyers in H1 2025 using data from the World…
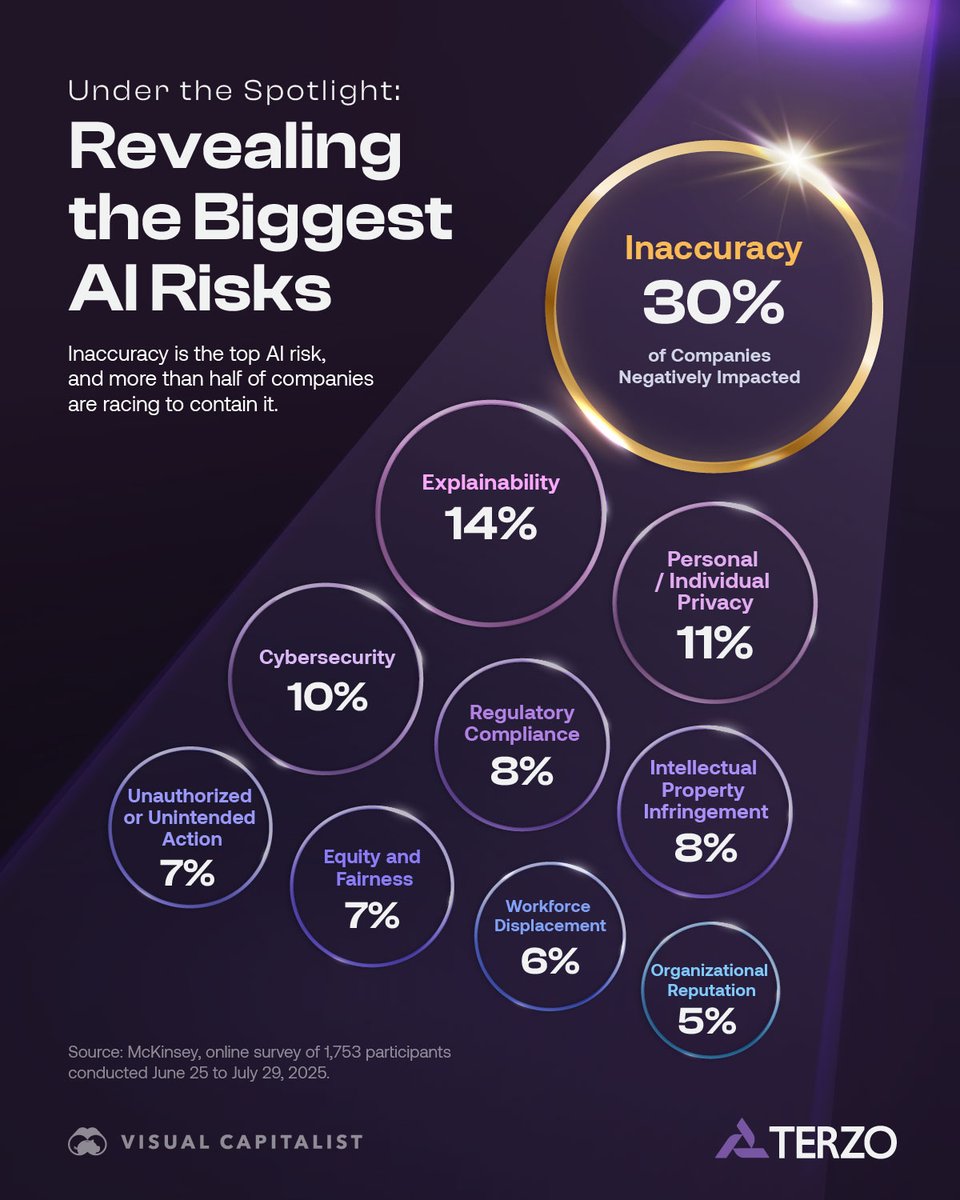
Nearly a third of companies have been negatively impacted by AI inaccuracy at least once ⚠️ This infographic breaks down the most common risks. It’s a preview of the brand-new executive guide done in partnership with @TerzoHQ, AI’s Illusion of Truth: The Data Behind AI Errors.…
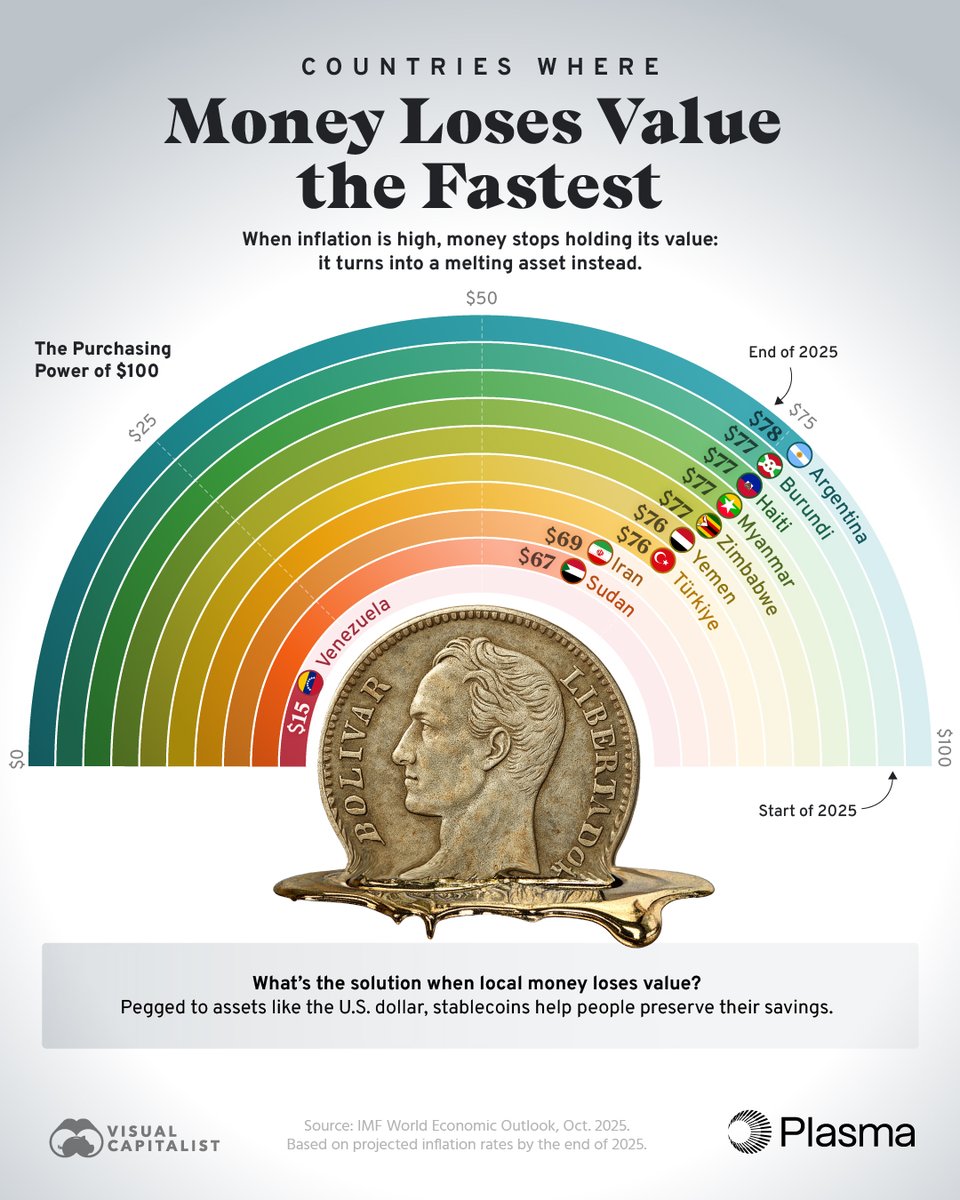
When prices rise, money's value melts away. See how inflation could shrink the value of $100 by the end of 2025 in the hardest-hit countries 📉 This graphic, created in partnership with @Plasma, highlights countries with the highest inflation rates and what $100 could be worth…
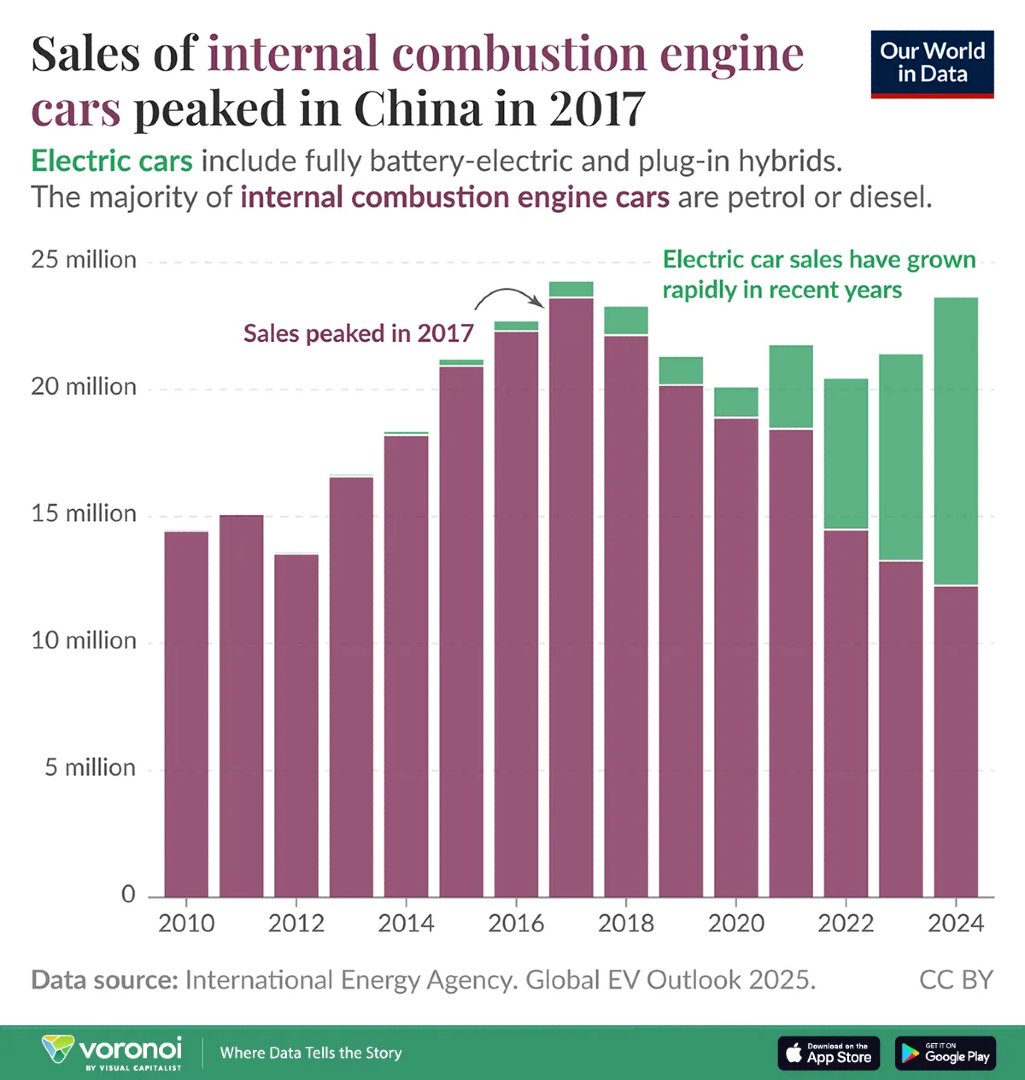
China’s EV Explosion, in One Chart (2010-2024) 🚗 This graphic by @OurWorldInData is one of the many incredible data-driven charts and stories from creators featured on our @VoronoiApp. ✅ voronoiapp.com/automotive/Chi…
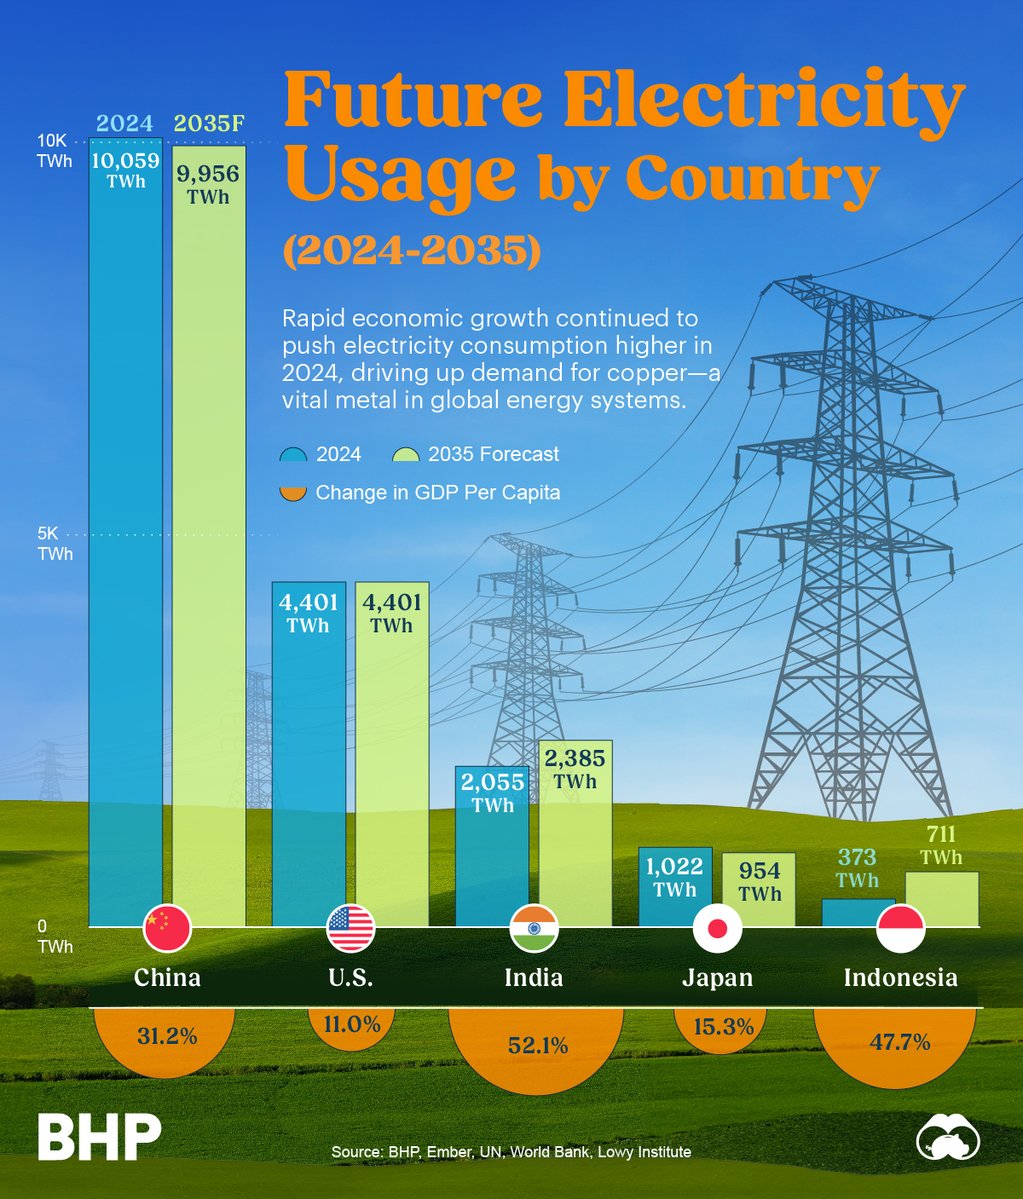
Projected electricity usage growth and economic development are driving global copper demand—see how energy use is rising from 2024 to 2035 ⚡ Here, we've partnered with @bhp to visualize the projected growth in electricity consumption and GDP per capita across five major…
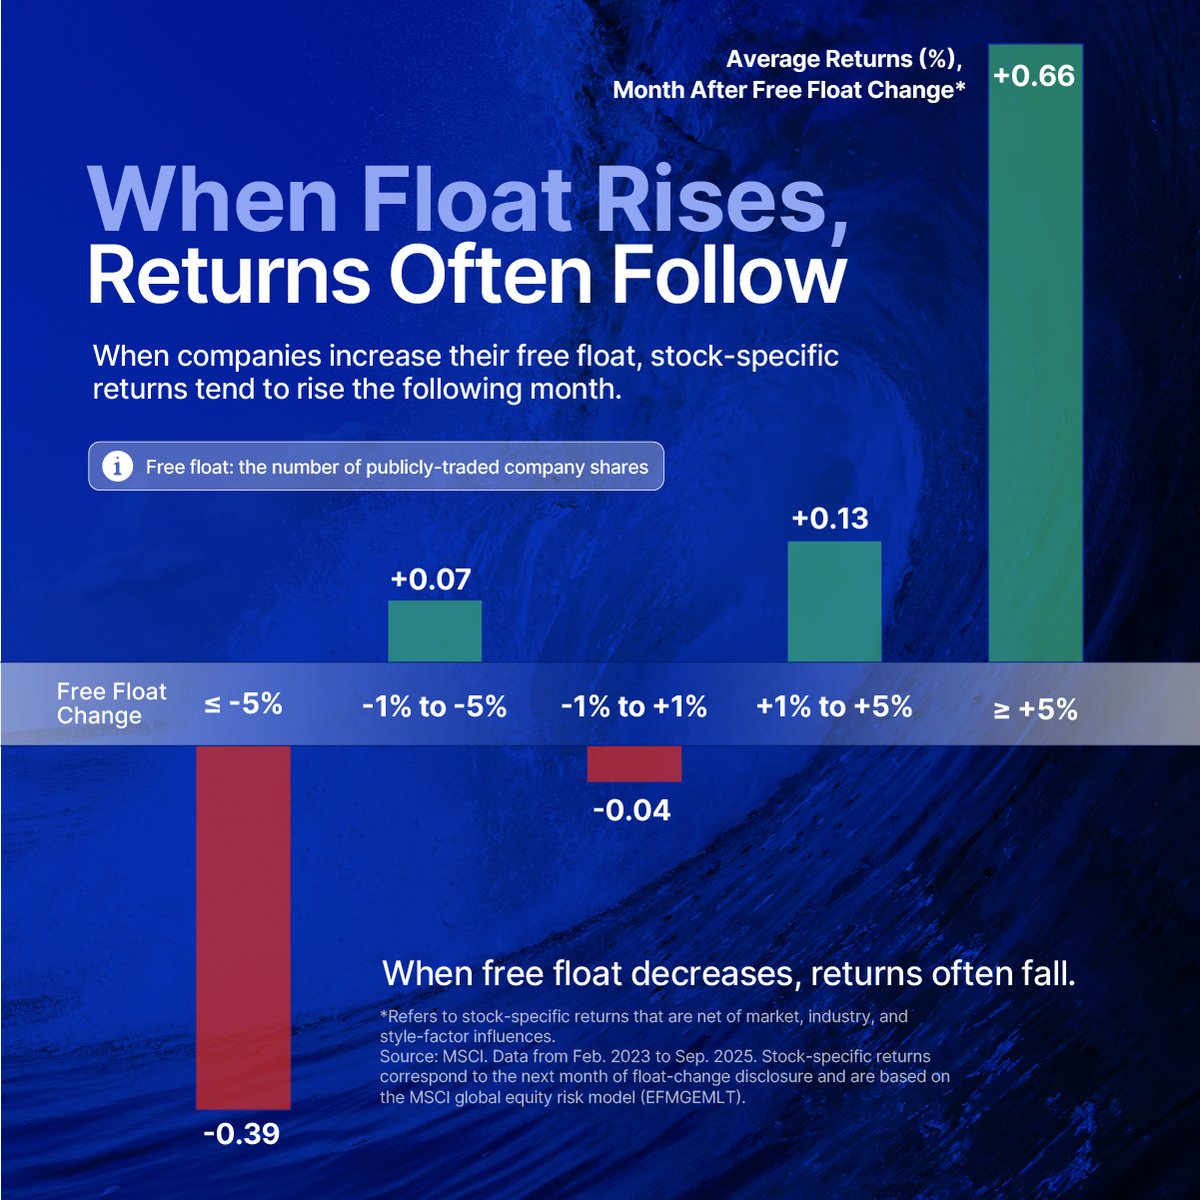
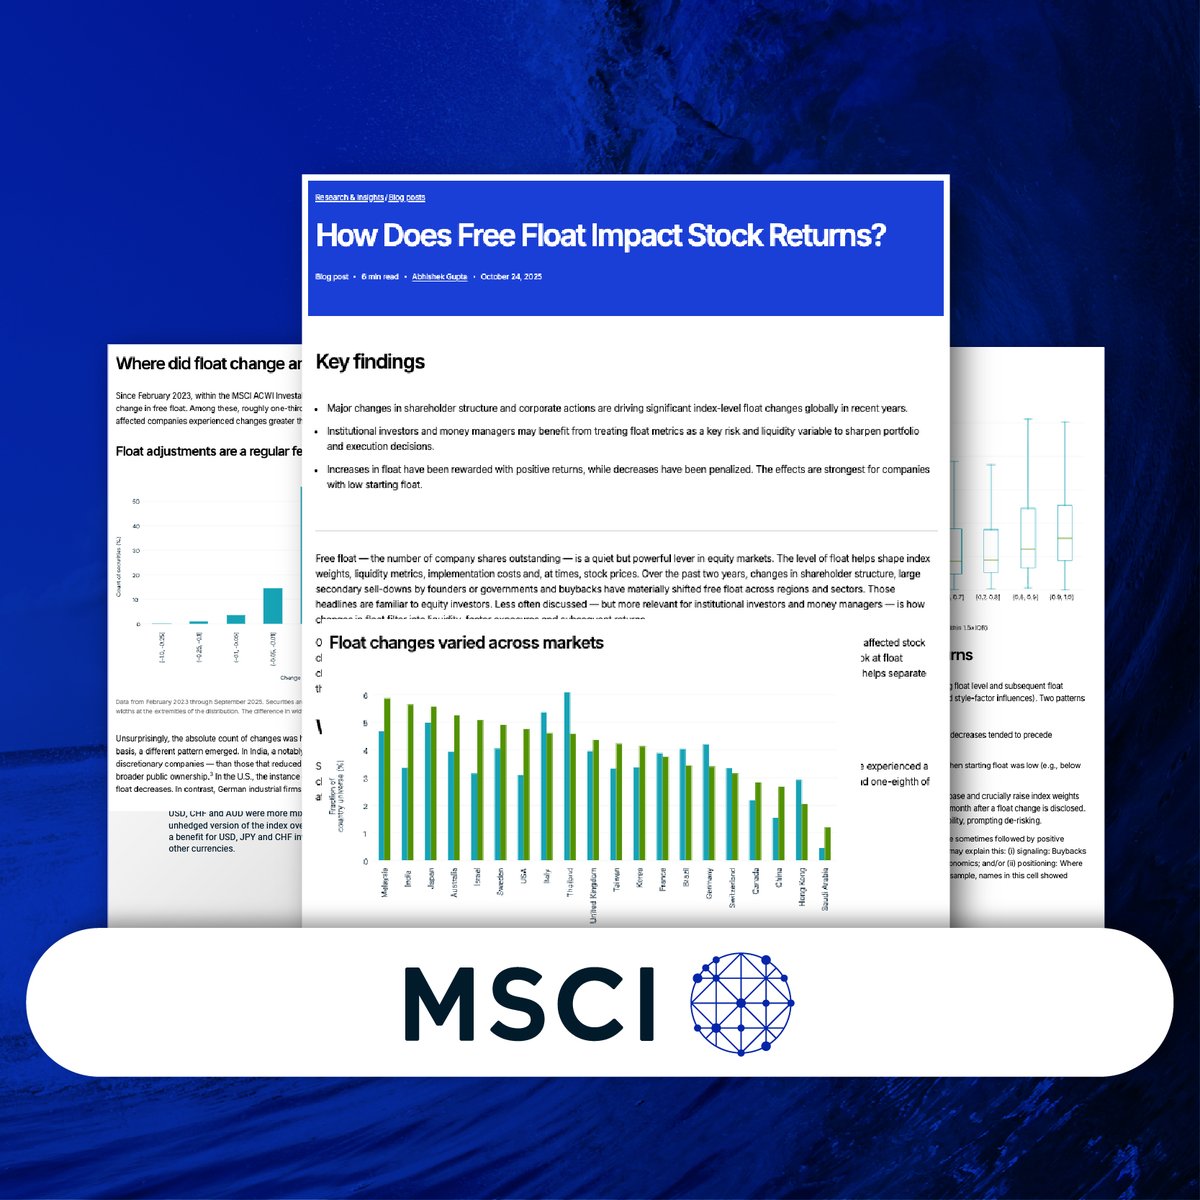
After an increase in free float, which is the number of publicly-traded company shares, stock prices tend to rise the next month 📈 This graphic, in partnership with @MSCI_Inc, shows how changes in free float have historically impacted the next month’s returns.…
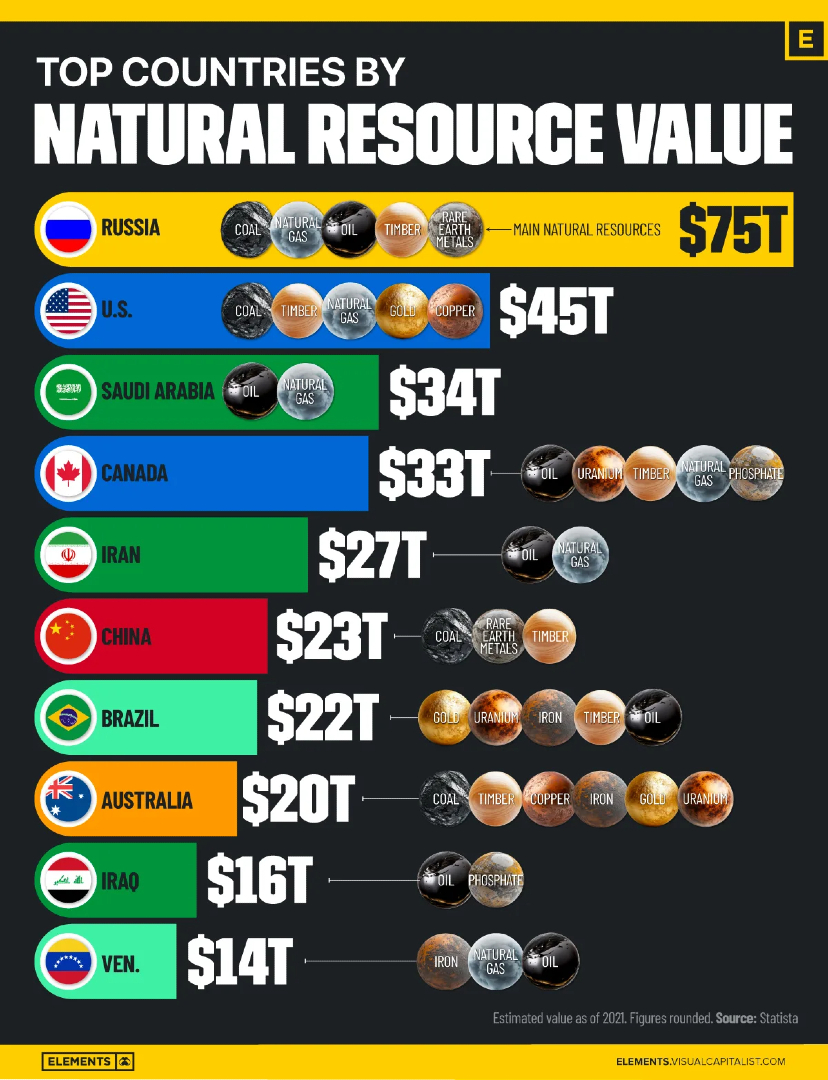
Flashback Favorite 🔙 Ranked: Top 10 Countries by Value of All Their Natural Resources ⛏️ From the Archive: visualcapitalist.com/ranked-top-10-…


United States Trends
- 1. Black Friday 311K posts
- 2. #releafcannabis N/A
- 3. Good Friday 50.5K posts
- 4. #FanCashDropPromotion N/A
- 5. #DaesangForJin 55K posts
- 6. #ENHYPEN 208K posts
- 7. #AVenezuelaNoLaTocaNadie 1,040 posts
- 8. ARMY Protect The 8thDaesang 2,980 posts
- 9. Victory Friday N/A
- 10. 2025 MAMA Awards 457K posts
- 11. Third World Countries 42.4K posts
- 12. yeonjun 67.8K posts
- 13. Mnet 211K posts
- 14. Cyber Monday 5,245 posts
- 15. Sarah Beckstrom 264K posts
- 16. Lamar 48.9K posts
- 17. Signing Day 1,169 posts
- 18. TODAY ONLY 63.4K posts
- 19. Mr. President 20.7K posts
- 20. Stormzy 2,079 posts
You might like
-
 World of Statistics
@stats_feed -
 Naval
Naval
@naval -
 Elements
@VCElements -
 Prof. Feynman
@ProfFeynman -
 Compounding Quality
@QCompounding -
 Ray Dalio
@RayDalio -
 James Clear
@JamesClear -
 Howard Marks
@HowardMarksBook -
 Yardeni Research
@yardeni -
 Our World in Data
@OurWorldInData -
 (((The Daily Shot)))
@SoberLook -
 Steve Hanke
@steve_hanke -
 Long Equity
@long_equity -
 Statista
@StatistaCharts
Something went wrong.
Something went wrong.