你可能會喜歡


If you like my views I post, don't hesitate to like and retweet. If you don't like my views I post, don't hesitate to unfollow me. ✌️✌️
Pasupati acrylon Shared earlier also many times and recently near 46 Disclaimer - personally holding for 3 digit

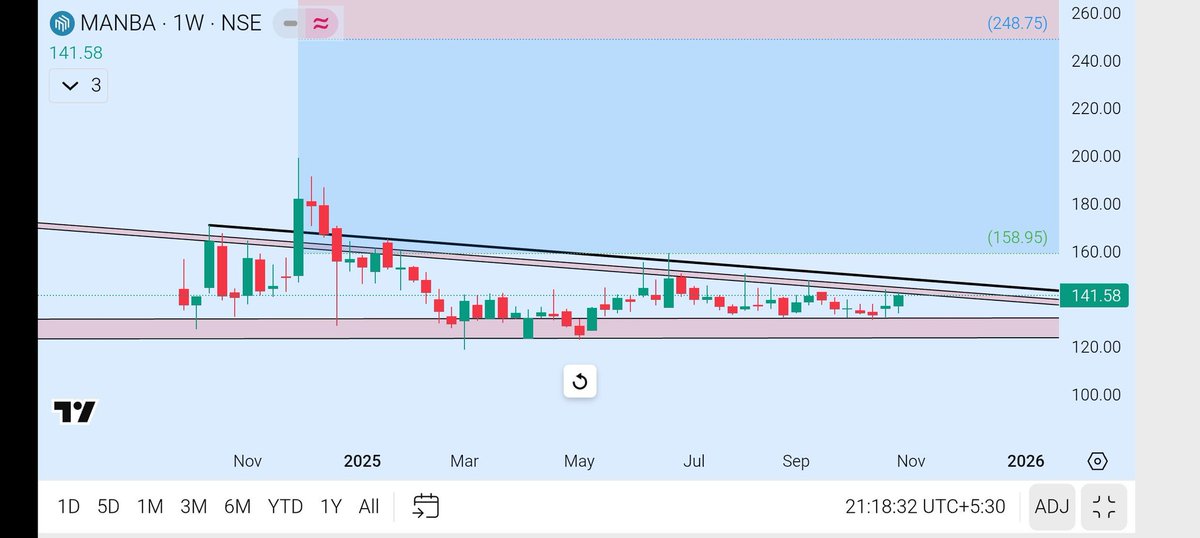
Manba Finance*l CMP 141 Good Support near 120-125 Disclaimer - personally holding and low volume stock.
#gmbrew More than 30% Returns in 3 days 🐎 🐎 Disclaimer - Chart for study purpose. @what_chart_says
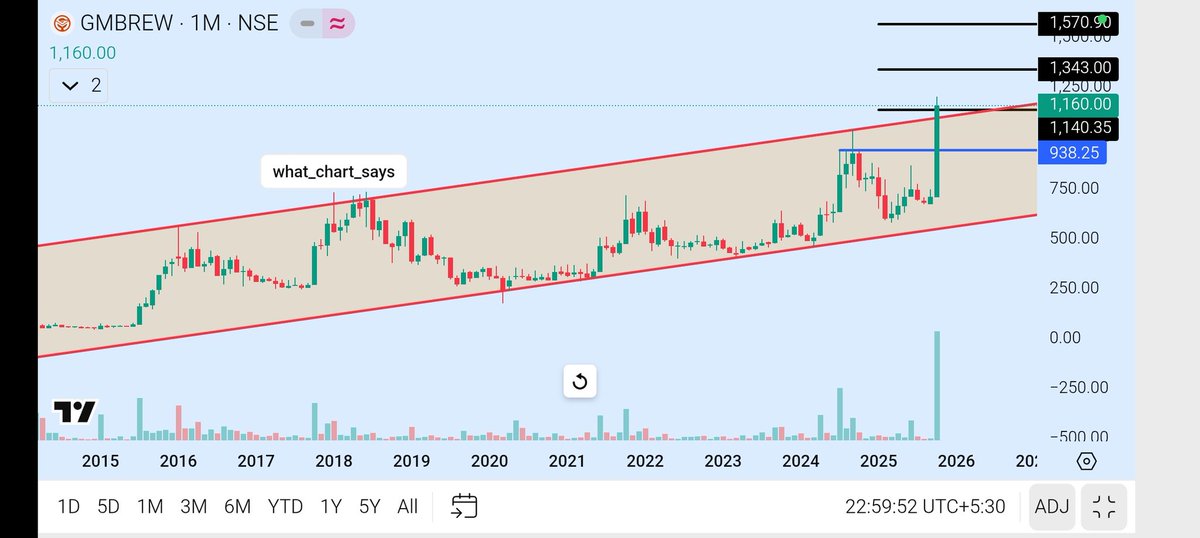
📊 GM Breweries Ltd (GMBREW) CMP: ₹894 Q2 FY26 ✅ Revenue: ₹718 Cr vs ₹596 Cr YoY | QoQ: ₹638 Cr ✅ EBITDA: ↑ 64% YoY ✅ PBT: ₹46.6 Cr vs ₹29 Cr (YoY) | ₹34.5 Cr ✅ PAT: ₹35 Cr vs ₹22 Cr YoY | ₹26 Cr QoQ Disclaimer - Chart for study purpose. @what_chart_says

📊 GM Breweries Ltd (GMBREW) CMP: ₹894 Q2 FY26 ✅ Revenue: ₹718 Cr vs ₹596 Cr YoY | QoQ: ₹638 Cr ✅ EBITDA: ↑ 64% YoY ✅ PBT: ₹46.6 Cr vs ₹29 Cr (YoY) | ₹34.5 Cr ✅ PAT: ₹35 Cr vs ₹22 Cr YoY | ₹26 Cr QoQ Disclaimer - Chart for study purpose. @what_chart_says
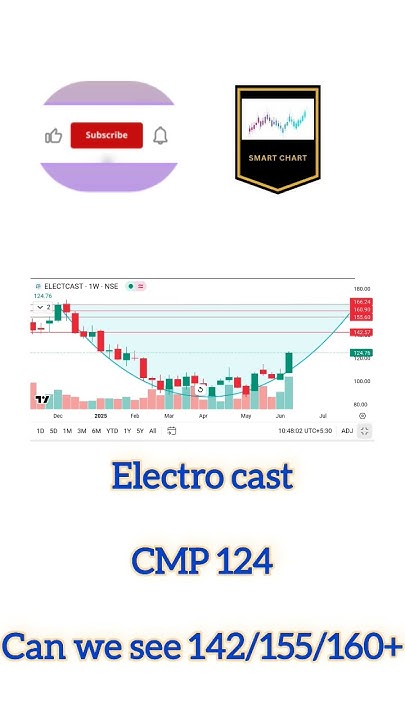
youtube.com/shorts/vCK8Dd-… #Electrocast Shared near 124 and made high till 135 Subscribe to YouTube if you don't want to miss
youtube.com
YouTube
#electcast #what_chart_says #stockstowatch #stockstobuy #ytshorts...
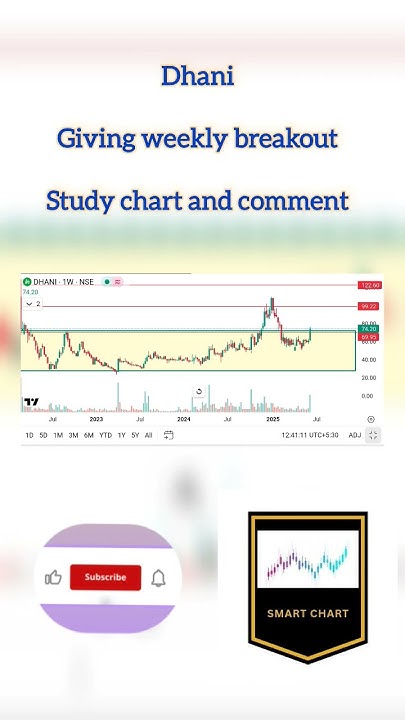
youtube.com/shorts/xTpUooN… #dhani Do subscribe our YouTube channel
youtube.com
YouTube
#dhani #stockstowatch #stockstobuy #what_chart_says #ytshorts...
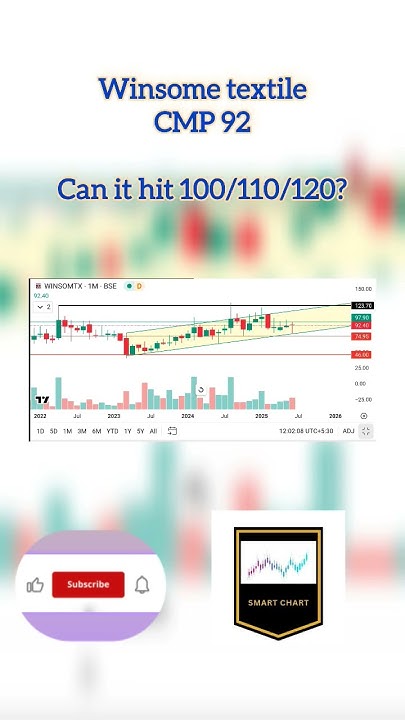
youtube.com/shorts/k2a5X6Y… #winsome Shared near 92 and hit high 97+ Subscribe to YouTube channel so that you don't miss the videos
youtube.com
YouTube
#winsome #stockstowatch #stockstobuy #what_chart_says #ytshorts #viral
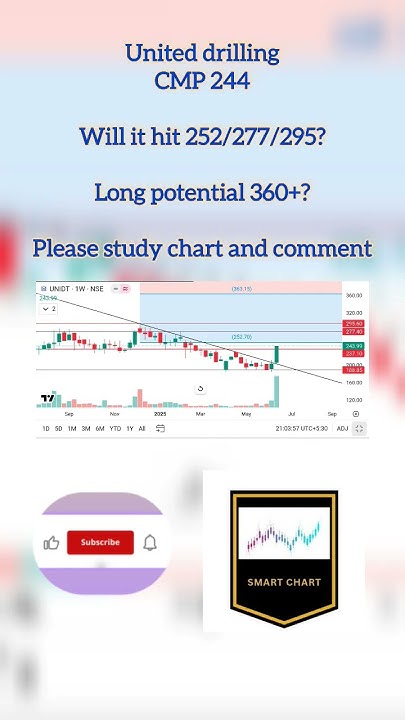
youtube.com/shorts/XhxQxSm… #uniteddrilling Please subscribe to channel
youtube.com
YouTube
#uniteddrilling #what_chart_says #stockstowatch #stockstobuy #ytshorts
#aurum Shared at 225 in telegram and today made high 255 t.me/Smart_Charts/1… Disclaimer - personally invested

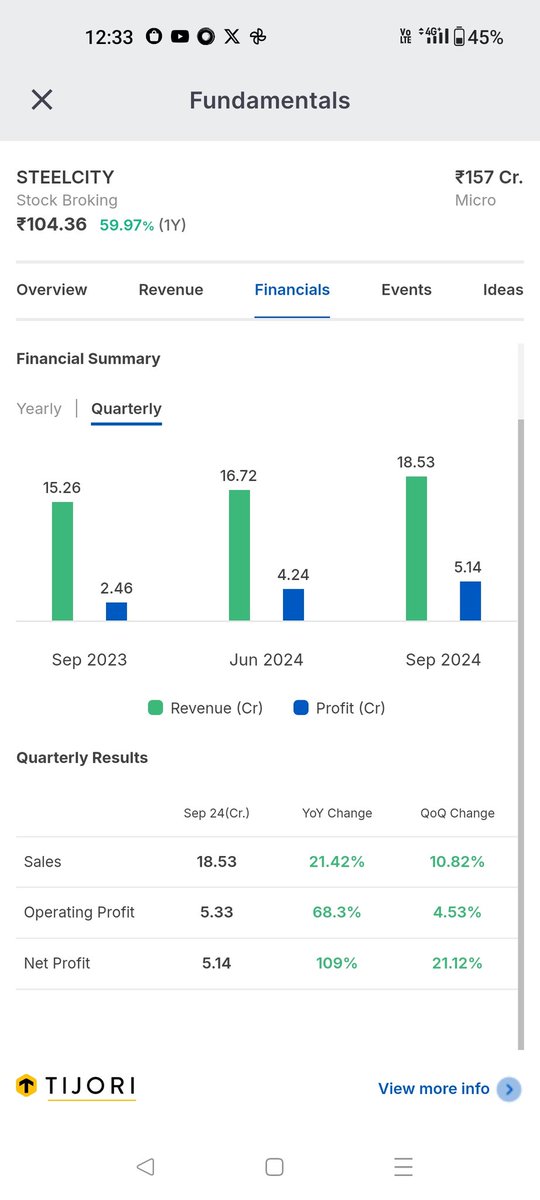
#steelcity #analysis My little analysis on steel city securities Please like, share and retweet if you liked it.
#silinvestment Last week hit 743 Gave near 300-340 range with constant target updates on telegram 800/900/1000 soon Long term 1500+ 🇹- t.me/Smart_Charts 𝕏 - @what_chart_says


United States 趨勢
- 1. #SpotifyWrapped 202K posts
- 2. Chris Paul 26K posts
- 3. Hartline 8,231 posts
- 4. Clippers 37.6K posts
- 5. #HappyBirthdayJin 90.9K posts
- 6. Henry Cuellar 2,889 posts
- 7. GreetEat Corp N/A
- 8. David Corenswet 4,732 posts
- 9. Jonathan Bailey 5,967 posts
- 10. ethan hawke 3,119 posts
- 11. South Florida 5,585 posts
- 12. $MSFT 14K posts
- 13. #NSD26 22.3K posts
- 14. Chris Henry Jr 1,032 posts
- 15. #WorldwideHandsomeJin 71.6K posts
- 16. #JINDAY 72.8K posts
- 17. Collin Klein 1,664 posts
- 18. Chris Klieman 1,776 posts
- 19. Apple Music 258K posts
- 20. Penn State 23.9K posts
你可能會喜歡
-
 Eagle Eyes Multibagger Investment
@EagleEyesTrades -
 EQUITY JUNCTION
@EquityJunction -
 Trading Adda
@Tradinggadda -
 NAYAN PATEL
@nayanrp -
 @KM.BHAI
@kapoorsmede1 -
 Mohan Chand
@Mohantiwari1984 -
 Arjun
Arjun
@puneetjoshi7687 -
 Kaal Rider
@Trndline_Trader -
 Amit Gautam
@Amitgautam3001 -
 Akshit shah
@equistake_in -
 Gaurav 🇮🇳
@LoveforEquity -
 Arrush narang
@arush_narang -
 Samarjit Talukdar
@SAMARJITTALUKD4 -
 Manoj Kumar Garg
@ManojKu86922375 -
 Sagar Paryani
@sagarforparyani
Something went wrong.
Something went wrong.