#50daysofdatascience search results

Day 38 of the #50DaysOfDataScience challenge! Forget basic charts! The real power of Seaborn lies in exploring complex relationships and creating multi-panel stories. I'm diving deep into Relational Plots to master how two quantitative variables interact.
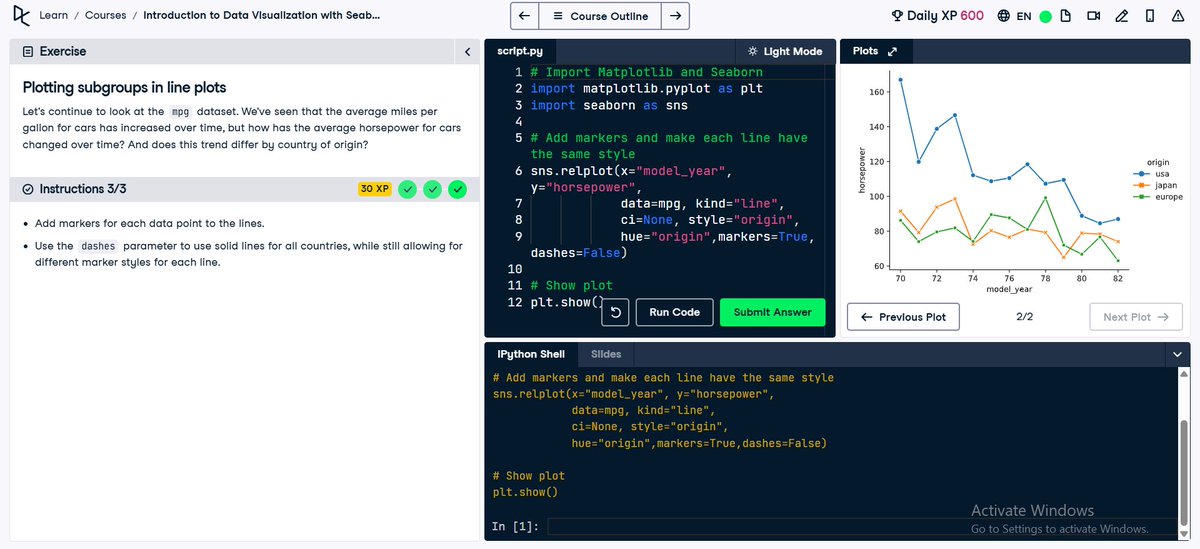
Day 37 of the #50DaysOfDataScience challenge! Today learnt how seaborn uses relplot() i.e relationship to visualize the subsets of data. This increases understanding and helps study different relationships quite easily which informs the conclusions we make. #LearningInPublic
Day 40 of the #50DaysOfDataScience challenge! It's a day before I start my exams and I spent the day reading. When I finally took sometime to do some DataCamp practice I was reminded of how fast time moves. Showing up has been hard sometimes but oh so rewarding. #LearningInPublic
Day 39 of the #50DaysOfDataScience challenge! The number of decisions you make when visualizing data never ceases to amaze me, they are not loud or big but every little one you take to make your story better is so worth it. I got this from the group project we are working on.

Day 30 complete in the #50DaysOfDataScience challenge! Today's lesson reinforced a vital dashboard rule, always tell a clear story. Cut the visual noise and only keep what drives the user to an insight or action. Ask does this visual element serve the narrative?

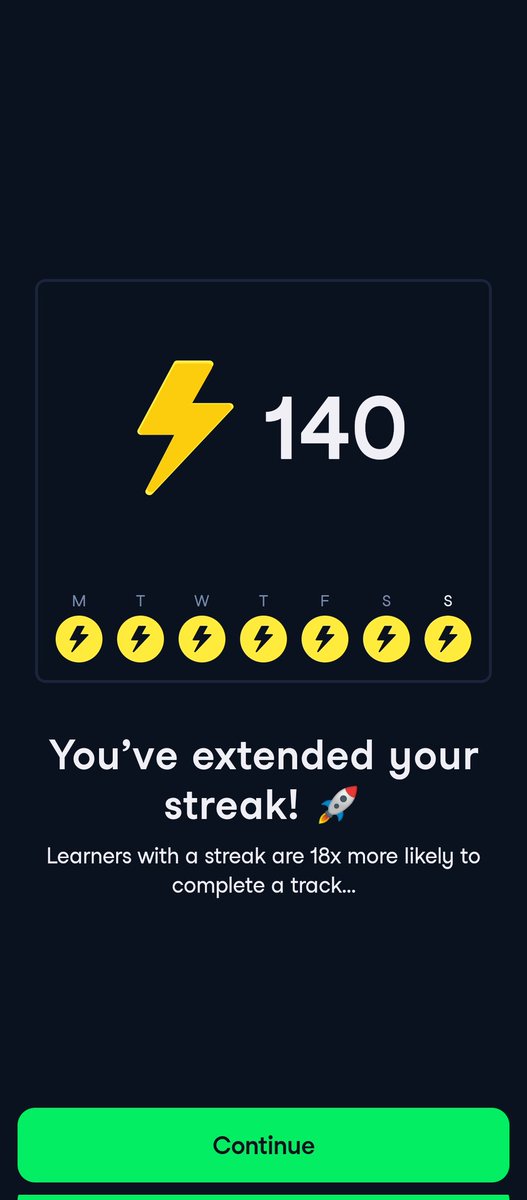
Day 29 of #50DaysOfDataScience! Today I kept my @DataCamp streak going at 130 days by doing quizzes of the topics I already have certificates in. Revisiting concepts I once found challenging is so nice because now I get to see how far I have come.
Day 44 of my #50DaysOfDataScience challenge! Adding to the certifications, that's the post for today. #LearningInPublic

Day 43 of my #50DaysOfDataScience challenge! Today I did the practices of certificates I have already completed that DataCamp offers to reinforce what I learnt and keep my learning streak alive. #LearningInPublic
Day 31 in the #50DaysOfDataScience challenge! I read, knowing how much knowledge is lying around if only we took the time to read. A worthy read from DataCamp. One statement stood out and I want to share it "AI adoption is here, but responsible, effective usage depends on skills.

Day 30 complete in the #50DaysOfDataScience challenge! Today's lesson reinforced a vital dashboard rule, always tell a clear story. Cut the visual noise and only keep what drives the user to an insight or action. Ask does this visual element serve the narrative?
Day 41 of my #50DaysOfDataScience challenge! Today, I went a little deeper in Visualizing Categorical and Quantitative Variables! 📊Categorical data is everywhere, especially in surveys. I'm mastering how to use the function catplot() to make plots like:

Day 40 of the #50DaysOfDataScience challenge! It's a day before I start my exams and I spent the day reading. When I finally took sometime to do some DataCamp practice I was reminded of how fast time moves. Showing up has been hard sometimes but oh so rewarding. #LearningInPublic
Day 35 of the #50DaysOfDataScience challenge! I started learning about seaborn as you can probably see from the picture I am a complete beginner. I will however say that what I have seen so far has been quite interesting and I look forward to the next couple of days learning it.

Days 33 and 34 of the #50DaysOfDataScience challenge! Leaving in an African country happened to me yesterday, first I didn't have electricity and then after a while it was just the wifi not working which is why I could not post yesterday. That however did not mean I didn't learn
Day 32 of the #50DaysOfDataScience challenge! To start the new month, I got into learning about seaborn which is most useful in exploring data and communicating the results. #LearningInPublic
Day 31 in the #50DaysOfDataScience challenge! I read, knowing how much knowledge is lying around if only we took the time to read. A worthy read from DataCamp. One statement stood out and I want to share it "AI adoption is here, but responsible, effective usage depends on skills.
Day 50 of my #50DaysOfDataScience challenge! I made it this far, I am proud of having crushed my certification goals that got me started. This journey has been one of my biggest tests of discipline but I am glad I stayed the course. #LearningInPublic
Day 49 of my #50DaysOfDataScience challenge! Today I was reading and stumbled into some of Henrica Makulu's medium posts. One in particular about how to get into Data Science stuck out because even though I am reading it years after she put it out, it is still relevant.
Day 49 of my #50DaysOfDataScience challenge! Today I was reading and stumbled into some of Henrica Makulu's medium posts. One in particular about how to get into Data Science stuck out because even though I am reading it years after she put it out, it is still relevant.
Day 48 of my #50DaysOfDataScience challenge! I get to explore the data set of Nobel Prize winner and identify patterns. It is quite exciting and I can't wait to share the end result. #LearningInPublic
Day 24 of #50DaysOfDataScience and Power BI is a workflow wonder! In a fast-paced world, getting instant, clean Data Insights is incredibly satisfying. It's a huge motivator to keep practicing!Data Cleaning, Transformation, Instant Results. This is the data pipeline I'm here for.
Day 23 of #50DaysOfDataScience!The complexity of modern data is demanding a new skillset. Stop drowning in spreadsheets. Big Data isn't just "big" it's a multi-dimensional challenge defined by the 4 V's.
Day 26 of #50DaysOfDataScience. The true disaster in Data Science isn't wrong data it's irrelevant data. Happy users don't always act. Angry users do act. But a dashboard that elicits NO emotional reaction is dead on arrival.
🎉 Halfway Mark! Day 25 of #50DaysOfDataScience! One of the best things about Power BI is how deceptively easy it is to create foundational visualizations. Drag, Drop, Instant Chart.
Day 48 of my #50DaysOfDataScience challenge! I get to explore the data set of Nobel Prize winner and identify patterns. It is quite exciting and I can't wait to share the end result. #LearningInPublic
Day 47 of my #50DaysOfDataScience challenge! Today was about reading and keeping my datacamp learning streak alive.
Day 43 of my #50DaysOfDataScience challenge! Today I did the practices of certificates I have already completed that DataCamp offers to reinforce what I learnt and keep my learning streak alive. #LearningInPublic
Day 42 of my #50DaysOfDataScience challenge! You customize visuals for a number of reasons e.g preference, readability. That is what I was practicing today. I might have been saying wow every 2 seconds (sirens watch out) because getting visuals to the vision you had does that.
Day 37 of the #50DaysOfDataScience challenge! Today learnt how seaborn uses relplot() i.e relationship to visualize the subsets of data. This increases understanding and helps study different relationships quite easily which informs the conclusions we make. #LearningInPublic
Day 36 of the #50DaysOfDataScience challenge! The highlight of my learning today was an assignment my group did. We were using looker studio, it was a lot of trial and error but when we were done I was so proud.I love the fellowship so much it has kept me accountable @Tech4DevHQ
Day 27 of #50DaysOfDataScience! Hitting the books. It's easy to get caught in the sprint of coding, but intentional theory work is where the deep learning happens. Stepping away from the keyboard to solidify the "why" behind the "how" is crucial for truly mastering data science
Day 26 of #50DaysOfDataScience. The true disaster in Data Science isn't wrong data it's irrelevant data. Happy users don't always act. Angry users do act. But a dashboard that elicits NO emotional reaction is dead on arrival.
Day 36 of the #50DaysOfDataScience challenge! The highlight of my learning today was an assignment my group did. We were using looker studio, it was a lot of trial and error but when we were done I was so proud.I love the fellowship so much it has kept me accountable @Tech4DevHQ
Day 35 of the #50DaysOfDataScience challenge! I started learning about seaborn as you can probably see from the picture I am a complete beginner. I will however say that what I have seen so far has been quite interesting and I look forward to the next couple of days learning it.
Day 39 of the #50DaysOfDataScience challenge! The number of decisions you make when visualizing data never ceases to amaze me, they are not loud or big but every little one you take to make your story better is so worth it. I got this from the group project we are working on.
Day 38 of the #50DaysOfDataScience challenge! Forget basic charts! The real power of Seaborn lies in exploring complex relationships and creating multi-panel stories. I'm diving deep into Relational Plots to master how two quantitative variables interact.
Day 28 of #50DaysOfDataScience! Why do developers, data scientists and IT pros overwhelmingly choose the Cloud? It’s simple it removes bottlenecks and supercharges innovation.
Day 27 of #50DaysOfDataScience! Hitting the books. It's easy to get caught in the sprint of coding, but intentional theory work is where the deep learning happens. Stepping away from the keyboard to solidify the "why" behind the "how" is crucial for truly mastering data science
Day 50 of my #50DaysOfDataScience challenge! I made it this far, I am proud of having crushed my certification goals that got me started. This journey has been one of my biggest tests of discipline but I am glad I stayed the course. #LearningInPublic
Day 49 of my #50DaysOfDataScience challenge! Today I was reading and stumbled into some of Henrica Makulu's medium posts. One in particular about how to get into Data Science stuck out because even though I am reading it years after she put it out, it is still relevant.
Day 49 of my #50DaysOfDataScience challenge! Today I was reading and stumbled into some of Henrica Makulu's medium posts. One in particular about how to get into Data Science stuck out because even though I am reading it years after she put it out, it is still relevant.
Day 48 of my #50DaysOfDataScience challenge! I get to explore the data set of Nobel Prize winner and identify patterns. It is quite exciting and I can't wait to share the end result. #LearningInPublic
Day 48 of my #50DaysOfDataScience challenge! I get to explore the data set of Nobel Prize winner and identify patterns. It is quite exciting and I can't wait to share the end result. #LearningInPublic
Day 47 of my #50DaysOfDataScience challenge! Today was about reading and keeping my datacamp learning streak alive.
Day 47 of my #50DaysOfDataScience challenge! Today was about reading and keeping my datacamp learning streak alive.
Day 45 and 46 of my #50DaysOfDataScience challenge! I didn't get around to posting yesterday because honestly between my exam and the Enactus competition we had I didn't manage to get any studying in.
Day 45 and 46 of my #50DaysOfDataScience challenge! I didn't get around to posting yesterday because honestly between my exam and the Enactus competition we had I didn't manage to get any studying in.
Day 44 of my #50DaysOfDataScience challenge! Adding to the certifications, that's the post for today. #LearningInPublic
Day 44 of my #50DaysOfDataScience challenge! Adding to the certifications, that's the post for today. #LearningInPublic
Day 43 of my #50DaysOfDataScience challenge! Today I did the practices of certificates I have already completed that DataCamp offers to reinforce what I learnt and keep my learning streak alive. #LearningInPublic
Day 43 of my #50DaysOfDataScience challenge! Today I did the practices of certificates I have already completed that DataCamp offers to reinforce what I learnt and keep my learning streak alive. #LearningInPublic
Day 42 of my #50DaysOfDataScience challenge! You customize visuals for a number of reasons e.g preference, readability. That is what I was practicing today. I might have been saying wow every 2 seconds (sirens watch out) because getting visuals to the vision you had does that.
Day 42 of my #50DaysOfDataScience challenge! You customize visuals for a number of reasons e.g preference, readability. That is what I was practicing today. I might have been saying wow every 2 seconds (sirens watch out) because getting visuals to the vision you had does that.
Day 41 of my #50DaysOfDataScience challenge! Today, I went a little deeper in Visualizing Categorical and Quantitative Variables! 📊Categorical data is everywhere, especially in surveys. I'm mastering how to use the function catplot() to make plots like:
Day 41 of my #50DaysOfDataScience challenge! Today, I went a little deeper in Visualizing Categorical and Quantitative Variables! 📊Categorical data is everywhere, especially in surveys. I'm mastering how to use the function catplot() to make plots like:
Day 40 of the #50DaysOfDataScience challenge! It's a day before I start my exams and I spent the day reading. When I finally took sometime to do some DataCamp practice I was reminded of how fast time moves. Showing up has been hard sometimes but oh so rewarding. #LearningInPublic
Day 40 of the #50DaysOfDataScience challenge! It's a day before I start my exams and I spent the day reading. When I finally took sometime to do some DataCamp practice I was reminded of how fast time moves. Showing up has been hard sometimes but oh so rewarding. #LearningInPublic
Day 39 of the #50DaysOfDataScience challenge! The number of decisions you make when visualizing data never ceases to amaze me, they are not loud or big but every little one you take to make your story better is so worth it. I got this from the group project we are working on.
Day 39 of the #50DaysOfDataScience challenge! The number of decisions you make when visualizing data never ceases to amaze me, they are not loud or big but every little one you take to make your story better is so worth it. I got this from the group project we are working on.
Day 38 of the #50DaysOfDataScience challenge! Forget basic charts! The real power of Seaborn lies in exploring complex relationships and creating multi-panel stories. I'm diving deep into Relational Plots to master how two quantitative variables interact.
Day 38 of the #50DaysOfDataScience challenge! Forget basic charts! The real power of Seaborn lies in exploring complex relationships and creating multi-panel stories. I'm diving deep into Relational Plots to master how two quantitative variables interact.
Day 37 of the #50DaysOfDataScience challenge! Today learnt how seaborn uses relplot() i.e relationship to visualize the subsets of data. This increases understanding and helps study different relationships quite easily which informs the conclusions we make. #LearningInPublic
Day 37 of the #50DaysOfDataScience challenge! Today learnt how seaborn uses relplot() i.e relationship to visualize the subsets of data. This increases understanding and helps study different relationships quite easily which informs the conclusions we make. #LearningInPublic
Day 36 of the #50DaysOfDataScience challenge! The highlight of my learning today was an assignment my group did. We were using looker studio, it was a lot of trial and error but when we were done I was so proud.I love the fellowship so much it has kept me accountable @Tech4DevHQ
Day 36 of the #50DaysOfDataScience challenge! The highlight of my learning today was an assignment my group did. We were using looker studio, it was a lot of trial and error but when we were done I was so proud.I love the fellowship so much it has kept me accountable @Tech4DevHQ
Day 35 of the #50DaysOfDataScience challenge! I started learning about seaborn as you can probably see from the picture I am a complete beginner. I will however say that what I have seen so far has been quite interesting and I look forward to the next couple of days learning it.
Day 35 of the #50DaysOfDataScience challenge! I started learning about seaborn as you can probably see from the picture I am a complete beginner. I will however say that what I have seen so far has been quite interesting and I look forward to the next couple of days learning it.
Days 33 and 34 of the #50DaysOfDataScience challenge! Leaving in an African country happened to me yesterday, first I didn't have electricity and then after a while it was just the wifi not working which is why I could not post yesterday. That however did not mean I didn't learn
Days 33 and 34 of the #50DaysOfDataScience challenge! Leaving in an African country happened to me yesterday, first I didn't have electricity and then after a while it was just the wifi not working which is why I could not post yesterday. That however did not mean I didn't learn
Day 32 of the #50DaysOfDataScience challenge! To start the new month, I got into learning about seaborn which is most useful in exploring data and communicating the results. #LearningInPublic
Day 32 of the #50DaysOfDataScience challenge! To start the new month, I got into learning about seaborn which is most useful in exploring data and communicating the results. #LearningInPublic
Day 31 in the #50DaysOfDataScience challenge! I read, knowing how much knowledge is lying around if only we took the time to read. A worthy read from DataCamp. One statement stood out and I want to share it "AI adoption is here, but responsible, effective usage depends on skills.
Day 31 in the #50DaysOfDataScience challenge! I read, knowing how much knowledge is lying around if only we took the time to read. A worthy read from DataCamp. One statement stood out and I want to share it "AI adoption is here, but responsible, effective usage depends on skills.
Day 30 complete in the #50DaysOfDataScience challenge! Today's lesson reinforced a vital dashboard rule, always tell a clear story. Cut the visual noise and only keep what drives the user to an insight or action. Ask does this visual element serve the narrative?
Day 30 complete in the #50DaysOfDataScience challenge! Today's lesson reinforced a vital dashboard rule, always tell a clear story. Cut the visual noise and only keep what drives the user to an insight or action. Ask does this visual element serve the narrative?
Day 29 of #50DaysOfDataScience! Today I kept my @DataCamp streak going at 130 days by doing quizzes of the topics I already have certificates in. Revisiting concepts I once found challenging is so nice because now I get to see how far I have come.
Day 29 of #50DaysOfDataScience! Today I kept my @DataCamp streak going at 130 days by doing quizzes of the topics I already have certificates in. Revisiting concepts I once found challenging is so nice because now I get to see how far I have come.
Day 28 of #50DaysOfDataScience! Why do developers, data scientists and IT pros overwhelmingly choose the Cloud? It’s simple it removes bottlenecks and supercharges innovation.
Day 2 of #50DaysOfDataScience. First in my women Techsters class courtesy of @Tech4DevHQ we did data visualization using Pivot Tables in Excel. It was a great reminder that foundational tools let you quickly transform raw data into visual insights


Day 1 of #50DaysOfDataScience. I'm embarking on a 50-day sprint to accelerate my IT skills and critically, secure the minimum two accredited certificates required by @Tech4DevHQ for the Women Techsters fellowship though I’m aiming for more. Today was just the basics. #TechGoals

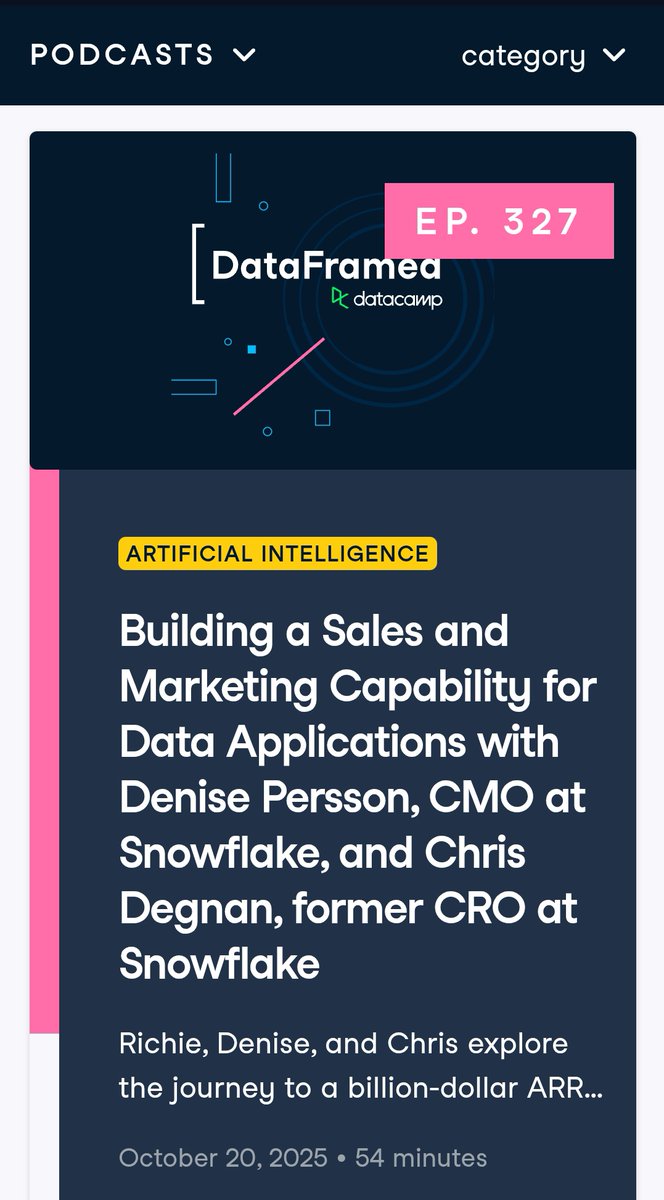
Day 22 of #50DaysOfDataScience! Today to just learn differently from how I normally do so that I keep my journey interesting I listened to the latest episode of DataFramed(a podcast on @DataCamp). I learnt so much from this, I am happy I discovered it. #LearningInPublic
Day 21 of #50DaysOfDataScience! Data-Analytic Thinking: The Strategic Imperative! Can you assess a consultant's data mining proposal? Recognize a competitor's strategic data move? Judge a data-asset valuation for an investment?

Me trying to understand Domain-specific packages for data science @DataScienceJos #50daysofdatascience

Day 1 of #50DaysOfDataScience. I'm embarking on a 50-day sprint to accelerate my IT skills and critically, secure the minimum two accredited certificates required by @Tech4DevHQ for the Women Techsters fellowship though I’m aiming for more. Today was just the basics. #TechGoals
Day 38 of the #50DaysOfDataScience challenge! Forget basic charts! The real power of Seaborn lies in exploring complex relationships and creating multi-panel stories. I'm diving deep into Relational Plots to master how two quantitative variables interact.
Day 37 of the #50DaysOfDataScience challenge! Today learnt how seaborn uses relplot() i.e relationship to visualize the subsets of data. This increases understanding and helps study different relationships quite easily which informs the conclusions we make. #LearningInPublic
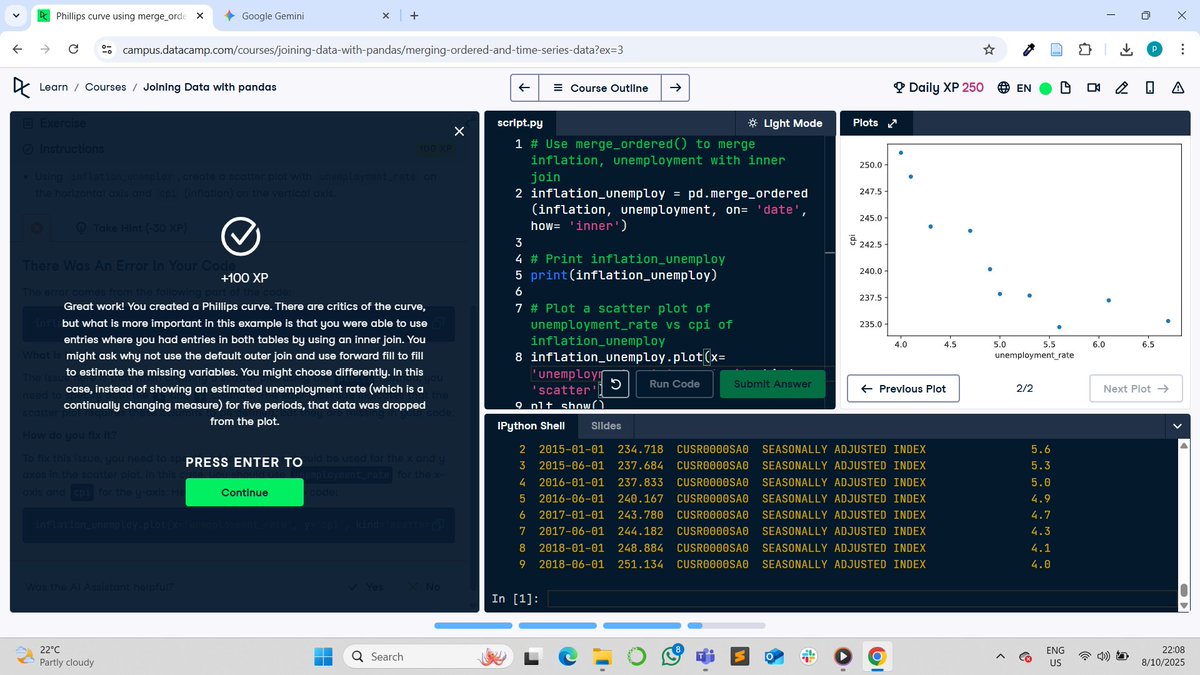
The first certificate is here🎊.Day 9 of #50DaysOfDataScience Merging Time-Series and Ordered Data the fun way! Ever wonder how economists compare GDP growth with stock market trends? Today, we dive into that exact kind of analysis using real data from the city of Chicago

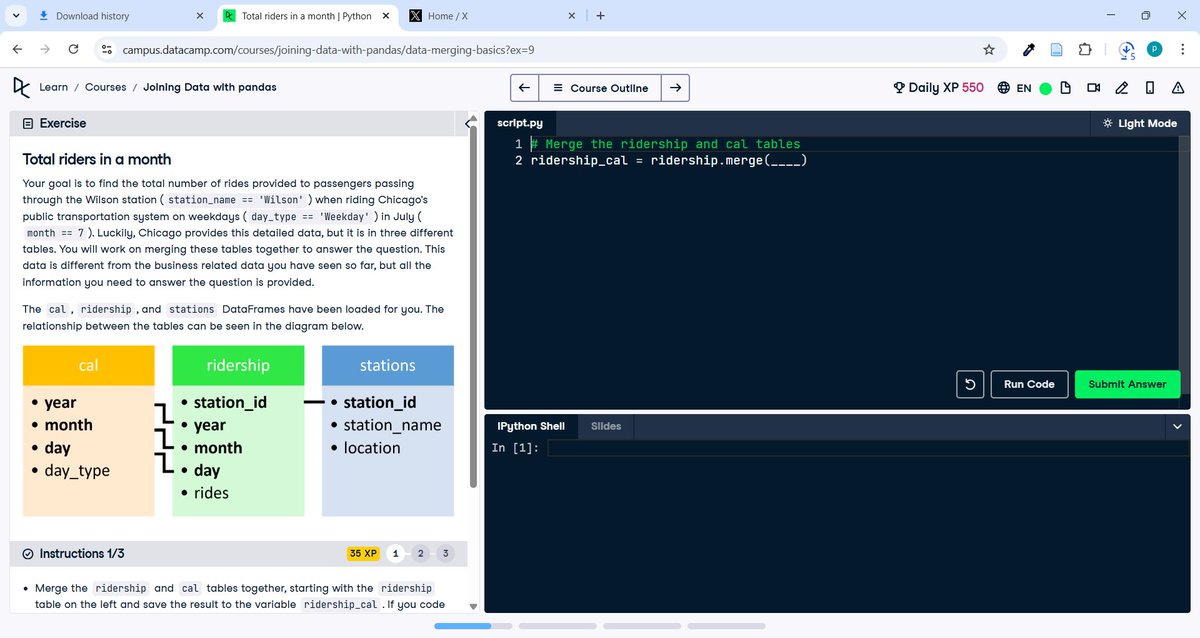
Day 8 of #50DaysOfDataScience! Even on a busy day, consistency is key. I didn't hit my usual targets, but I still dedicated time to learning, and that's a win! Today's focus: Advanced Merging in Pandas.
Day 40 of the #50DaysOfDataScience challenge! It's a day before I start my exams and I spent the day reading. When I finally took sometime to do some DataCamp practice I was reminded of how fast time moves. Showing up has been hard sometimes but oh so rewarding. #LearningInPublic
Day 39 of the #50DaysOfDataScience challenge! The number of decisions you make when visualizing data never ceases to amaze me, they are not loud or big but every little one you take to make your story better is so worth it. I got this from the group project we are working on.
@tech_bedimma how is the learning process thus far. This DataScience ain't straightforward though. #50daysofdatascience @DataScienceJos

Day 35 of the #50DaysOfDataScience challenge! I started learning about seaborn as you can probably see from the picture I am a complete beginner. I will however say that what I have seen so far has been quite interesting and I look forward to the next couple of days learning it.
Days 33 and 34 of the #50DaysOfDataScience challenge! Leaving in an African country happened to me yesterday, first I didn't have electricity and then after a while it was just the wifi not working which is why I could not post yesterday. That however did not mean I didn't learn
Day 41 of my #50DaysOfDataScience challenge! Today, I went a little deeper in Visualizing Categorical and Quantitative Variables! 📊Categorical data is everywhere, especially in surveys. I'm mastering how to use the function catplot() to make plots like:
Day 40 of the #50DaysOfDataScience challenge! It's a day before I start my exams and I spent the day reading. When I finally took sometime to do some DataCamp practice I was reminded of how fast time moves. Showing up has been hard sometimes but oh so rewarding. #LearningInPublic
Day 12 of #50DaysOfDataScience! Today, I was taking a leap from knowing what happened to predicting what might happen. Probability is the language of uncertainty. Once you understand it, you'll see the world through a new lens.
Day 11 of #50DaysOfDataScience! Summary Statistics. Think of a huge book with millions of words. You don't have time to read every single one, so you look at the table of contents, chapter summaries and key quotes to get the gist.
Day 31 in the #50DaysOfDataScience challenge! I read, knowing how much knowledge is lying around if only we took the time to read. A worthy read from DataCamp. One statement stood out and I want to share it "AI adoption is here, but responsible, effective usage depends on skills.
Day 30 complete in the #50DaysOfDataScience challenge! Today's lesson reinforced a vital dashboard rule, always tell a clear story. Cut the visual noise and only keep what drives the user to an insight or action. Ask does this visual element serve the narrative?
Day 44 of my #50DaysOfDataScience challenge! Adding to the certifications, that's the post for today. #LearningInPublic
Day 43 of my #50DaysOfDataScience challenge! Today I did the practices of certificates I have already completed that DataCamp offers to reinforce what I learnt and keep my learning streak alive. #LearningInPublic
Day 30 complete in the #50DaysOfDataScience challenge! Today's lesson reinforced a vital dashboard rule, always tell a clear story. Cut the visual noise and only keep what drives the user to an insight or action. Ask does this visual element serve the narrative?
Day 29 of #50DaysOfDataScience! Today I kept my @DataCamp streak going at 130 days by doing quizzes of the topics I already have certificates in. Revisiting concepts I once found challenging is so nice because now I get to see how far I have come.
Day 18 of #50DaysOfDataScience! Today was just about keeping the streak alive because what I'm practicing is phrase 'You can suck but you can't skip'. #LearningInPublic #DataScience

Day 17 of #50DaysOfDataScience! A new tool Power BI is what I was using to master the Art of Data Storytelling! It's not just about the data, it's about who you're presenting it to! I was learning how "The Audience is King" influences every visualization choice.
Day 10 of #50DaysOfDataScience! I did a project that allows me to practice my newly acquired skills, analyzing NYC public school test results to find the city's top math performers. This isn't just about numbers it's about understanding the factors that shape a student's future.

The first certificate is here🎊.Day 9 of #50DaysOfDataScience Merging Time-Series and Ordered Data the fun way! Ever wonder how economists compare GDP growth with stock market trends? Today, we dive into that exact kind of analysis using real data from the city of Chicago
Day 7 of #50DaysOfDataScience is in the bag! Today’s win: Advanced Merging and Concatenating! My data game is stronger now that I know how to use Anti-Joins (to exclude data) and Semi-Joins (to filter data) in pandas. This is how you work efficiently!

Day 6 of #50DaysOfDataScience. I conquered the world of Joins! Seeing Left, Right, Outer and Self Joins click into place with @DataCamp's movie data was really nice. *Left Join: for enriching data and spotting missing info *Self Join: merging a table to itself to compare records

Day 6 of #50DaysOfDataScience. I conquered the world of Joins! Seeing Left, Right, Outer and Self Joins click into place with @DataCamp's movie data was really nice. *Left Join: for enriching data and spotting missing info *Self Join: merging a table to itself to compare records
Day 5 of #50DaysOfDataScience I had a moment of clarity. I was learning everything, which meant I was mastering nothing. Today, I locked in. My focus is now on the goal I set Certification. I'm driving deep into my @DataCamp track and today was all about Data Merging Basics.
Now on a new level! Day 16 of #50DaysOfDataScience I just bagged my SECOND certificate, which means I have met part of my requirements from @Tech4DevHQ for the Women Techsters fellowship! So proud. Today I did the deep dive today into the core of statistical reasoning.

Day 15 of #50DaysOfDataScience! Today, I conquered key concepts in probability distributions. Sampling Distributions: Explored how to visualize the distribution of sample means using histograms. It's the "mean of means" in action.
Something went wrong.
Something went wrong.
United States Trends
- 1. Ferran 18.5K posts
- 2. Sonny Gray 7,869 posts
- 3. Chelsea 342K posts
- 4. Rush Hour 4 12.2K posts
- 5. Godzilla 21.5K posts
- 6. Barca 123K posts
- 7. Red Sox 7,579 posts
- 8. Raising Arizona 1,101 posts
- 9. Happy Thanksgiving 22K posts
- 10. Dick Fitts N/A
- 11. National Treasure 5,884 posts
- 12. 50 Cent 5,276 posts
- 13. Gone in 60 2,177 posts
- 14. Muriel Bowser N/A
- 15. Giolito N/A
- 16. Dirty Diana 1,089 posts
- 17. Brett Ratner 3,707 posts
- 18. Man in the Mirror 1,431 posts
- 19. Clarke 6,585 posts
- 20. Leaving Las Vegas N/A