#btcchart search results


#btc #btcchart 잠깐 반등에 상승이라고 말하기에는 이르겠죠? 📈상승 1) 삼각수렴(4파 조정) 후 상승(5파) - 기간 조정 2) 빠른 상승(5파연장) - 이 경우 7월에 급상승(3파)가능 📉하락 - 55K, 49K 1) 삼각수렴 후 하락 - 기간 조정 2) 빠른 하락(4파ABC조정) - 일시 반등 후 ABC하락

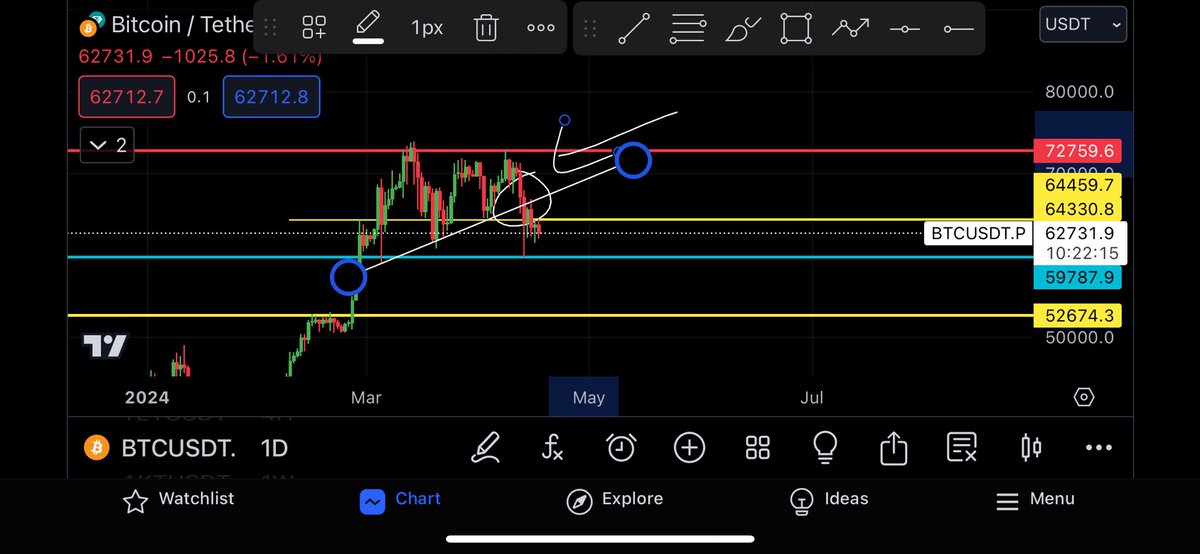
![sincl6's tweet image. [엘리엇파동 관점]
59K 의 저항을 지켜보고
그 아래로 내려 간다면
5파 연장 또는 4파 삼각수렴을 파기해야 할 것 같다.
그때는
4파 ABC 조정의 관점으로 보고
55K 부근에서 상승을 기대해봐야겠다.
#BTC #비트코인](https://pbs.twimg.com/media/GQzFmByaEAAUIm0.jpg)


BTC has aligned with my plan from six days ago. I expect a retracement before any attempt to break the diagonal resistance—confirmation from buyers would strengthen the bullish case. #BTCUSDT #btcchart


BTC 30 Sept idea vs How its going now. See you at 40k. between 5 & 10 Oct.🏹 💣 #BTC #BTCUSDT #BTCCHART


Still, my target is $72-$78K, and nothing has been changed #BTC is holding the line like a Modafaker 😘 #BTCCHART #BITCOIN #CRYPTO


$BTC #btcchart #BTCUSDT #crypto #charts #fud #fomo we stopped exactly on 0.382 fib support on daily and I noticed possible inverse H&S a while ago, still in play..


PSA for all #Bitcoiners: this is the weekly #BTCchart lest you forget we’re still in a massively #bullishuptrend for #bitcoin. Stay humble, stack harder and remember: the institutions are not your friends! #zoomout #imanobody #bitcorn


Analysis of the #NEARchart! The token rose and broke through the $1.5 level, which is an excellent growth signal. In parallel with this, the situation on the #BTCchart is also excellent and indicates an increase, which in turn will lead to an increase in the #NEAR token!


BTC UPDATE NEED TO CLOSE ABOVE THE TRENDLINE FOR THE BULLISH MOMENTUM IF WE BREAK 59700 ON DAILY CANDLE THEN WE DEFINITELY GOING TO 52-53k ! Follow for more updates !! #btc #btcchart #crypto #BTCHalving #btcupdate

本日行ったプレスリリースについて関係各所に連絡を行った所、しるしコインのチャートがBTCの週足にそっくりだとの指摘を受けました。チャート貼っておきます。 #BTC #BTCchart #Bitcoinchart


BTC is forming decending broadening wedge which is a bullish pattern. If this pattern breaks out with good volume and holds the level of 26300-26500. If all this happens then we can see a good bullish moment in BTC . #BTC #BITCOIN #BTCCHART


$BTC update ★ Btc right now at 27.5k #support at 27k Hope btc will not go down Let's see. Use SL to avoid risk! #btcchart #analaysis #chartanalaysis #btcupdate #marketupdate #tradesignal #safesignal #AFRtradesignal


Bitcoin forms head-and-shoulders pattern per Ali Martinez on Nov 13 2025. Potential right shoulder at $112K before neckline test at $100K could lead to breakdown toward $83K. RSI at 42 neutral with 4.1% volatility over 7 days. #BTCChart #HeadShoulders #PricePattern

Check out this #BTCchart pattern on the 4 hourly timeframe...serious resistance at $106k. If breaks down, $103k will become a support. Boom 💥 next stop will be $110k for a pullback and $115k ahead of #US government reopening 🤗📈 🚨Note; this is not financial advice!


Now prepare yourself for #Bullrun2025 #BTCchart going to huge next leg up @idOS_network @wallchain #BTC #ETH #Crypto #Bullrun #Altseasion


📊 Red candles + volume spike = capitulation! Support $100K fortress, smash $103K for $108K moon. ETH/SOL bleeding harder (-2–4%), but BNB +1.6% holds strong. Reddit polls: $250K year-end or $70K bear trap? React 🚀 bull / 🐻 bear! What’s YOUR Q4 target? 👊 #BTCChart”

Now You can Open long with small Leverage.. In Range now . #BTC #CryptoMarket #BTCchart


📊 BTC 日線警報:多頭努力穩定市場,早盤期貨價格上揚。 10 月 23 日,牛市不滅! #BTCChart #CryptoTrading


#btc #btcchart 잠깐 반등에 상승이라고 말하기에는 이르겠죠? 📈상승 1) 삼각수렴(4파 조정) 후 상승(5파) - 기간 조정 2) 빠른 상승(5파연장) - 이 경우 7월에 급상승(3파)가능 📉하락 - 55K, 49K 1) 삼각수렴 후 하락 - 기간 조정 2) 빠른 하락(4파ABC조정) - 일시 반등 후 ABC하락


These are key lines for #btc Weekly candle has closed under the long term bullish trend and under 200EMA. Short term downtrend forming. $52K likely. Could happen soon, could happen in September. #Bitcoin #BtcChart #Crypto #Cryptocurrency #CryptoInvesting #CryptoInvestor

本日行ったプレスリリースについて関係各所に連絡を行った所、しるしコインのチャートがBTCの週足にそっくりだとの指摘を受けました。チャート貼っておきます。 #BTC #BTCchart #Bitcoinchart
BTC has aligned with my plan from six days ago. I expect a retracement before any attempt to break the diagonal resistance—confirmation from buyers would strengthen the bullish case. #BTCUSDT #btcchart
#BTC #BTCCHART M Formation AKA Double Top The white SMA is the 20 day SMA the Red is the 200 we are under for today is the 4th if we close under it a gain !!

PSA for all #Bitcoiners: this is the weekly #BTCchart lest you forget we’re still in a massively #bullishuptrend for #bitcoin. Stay humble, stack harder and remember: the institutions are not your friends! #zoomout #imanobody #bitcorn
BTC 30 Sept idea vs How its going now. See you at 40k. between 5 & 10 Oct.🏹 💣 #BTC #BTCUSDT #BTCCHART


BTCUSD at a critical area💥 BTCUSD is trading at a resistance area that has turned into support and has become a potential demand area for Bitcoin to rise against USD. Trade here ⬇️⬇️⬇️ one.exness-track.com/a/2yqdeu1f2f Are you buying or selling? #exness #BTCchart

Something went wrong.
Something went wrong.
United States Trends
- 1. #UFC322 131K posts
- 2. Valentina 15.2K posts
- 3. Morales 35.3K posts
- 4. Prates 33.8K posts
- 5. Sark 5,971 posts
- 6. Kirby 18.8K posts
- 7. Georgia 85.7K posts
- 8. Zhang 26.5K posts
- 9. #GoDawgs 9,626 posts
- 10. Leon 74.8K posts
- 11. Ole Miss 12K posts
- 12. Sean Brady 6,660 posts
- 13. Makhachev 35.4K posts
- 14. Arch 22.4K posts
- 15. Dillon Danis 9,170 posts
- 16. Ahmad Hardy 1,250 posts
- 17. Bo Nickal 6,989 posts
- 18. Texas 201K posts
- 19. Bama 22.6K posts
- 20. Gunner Stockton 2,187 posts