#baddatascience ผลการค้นหา


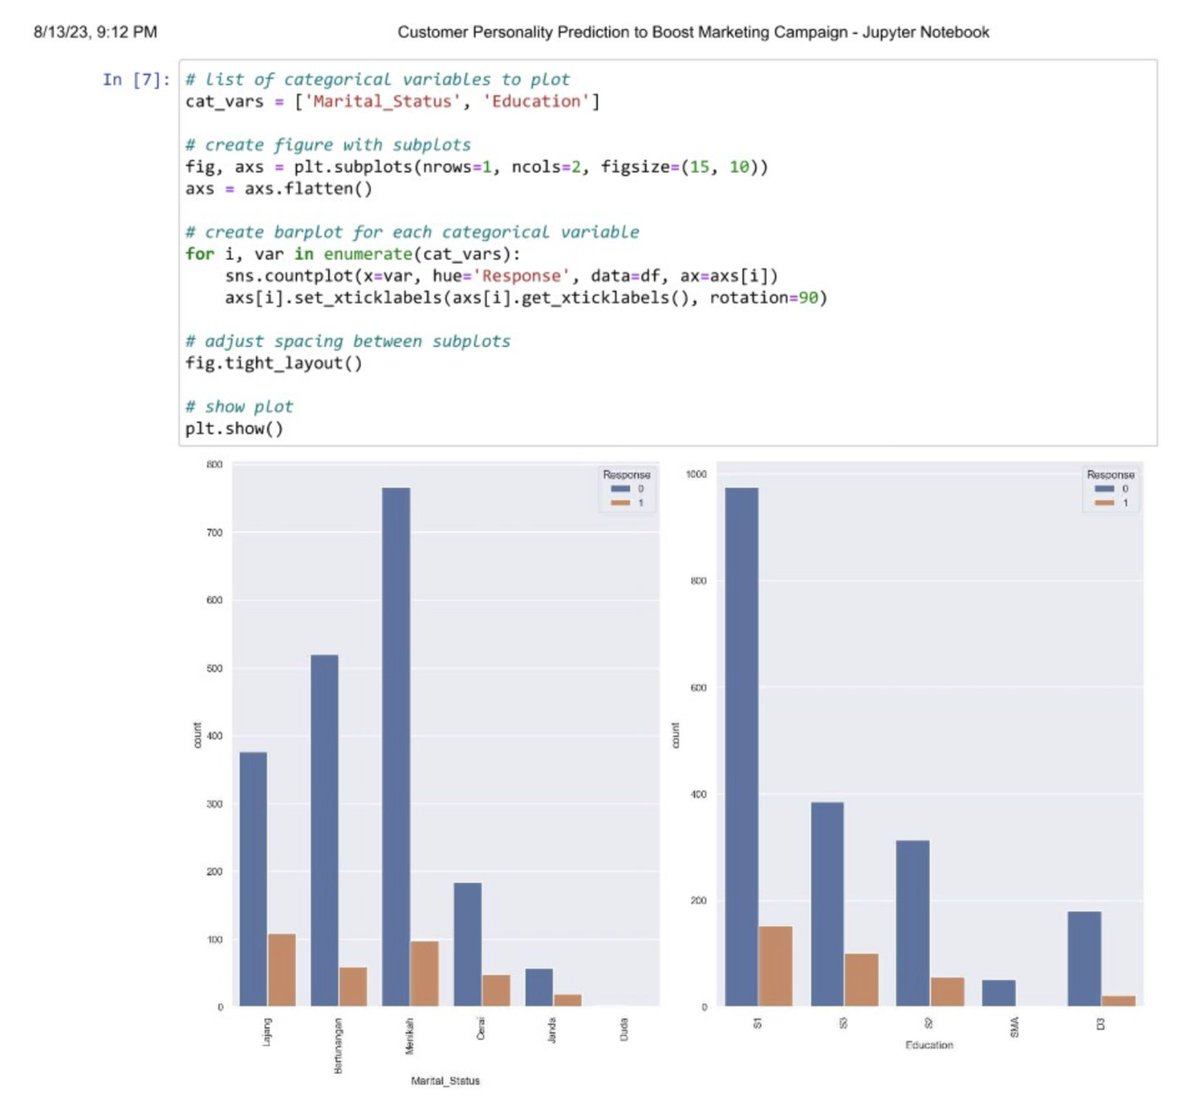
Today, I saw this code on LinkedIn. This person is trying to create a small multiple chart, but is using for loops with Matplotlib subplots. This is a overly-complicated way to do it. There's a better way ... What's the better way? #Python #baddatascience


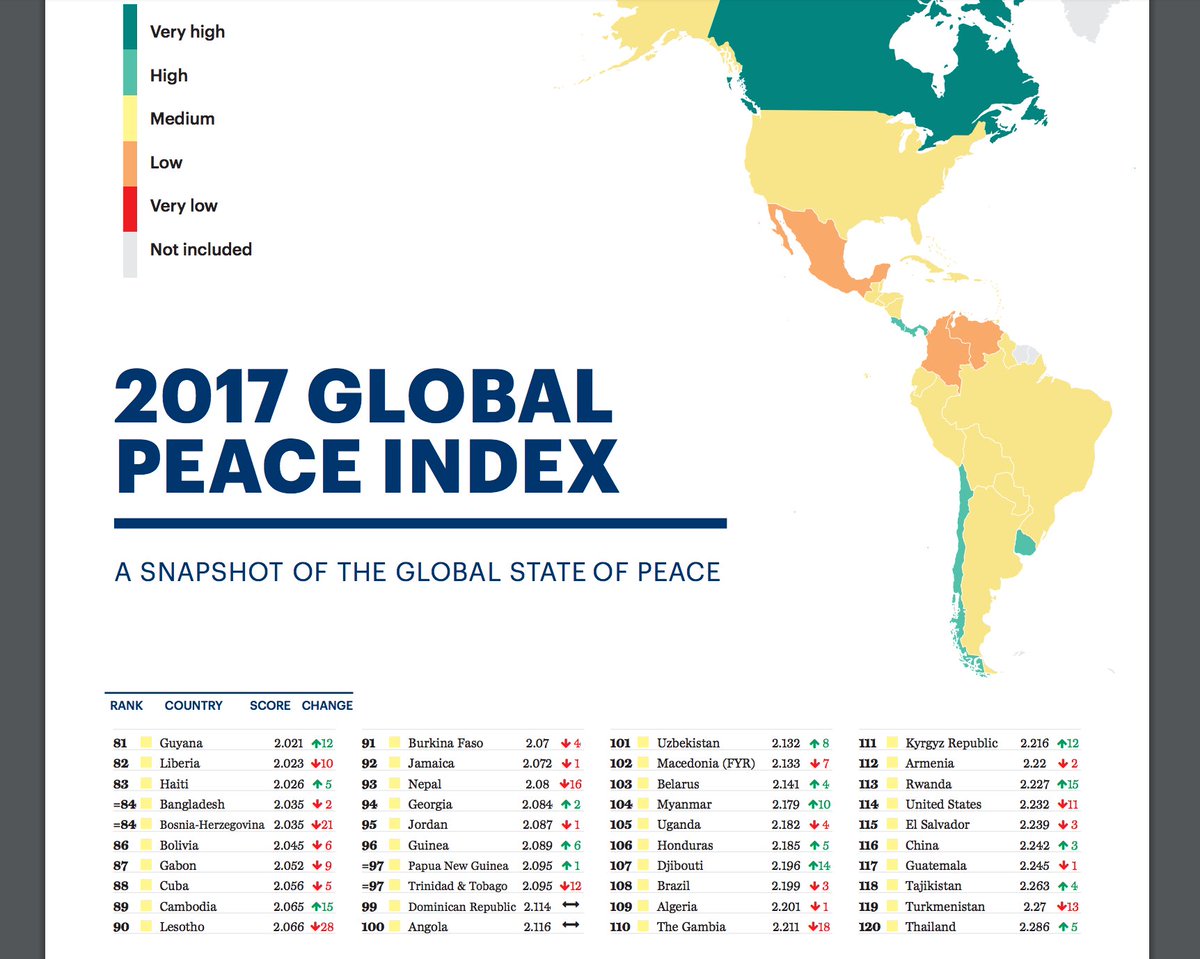
#GlobalPeaceIndex ranks USA 114th most peaceful nation; better move that E54thSt office in NYC IEP! visionofhumanity.org/app/uploads/20… #BadDataScience

Plot twist: Both decisions lead to questionable results in production #DataScienceMemes #MLFails #BadDataScience #TeachableMoments #ModelValidation #DataScientistLife #AIHumor


.@YouTube's recommendation system is getting dumber every day. Do you use the same data science team as @indeed? #baddatascience


What am I sick of? So, so many people justifying their hiring of only white men, or of hosting events, making projects, building communities that are only welcoming to white men — and then saying, well 85%. Can’t help it. No one else is around. Pipeline problem. #baddatascience

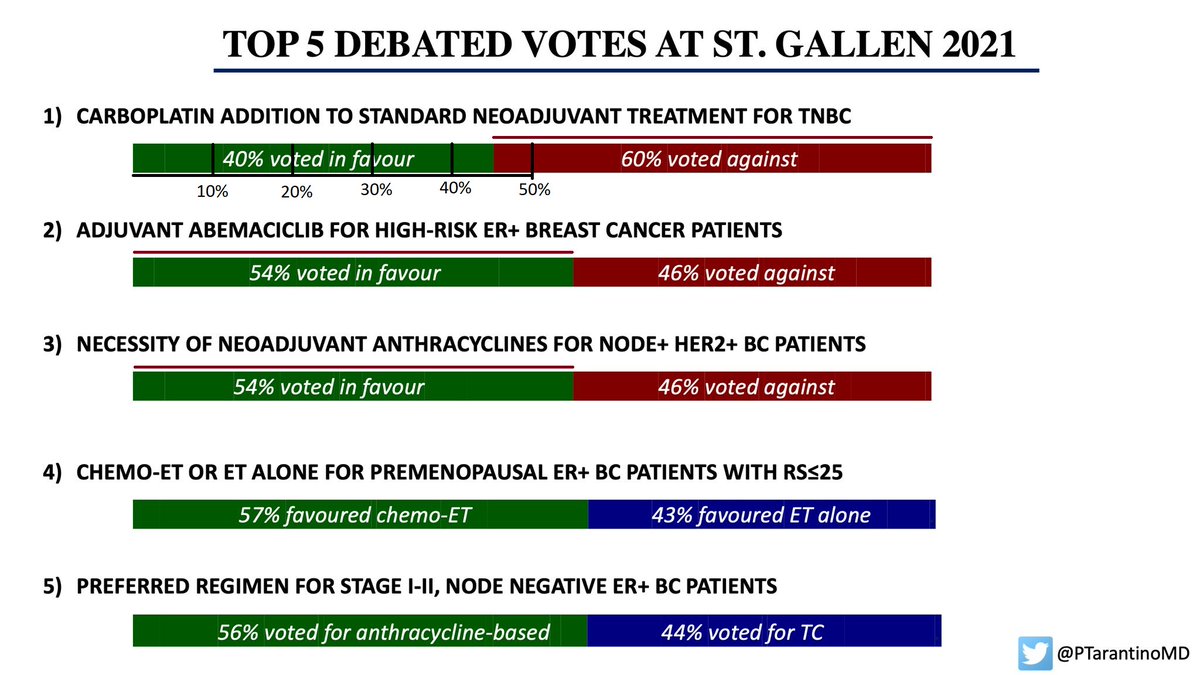
Classic example of distorted chart with a clear bias to favorable vote. Green bar #1 of 40% has the actual length of 45%. Green bars 2) and 3) of 54% has the length of 60%. #BadDataScience guys ...

Business requirements meets data science constraints #baddatascience

I'm shocked, shocked to find that all the focus on consumer fingerprint reading was on avoiding false negatives.

"Anecdotally, I've heard.." is a euphemism for "I recognize the availability bias is strong here but I'm still gonna make this point anyway." #baddatascience

Just for the record @LinkedIn, I am not @sriramk. I am not @sriramkri either. #BadDataScience

In my head mason lives eternally being screamed at by senior generals about the meaning of macguffins, #BADDATASCIENCE

This algorithm looks at how much a person spends on healthcare instead of looking at the reason why the person is in the hospital? #baddatascience Blame it on the algorithm...but actually #SkimmLife theskimm.com/2019/10/24/ski… via @theSkimm

My phone keeps recommending me football matches even tho I've never shown any interest in any. Is it just coz I'm male? #baddatascience

@InsightBrief @drvickip @2morrowknight I can tell you from reading the results, your questions skewed the answers. #BadDataScience

WHY IS ONE PARAMETER VISUALIZED IN TWO DIMENSIONS??????? #badDataScience #DataIsUgly #unnecessarilyConfusing

Reading through COVID mispredictions like the housing market crash(It's soaring higher than ever #littlescary) or the Eviction wave #Baddatascience shows me that you gotta check how hot the source maker is. #Aspensabitspicy #Leaninistoospicy #Heritageisonfire

Out by a factor of 10 because I mistook a fleck on the screen for a decimal point. #baddatascience #schoolboyerror #statisticalerror #error
Plot twist: Both decisions lead to questionable results in production #DataScienceMemes #MLFails #BadDataScience #TeachableMoments #ModelValidation #DataScientistLife #AIHumor
Today, I saw this code on LinkedIn. This person is trying to create a small multiple chart, but is using for loops with Matplotlib subplots. This is a overly-complicated way to do it. There's a better way ... What's the better way? #Python #baddatascience


Some economist also put out a study that said women's skirt lengths affected prices. #baddatascience

Not just bullying? What weather maps? Sunny day in London? Does it cover the commuters from St Albans or Nuneaton? Or is there any evidence that commuters would rather avoid a rainy day than a sunny one? How do you factor in annual leave in this model? #BadDataScience
Reading through COVID mispredictions like the housing market crash(It's soaring higher than ever #littlescary) or the Eviction wave #Baddatascience shows me that you gotta check how hot the source maker is. #Aspensabitspicy #Leaninistoospicy #Heritageisonfire
In my head mason lives eternally being screamed at by senior generals about the meaning of macguffins, #BADDATASCIENCE
I COMPLETELY agree! That is the fundemental problem a core belief in the sanctity and authority of the numbers without learning the methodology behind the numbers #Baddatascience
Classic example of distorted chart with a clear bias to favorable vote. Green bar #1 of 40% has the actual length of 45%. Green bars 2) and 3) of 54% has the length of 60%. #BadDataScience guys ...

Could it be the changed how much #baddatascience they were using before? Or it could be natural #herdimmunity is not being suppressed as much as it was last week. I wonder if flattening the curve will kill more than... youtu.be/_41qqhjY3GI
"Anecdotally, I've heard.." is a euphemism for "I recognize the availability bias is strong here but I'm still gonna make this point anyway." #baddatascience

LOL @HUTechTweets "80% percent accuracy and with no racial bias" as if racial bias is the only thing biasef in your test set #BadDataScience #nope. This is dangerous pseudoscience, please stop making the world an insane dystopia harrisburgu.edu/hu-facial-reco…
This algorithm looks at how much a person spends on healthcare instead of looking at the reason why the person is in the hospital? #baddatascience Blame it on the algorithm...but actually #SkimmLife theskimm.com/2019/10/24/ski… via @theSkimm
WHY IS ONE PARAMETER VISUALIZED IN TWO DIMENSIONS??????? #badDataScience #DataIsUgly #unnecessarilyConfusing
What am I sick of? So, so many people justifying their hiring of only white men, or of hosting events, making projects, building communities that are only welcoming to white men — and then saying, well 85%. Can’t help it. No one else is around. Pipeline problem. #baddatascience

Ah, @Dexcom: where their approach to the algorithm (more data = worse calibration; therefore withhold data) appears to mirror their approach to #techsupport & #custservice (more info = worse outcomes; therefore withhold info). #baddatascience #T1D #CGM #failedsensors #nosleep

The naive classifier for predicting whether a person who is also a top Trump campaign official gets indicted probably has better real-world performance than whatever model is being abused below to imagine caravan figures. #BadDataScience

Stop The Caravan! This is about being a nation of laws. You must enter our country LEGALLY. When will it be enough? When the caravan is 100K, 500K, 2MM in size?

The longer I look at it the less sense it makes #BadDataScience #CursedGraphs #AI #ML #DataScience (Thanks/Damn you @glenndavidson)

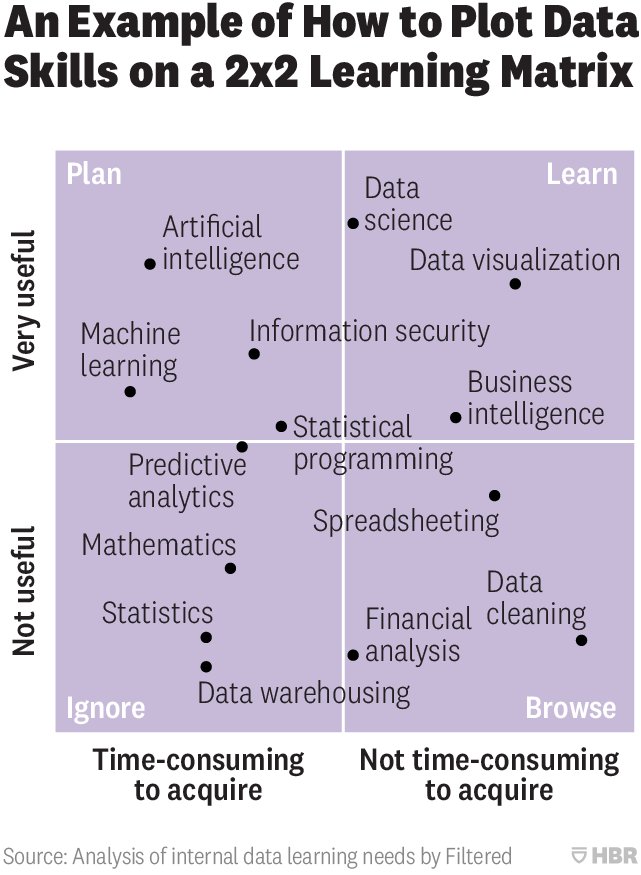
This Harvard Business Review chart seems to have been made by someone who didn't know what most of the terms meant: hbr.org/2018/10/which-…

Here's what I'm doing tonight: Trying to replicate this work. I doubt I will be able to. #BadDataScience medium.com/activewizards-…

#GlobalPeaceIndex ranks USA 114th most peaceful nation; better move that E54thSt office in NYC IEP! visionofhumanity.org/app/uploads/20… #BadDataScience
Today, I saw this code on LinkedIn. This person is trying to create a small multiple chart, but is using for loops with Matplotlib subplots. This is a overly-complicated way to do it. There's a better way ... What's the better way? #Python #baddatascience
Plot twist: Both decisions lead to questionable results in production #DataScienceMemes #MLFails #BadDataScience #TeachableMoments #ModelValidation #DataScientistLife #AIHumor
Classic example of distorted chart with a clear bias to favorable vote. Green bar #1 of 40% has the actual length of 45%. Green bars 2) and 3) of 54% has the length of 60%. #BadDataScience guys ...
Something went wrong.
Something went wrong.
United States Trends
- 1. Good Wednesday 23.4K posts
- 2. #hazbinhotelseason2 71.1K posts
- 3. Hump Day 8,306 posts
- 4. #wednesdaymotivation 5,138 posts
- 5. Peggy 21.3K posts
- 6. Abel 14.5K posts
- 7. #InternationalMensDay 30.1K posts
- 8. Dearborn 263K posts
- 9. LeBron 91.6K posts
- 10. Kwara 197K posts
- 11. Baxter 2,763 posts
- 12. Nigerians 143K posts
- 13. #RadioStatic 15.6K posts
- 14. #huskerdust 19K posts
- 15. Grayson 7,403 posts
- 16. Tinubu 162K posts
- 17. Cory Mills 11.8K posts
- 18. Sewing 5,480 posts
- 19. Whitney 16.8K posts
- 20. MC - 13 1,188 posts