#censusecondata 搜尋結果

Enjoy some data with your morning cup of joe this #NationalCoffeeDay! ☕ #CensusEconData show there were 1,102 coffee and tea manufacturing establishments in the U.S. in 2022. Explore more from the #EconCensus. census.gov/programs-surve…
Contrary to conventional wisdom, adoption of technology, including AI, did not change overall worker numbers, according to our 2023 Annual Business Survey. Read more about the impact of technology on U.S. businesses on #AmericaCounts. census.gov/library/storie… #CensusEconData

August end-of-month wholesale inventories were $905.2 billion, down 0.2% from July 2025. Learn more: census.gov/econ/indicator… #CensusEconData #AdvanceWholesaleInventories

Sharing all finances is no longer the norm for married couples.💍 The share of couples without any joint bank accounts rose by more than half, from 15% in 1996 to 23% in 2023. Why? Read more on #AmericaCounts. census.gov/library/storie… #CensusEconData

The 2025 Q3 Job-to-Job Flows release is now available. Explore statistics on hires and separations to and from employment in the United States, with a focus on worker reallocation across employers. ➡️ lehd.ces.census.gov/data/#j2j #CensusEconData #J2J

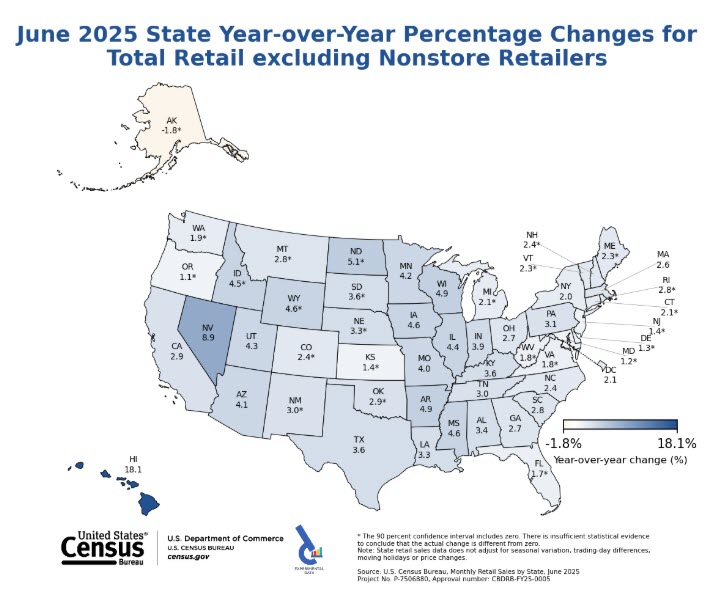
🛍️ June 2025 monthly state-level retail sales are now available. census.gov/retail/state_r… #CensusEconData #MSRS #MonthlyStateRetailSales #RetailSales
Sales of new single-family houses in August 2025 were at a seasonally adjusted annual rate of 800,000. This is 20.5% above the revised July 2025 estimate of 664,000. 🏠 census.gov/construction/n… #CensusEconData #NewResidentialSales

Watch our new #DataGem video to learn how to use our economic indicators and #DataTools to get a front-row seat to the nation’s economic trends. ▶️ census.gov/data/academy/d… #CensusEconData

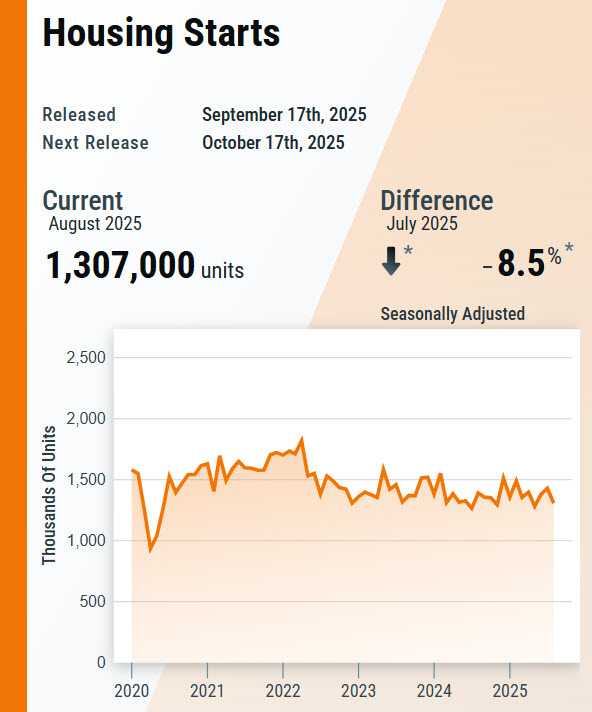
Privately-owned #HousingStarts in August 2025 were at a seasonally adjusted annual rate of 1,307,000. This is 8.5% below the revised July 2025 estimate of 1,429,000. 🏠 census.gov/construction/n… #CensusEconData #ResidentialConstruction
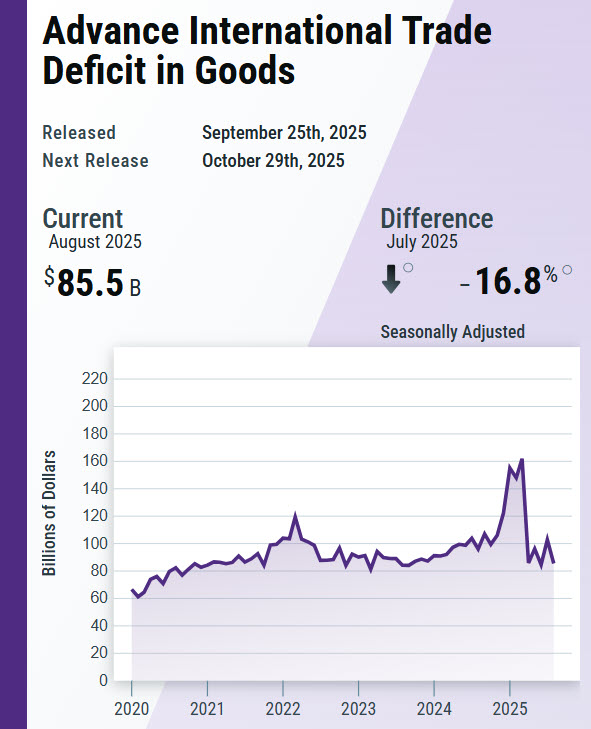
The advance international trade deficit in goods decreased to $85.5 billion in August from $102.8 billion in July as imports decreased more than exports. Learn more: census.gov/econ/indicator… #CensusEconData #AdvanceInternationalTradeGoods
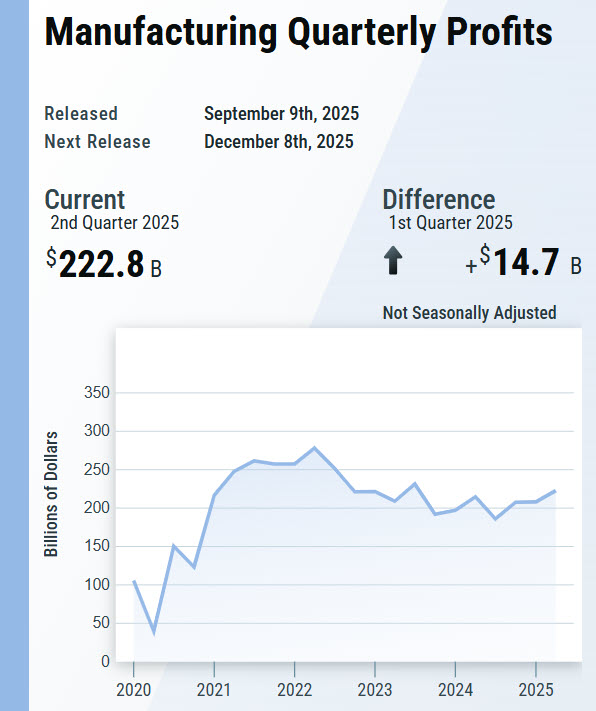
#Manufacturing corporations' not seasonally adjusted after-tax profits were $222.8 billion for the second quarter of 2025, up $14.7 billion from the first quarter of 2025. census.gov/econ/qfr/mmws/… #CensusEconData
August 2025 end-of-month retail inventories were $809.4 billion, virtually unchanged from July 2025. Learn more: census.gov/econ/indicator… #CensusEconData #AdvanceRetailInventories

New 2023 Business Dynamics Statistics are live in BDS Explorer! 📈 In 2023, startup job creation in the Healthcare and Social Assistance sector increased to 335,287, its highest level since 2002. Get more BDS data insights: bds.explorer.ces.census.gov #CensusEconData
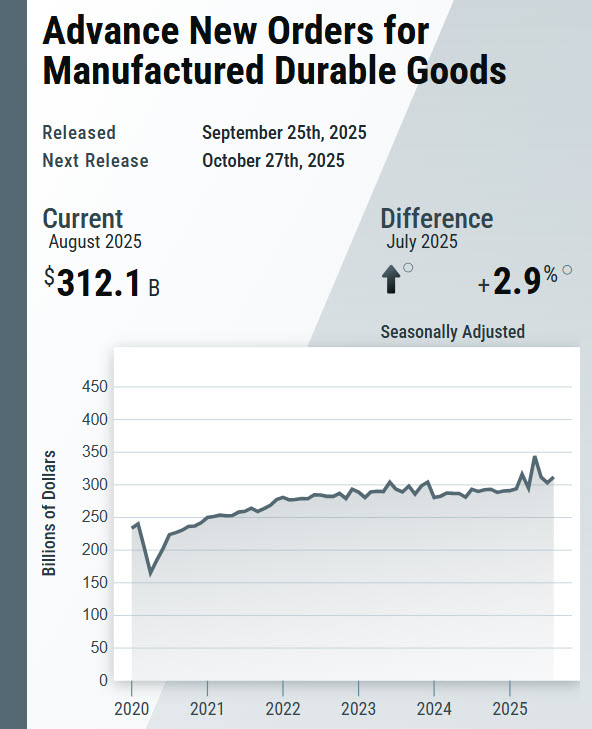
New orders for manufactured #DurableGoods in August, up following two consecutive monthly decreases, increased $8.9 billion or 2.9% to $312.1 billion. Learn more: census.gov/manufacturing/… #CensusEconData #Manufacturing
U.S. retail and food services sales for August 2025 were $732.0 billion, an increase of 0.6% from July 2025. census.gov/retail/sales.h… #CensusEconData #RetailSales

July 2025 sales of merchant #wholesalers were $711.3 billion, up 1.4% from June. End-of-month inventories were $908.1 billion, up 0.1% from June. census.gov/wholesale/curr… #CensusEconData #Wholesale


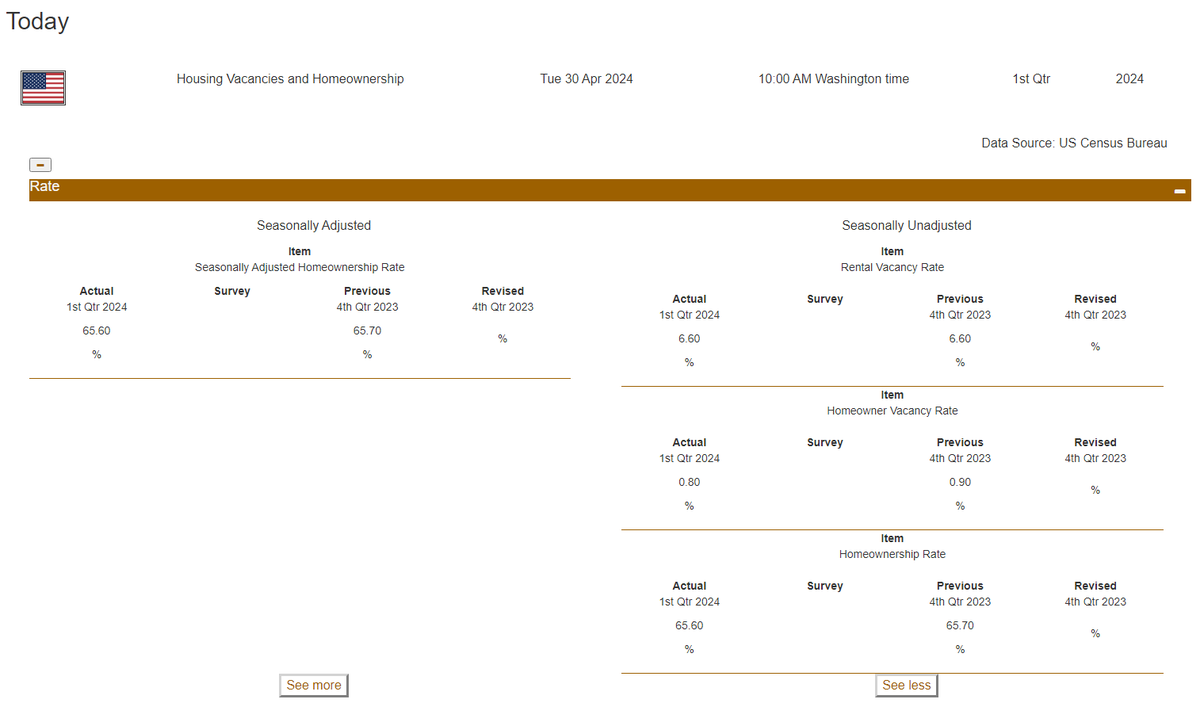
Rental Vacancy Rate The rental vacancy rate of 6.6 percent was not statistically different than the rate in the 1Q23 (6.4 percent). 1st Qtr 2024: +6.6* Percent 1st Qtr 2023: +6.4 Percent Source: US #Census Bureau #CensusEconData
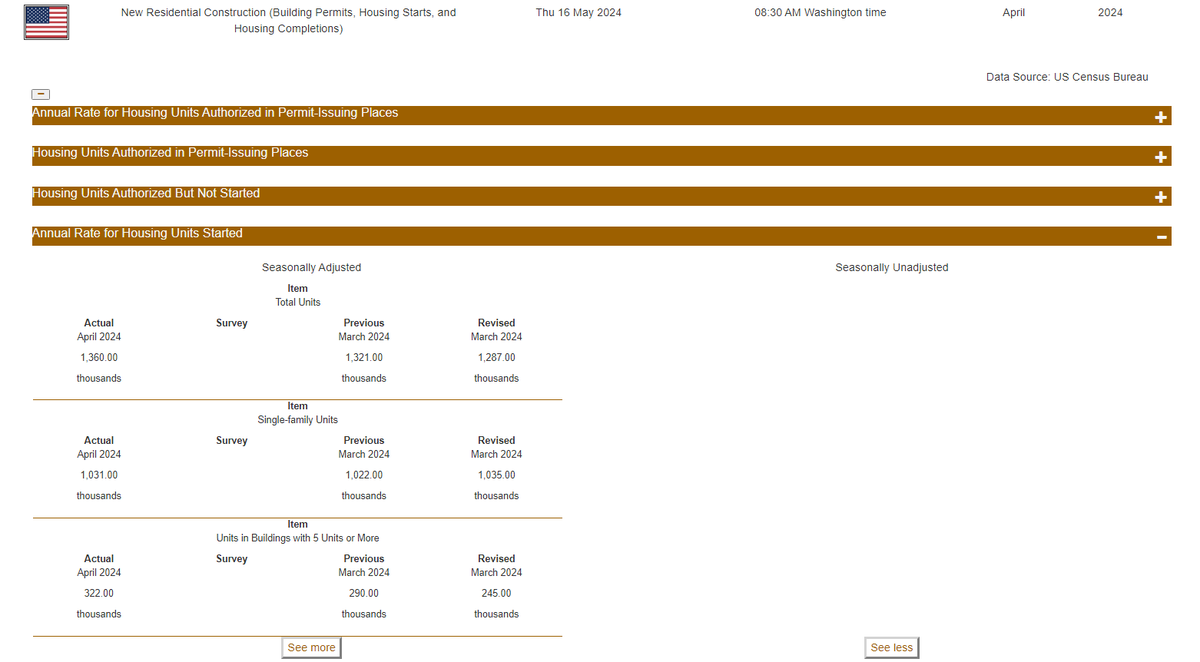
New Residential Construction Privately-owned housing starts in Apr4 were at a seasonally adjusted annual rate of 1,360,000. This is 5.7% above the revised Mar24 estimate of 1,287,000. Apr24: +5.7* % Change Mar24 (r): -16.8 % Change Source: US #Census Bureau #CensusEconData
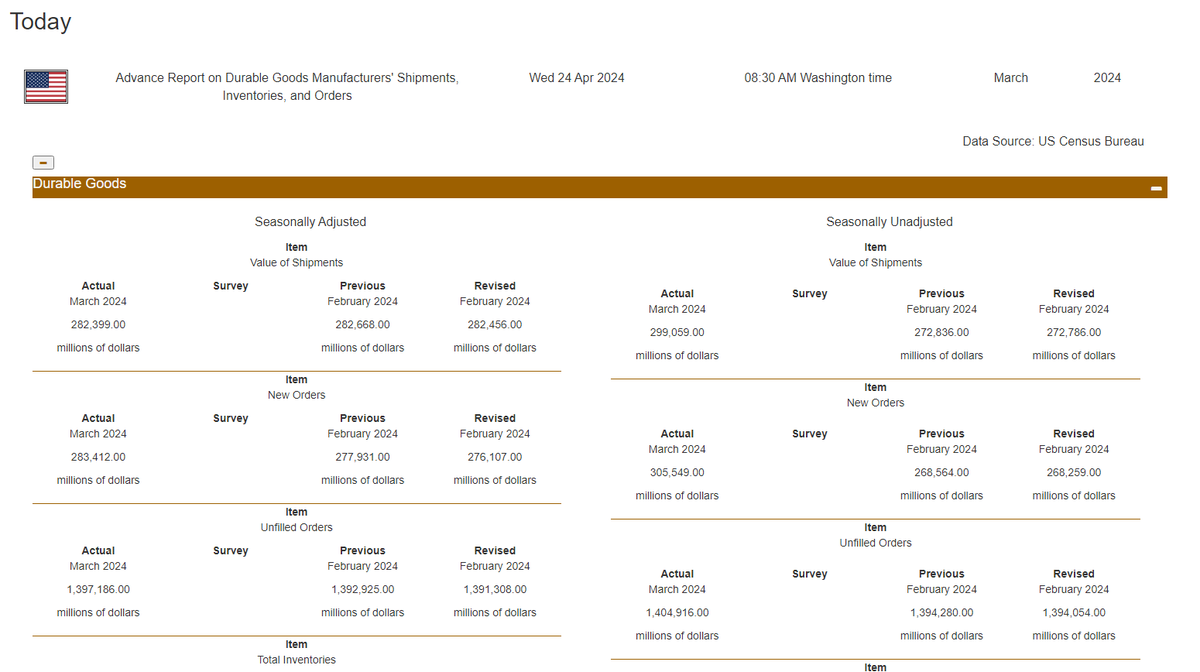
Advance Monthly Manufacturers' Shipments, Inventories, and Orders New orders for manufactured durable goods in March, up two consecutive months, increased $7.3B or 2.6% to $283.4B. Mar24: +2.6° % Change Feb24 (r): +0.7° % Change Source: US #Census Bureau #CensusEconData
U.S. selected services total revenue for the second quarter of 2025 (seasonally adjusted) was $5,965.2 billion, an increase of 2.2% from the first quarter of 2025 and up 6.4% from the second quarter of 2024. census.gov/services/curre… #CensusEconData

🛍️ June 2025 monthly state-level retail sales are now available. census.gov/retail/state_r… #CensusEconData #MSRS #MonthlyStateRetailSales #RetailSales
Enjoy some data with your morning cup of joe this #NationalCoffeeDay! ☕ #CensusEconData show there were 1,102 coffee and tea manufacturing establishments in the U.S. in 2022. Explore more from the #EconCensus. census.gov/programs-surve…
The 2025 Q3 Job-to-Job Flows release is now available. Explore statistics on hires and separations to and from employment in the United States, with a focus on worker reallocation across employers. ➡️ lehd.ces.census.gov/data/#j2j #CensusEconData #J2J
New 2023 Business Dynamics Statistics are live in BDS Explorer! 📈 In 2023, startup job creation in the Healthcare and Social Assistance sector increased to 335,287, its highest level since 2002. Get more BDS data insights: bds.explorer.ces.census.gov #CensusEconData
New orders for manufactured #DurableGoods in August, up following two consecutive monthly decreases, increased $8.9 billion or 2.9% to $312.1 billion. Learn more: census.gov/manufacturing/… #CensusEconData #Manufacturing
The advance international trade deficit in goods decreased to $85.5 billion in August from $102.8 billion in July as imports decreased more than exports. Learn more: census.gov/econ/indicator… #CensusEconData #AdvanceInternationalTradeGoods
August end-of-month wholesale inventories were $905.2 billion, down 0.2% from July 2025. Learn more: census.gov/econ/indicator… #CensusEconData #AdvanceWholesaleInventories
August 2025 end-of-month retail inventories were $809.4 billion, virtually unchanged from July 2025. Learn more: census.gov/econ/indicator… #CensusEconData #AdvanceRetailInventories
Sharing all finances is no longer the norm for married couples.💍 The share of couples without any joint bank accounts rose by more than half, from 15% in 1996 to 23% in 2023. Why? Read more on #AmericaCounts. census.gov/library/storie… #CensusEconData
Sales of new single-family houses in August 2025 were at a seasonally adjusted annual rate of 800,000. This is 20.5% above the revised July 2025 estimate of 664,000. 🏠 census.gov/construction/n… #CensusEconData #NewResidentialSales
Watch our new #DataGem video to learn how to use our economic indicators and #DataTools to get a front-row seat to the nation’s economic trends. ▶️ census.gov/data/academy/d… #CensusEconData
Contrary to conventional wisdom, adoption of technology, including AI, did not change overall worker numbers, according to our 2023 Annual Business Survey. Read more about the impact of technology on U.S. businesses on #AmericaCounts. census.gov/library/storie… #CensusEconData
Privately-owned #HousingStarts in August 2025 were at a seasonally adjusted annual rate of 1,307,000. This is 8.5% below the revised July 2025 estimate of 1,429,000. 🏠 census.gov/construction/n… #CensusEconData #ResidentialConstruction
U.S. total business end-of-month inventories for July 2025 were $2,666.7 billion, up 0.2% from June 2025. U.S. total business sales were $1,948.2 billion, up 1.0% from June 2025. census.gov/mtis/current/i… #CensusEconData #BusinessInventories
U.S. retail and food services sales for August 2025 were $732.0 billion, an increase of 0.6% from July 2025. census.gov/retail/sales.h… #CensusEconData #RetailSales
Our second quarter summary of state and local government #tax revenue for 2025 is now available. ➡️ Total state taxes in the U.S. for Q2 2025 were 6.7% higher than Q2 2024. census.gov/data/tables/20… #CensusEconData #TaxRevenue
U.S. selected services total revenue for the second quarter of 2025 (seasonally adjusted) was $5,965.2 billion, an increase of 2.2% from the first quarter of 2025 and up 6.4% from the second quarter of 2024. census.gov/services/curre… #CensusEconData
Total U.S. #BusinessApplications were 473,679 in August 2025, up 0.5% from July 2025. Learn more: census.gov/econ/bfs/curre… #CensusEconData

July 2025 sales of merchant #wholesalers were $711.3 billion, up 1.4% from June. End-of-month inventories were $908.1 billion, up 0.1% from June. census.gov/wholesale/curr… #CensusEconData #Wholesale
#Manufacturing corporations' not seasonally adjusted after-tax profits were $222.8 billion for the second quarter of 2025, up $14.7 billion from the first quarter of 2025. census.gov/econ/qfr/mmws/… #CensusEconData
August end-of-month wholesale inventories were $905.2 billion, down 0.2% from July 2025. Learn more: census.gov/econ/indicator… #CensusEconData #AdvanceWholesaleInventories
The 2025 Q3 Job-to-Job Flows release is now available. Explore statistics on hires and separations to and from employment in the United States, with a focus on worker reallocation across employers. ➡️ lehd.ces.census.gov/data/#j2j #CensusEconData #J2J
Sharing all finances is no longer the norm for married couples.💍 The share of couples without any joint bank accounts rose by more than half, from 15% in 1996 to 23% in 2023. Why? Read more on #AmericaCounts. census.gov/library/storie… #CensusEconData
Contrary to conventional wisdom, adoption of technology, including AI, did not change overall worker numbers, according to our 2023 Annual Business Survey. Read more about the impact of technology on U.S. businesses on #AmericaCounts. census.gov/library/storie… #CensusEconData
🛍️ June 2025 monthly state-level retail sales are now available. census.gov/retail/state_r… #CensusEconData #MSRS #MonthlyStateRetailSales #RetailSales
Privately-owned #HousingStarts in August 2025 were at a seasonally adjusted annual rate of 1,307,000. This is 8.5% below the revised July 2025 estimate of 1,429,000. 🏠 census.gov/construction/n… #CensusEconData #ResidentialConstruction
Sales of new single-family houses in August 2025 were at a seasonally adjusted annual rate of 800,000. This is 20.5% above the revised July 2025 estimate of 664,000. 🏠 census.gov/construction/n… #CensusEconData #NewResidentialSales
New orders for manufactured #DurableGoods in August, up following two consecutive monthly decreases, increased $8.9 billion or 2.9% to $312.1 billion. Learn more: census.gov/manufacturing/… #CensusEconData #Manufacturing
The advance international trade deficit in goods decreased to $85.5 billion in August from $102.8 billion in July as imports decreased more than exports. Learn more: census.gov/econ/indicator… #CensusEconData #AdvanceInternationalTradeGoods
July 2025 sales of merchant #wholesalers were $711.3 billion, up 1.4% from June. End-of-month inventories were $908.1 billion, up 0.1% from June. census.gov/wholesale/curr… #CensusEconData #Wholesale
Not seasonally adjusted after-tax profits for #retail corporations with assets of $50 million and over were $59.8 billion for the second quarter of 2025, up $15.1 billion from the first quarter of 2025. census.gov/econ/qfr/retai… #CensusEconData

Explore new #CensusEconData highlights by region from our Annual Integrated Economic Survey. Next up: The Midwest. Learn more about the region with our #infographic. 🔍 census.gov/library/visual…

#Manufacturing corporations' not seasonally adjusted after-tax profits were $222.8 billion for the second quarter of 2025, up $14.7 billion from the first quarter of 2025. census.gov/econ/qfr/mmws/… #CensusEconData
August 2025 end-of-month retail inventories were $809.4 billion, virtually unchanged from July 2025. Learn more: census.gov/econ/indicator… #CensusEconData #AdvanceRetailInventories
Watch our new #DataGem video to learn how to use our economic indicators and #DataTools to get a front-row seat to the nation’s economic trends. ▶️ census.gov/data/academy/d… #CensusEconData
Rental Vacancy Rate The rental vacancy rate of 6.6 percent was not statistically different than the rate in the 1Q23 (6.4 percent). 1st Qtr 2024: +6.6* Percent 1st Qtr 2023: +6.4 Percent Source: US #Census Bureau #CensusEconData
New Residential Construction Privately-owned housing starts in Apr4 were at a seasonally adjusted annual rate of 1,360,000. This is 5.7% above the revised Mar24 estimate of 1,287,000. Apr24: +5.7* % Change Mar24 (r): -16.8 % Change Source: US #Census Bureau #CensusEconData
Advance Monthly Manufacturers' Shipments, Inventories, and Orders New orders for manufactured durable goods in March, up two consecutive months, increased $7.3B or 2.6% to $283.4B. Mar24: +2.6° % Change Feb24 (r): +0.7° % Change Source: US #Census Bureau #CensusEconData
U.S. selected services total revenue for the second quarter of 2025 (seasonally adjusted) was $5,965.2 billion, an increase of 2.2% from the first quarter of 2025 and up 6.4% from the second quarter of 2024. census.gov/services/curre… #CensusEconData

The Fed has opted for 50 bp rate cut. What to expect next? Check the new economic projections and rate forecast now: j.moomoo.com/01nqqY #september #CensusEconData #RetailSales #CPI #BLS #sp500 #russell2000 #ratecut #fomc #Fed #moomoo #wallstreet #nasdaq #nyse #DowJones…


Something went wrong.
Something went wrong.
United States Trends
- 1. Chiefs 83.4K posts
- 2. Brian Branch 2,442 posts
- 3. #TNABoundForGlory 41K posts
- 4. #LoveCabin N/A
- 5. Mahomes 23.4K posts
- 6. LaPorta 9,429 posts
- 7. Goff 12.4K posts
- 8. Bryce Miller 3,529 posts
- 9. #OnePride 5,882 posts
- 10. Kelce 13.3K posts
- 11. Butker 7,943 posts
- 12. #DETvsKC 4,223 posts
- 13. #ALCS 9,606 posts
- 14. Baker 50.5K posts
- 15. Gibbs 5,370 posts
- 16. Dan Campbell 2,241 posts
- 17. Collinsworth 2,446 posts
- 18. Pacheco 4,534 posts
- 19. Tyquan Thornton 1,108 posts
- 20. Mike Santana 2,685 posts