#codeprofiling Suchergebnisse

The sprite flickering routine in #TecmoSuperbowl uses ~ 10-13% of the available CPU time per frame. #codeprofiling #nesdev #lua #fceux


@mattwatson81's webinar is tomorrow. Sign up! #developers #CodeProfiling #ItCountsAsWork attendee.gotowebinar.com/register/65432…


🚀Uncover the power of cProfile for optimizing your Python code. 🐍#Python #CodeProfiling 👉 amitk.io/python-code-pr…

Profiling your C++ code is essential in HFT. Identify and eliminate performance bottlenecks to stay ahead in the game. #CodeProfiling #PerformanceEnhancement

🚀 New blog post: 'Minimizing Overhead in Xojo Applications' Learn to: - Identify performance bottlenecks - Master Xojo's Profiler tool - Optimize code efficiency 🔍 blog.xojo.com/2024/07/10/min… Insights provided by Xojo MVP Martin T. #CodeProfiling #PerformanceOptimization
Streamline your development process with #Prefix by Stackify! Dive into real-time code profiling and optimize your app's performance effortlessly. Get your free demo today: hubs.ly/Q02rPkWg0 #DevTools #CodeProfiling #OptimizePerformance


I am looking for some good #codeProfiling tools. I know #EclipseProfiler. Any other suggestions would be helpful..

Use code profiling tools like Blackfire or Xdebug to identify and optimize performance bottlenecks in your code. This improves the overall performance of your application. ⚡ #codeprofiling #Blackfire #Xdebug #100DaysOfCode #buildinpublic

"Profiling: the obvious step after Benchmarking your Ruby code." by @JulioAnoveros hackernoon.com/profiling-the-… #cleanruby #codeprofiling
Use code profiling tools like VisualVM and Xdebug to identify performance bottlenecks and optimize your code. They provide insights into code execution and resource usage. 🕵️♂️ #codeprofiling #performanceoptimization #100DaysOfCode #buildinpublic

what should happen or what does happen?how to write unittests for legacy code #CodeProfiling #devops bit.ly/1YIjyqW #unitest #test

Click and Span: How to Optimize with Code Profiling bit.ly/3QIILRn @swesmason @splunk #Sponsored #coding #CodeProfiling


How can #codeprofiling benefit your team? ✅ Shortens your SDLC ✅ Ensures high application performance ✅ Improves end-user experience Learn more about code profiling, from methods of profiling code to choosing a profiling tool, in this blog: bit.ly/3KkryeU

Discover the power of lazy loading in reducing initial load times and optimizing resource usage, helping your website perform at its best anastasionico.uk/blog/make-your… #LazyLoading #CodeProfiling #WebsitePerformance #Optimization #PageLoadSpeed #UserExperience #ResourceOptimization

7. #CodeProfiling araçlarıyla performans testi sırasında kod performansını da ölçebiliyoruz #testtalks

Use code profiling tools to identify performance bottlenecks and optimize your code. 🚦🔧 #CodeProfiling #CodingTips #BestPractices

#QuickTip Profile your code: Utilize profiling tools to identify bottlenecks and hotspots in your code, allowing you to focus on areas that require optimization. #CodeProfiling #PerformanceAnalysis

What is code profiling? quora.com/What-is-code-p… #codeprofiling #softwaredevelopment
quora.com
What is code profiling?
Shikha Singh's answer: Code profiling examines the application code to ensure it is optimized, resulting in high application performance. It analyzes the memory, CPU, and network utilized by each...

Code Profiling and Performance Optimization of an Existing PHP Project #PHP #CodeProfiling #PerformanceOptimization #CodeEfficiency #WebPerformance #APM #DatabaseOptimization #XDebug #PHPBench #OptimizationTips #Refactoring #ProfilingTools peoplesblog.co.in/articles/code-…


Want to boost your app's speed? Start with code profiling! Read more <linkedin.com/feed/update/ur…> #CodeOptimization #CodeProfiling #SoftwareDevelopment #Coding #CodePerformance #OptimizeYourCode #ProgrammingEfficiency #SoftwareEngineering #AppPerformance #unibench

🚀 New blog post: 'Minimizing Overhead in Xojo Applications' Learn to: - Identify performance bottlenecks - Master Xojo's Profiler tool - Optimize code efficiency 🔍 blog.xojo.com/2024/07/10/min… Insights provided by Xojo MVP Martin T. #CodeProfiling #PerformanceOptimization

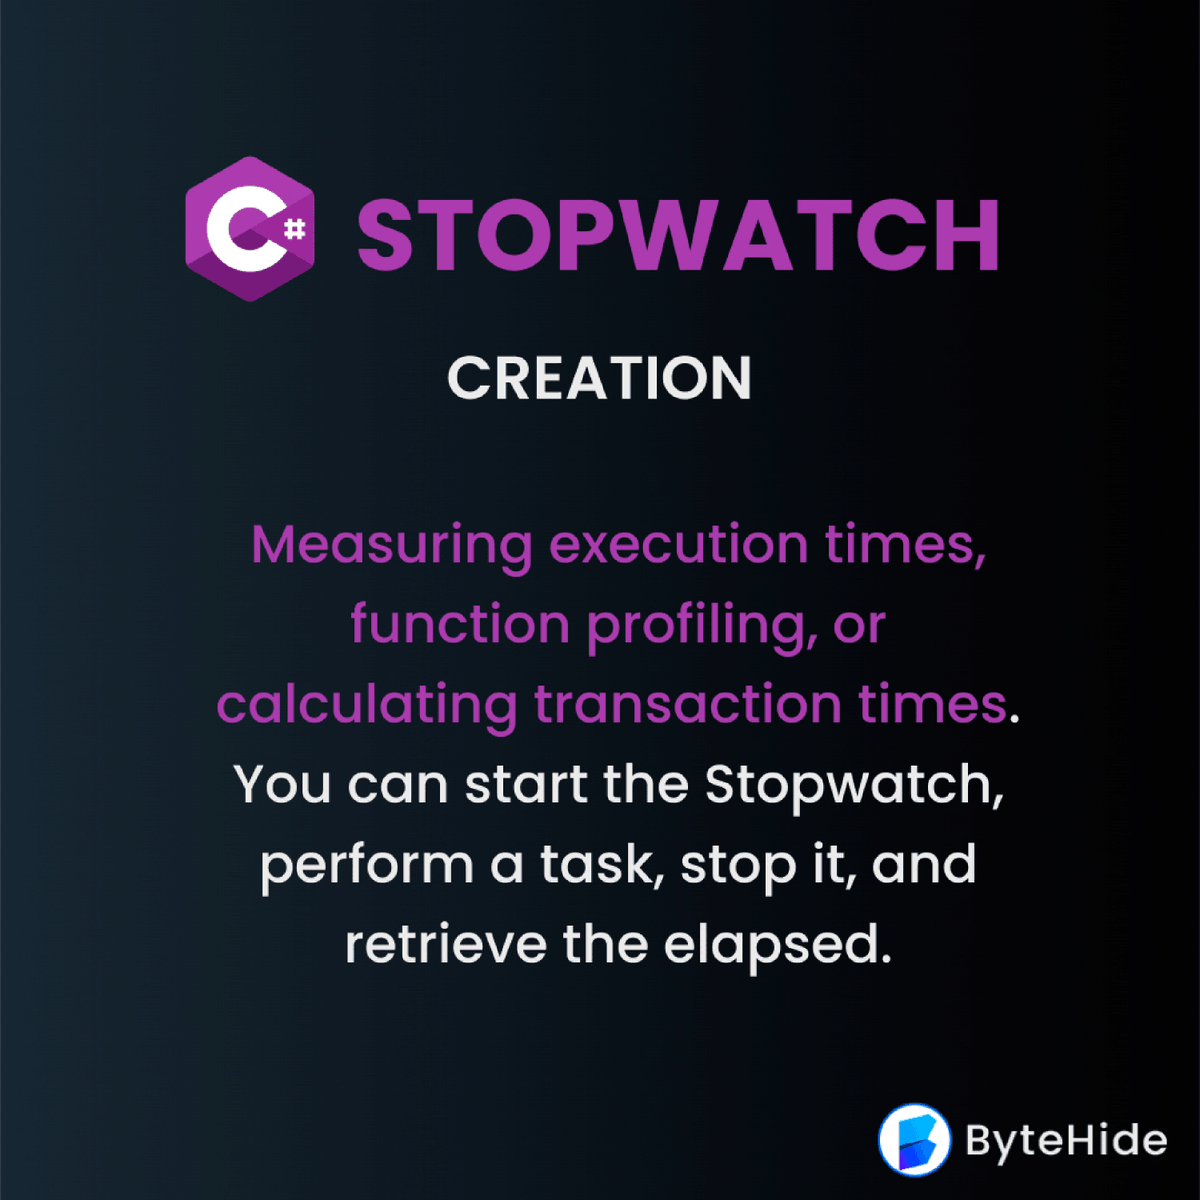
3/5🧵 ⭐ Creating a Stopwatch in C#: Explore various applications like function profiling and transaction time calculations with Stopwatch in C#. Start, stop, and retrieve elapsed time effortlessly. #TechInsights #CodeProfiling
Streamline your development process with #Prefix by Stackify! Dive into real-time code profiling and optimize your app's performance effortlessly. Get your free demo today: hubs.ly/Q02rPkWg0 #DevTools #CodeProfiling #OptimizePerformance

#Render Tip 114: 🔍 Utilize code profiling tools to identify performs bottlenecks and optimize your application’s speed and efficiency. #CodeProfiling #PerformanceOptimization
Profiling your C++ code is essential in HFT. Identify and eliminate performance bottlenecks to stay ahead in the game. #CodeProfiling #PerformanceEnhancement
#QuickTip Profile your code: Utilize profiling tools to identify bottlenecks and hotspots in your code, allowing you to focus on areas that require optimization. #CodeProfiling #PerformanceAnalysis
#QuickTip Profile your code: Utilize profiling tools to identify bottlenecks and hotspots in your code, allowing you to focus on areas that require optimization. #CodeProfiling #PerformanceAnalysis
🚀Uncover the power of cProfile for optimizing your Python code. 🐍#Python #CodeProfiling 👉 amitk.io/python-code-pr…
Use code profiling tools to identify performance bottlenecks and optimize your code. 🚦🔧 #CodeProfiling #CodingTips #BestPractices
Click and Span: How to Optimize with Code Profiling bit.ly/3QIILRn @swesmason @splunk #Sponsored #coding #CodeProfiling
What is code profiling? quora.com/What-is-code-p… #codeprofiling #softwaredevelopment
quora.com
What is code profiling?
Shikha Singh's answer: Code profiling examines the application code to ensure it is optimized, resulting in high application performance. It analyzes the memory, CPU, and network utilized by each...
All You Need to Know About Code Profiling Tools and How to Choose One headspin.io/blog/all-you-n… #CodeProfiling #TestingTools #QA
Performance Profiling Code – Services You Can Expect From The Top-Notch Tools #PerformanceProfiling #CodeProfiling #testingtools lnkd.in/dip55RhQ
How can #codeprofiling benefit your team? ✅ Shortens your SDLC ✅ Ensures high application performance ✅ Improves end-user experience Learn more about code profiling, from methods of profiling code to choosing a profiling tool, in this blog: bit.ly/3KkryeU
#Codeprofiling benefits to developers and #QA engineers: * Makes #softwaredevelopment cycles shorter & more agile. * Keeps app performing reliably under all circumstances * Improves the end-user experience. Detailed Info: headspin.io/blog/all-you-n…
The sprite flickering routine in #TecmoSuperbowl uses ~ 10-13% of the available CPU time per frame. #codeprofiling #nesdev #lua #fceux
@mattwatson81's webinar is tomorrow. Sign up! #developers #CodeProfiling #ItCountsAsWork attendee.gotowebinar.com/register/65432…
Streamline your development process with #Prefix by Stackify! Dive into real-time code profiling and optimize your app's performance effortlessly. Get your free demo today: hubs.ly/Q02rPkWg0 #DevTools #CodeProfiling #OptimizePerformance
Want to boost your app's speed? Start with code profiling! Read more <linkedin.com/feed/update/ur…> #CodeOptimization #CodeProfiling #SoftwareDevelopment #Coding #CodePerformance #OptimizeYourCode #ProgrammingEfficiency #SoftwareEngineering #AppPerformance #unibench
Something went wrong.
Something went wrong.
United States Trends
- 1. Liverpool 153K posts
- 2. #UFCQatar 23.7K posts
- 3. Slot 109K posts
- 4. Luke Riley 1,817 posts
- 5. Mizzou 3,026 posts
- 6. Mateer 1,244 posts
- 7. Chris Paul 11K posts
- 8. Arbuckle N/A
- 9. Rutgers 4,490 posts
- 10. Newcastle 32.6K posts
- 11. Lamine 48.1K posts
- 12. Anfield 28.6K posts
- 13. Dalby 1,471 posts
- 14. Isak 30K posts
- 15. Missouri 9,148 posts
- 16. #Sooners N/A
- 17. Forest 121K posts
- 18. Klopp 9,899 posts
- 19. Reggie Evans N/A
- 20. #kufball N/A