#dataanalyticswithlabanoacademy Suchergebnisse

I promise, the journey would be worth the while #DataAnalyticsWithLabanoAcademy,#LabanoDataAnalysis, #Easy_p5 Labano Academy, Israel Afolabi


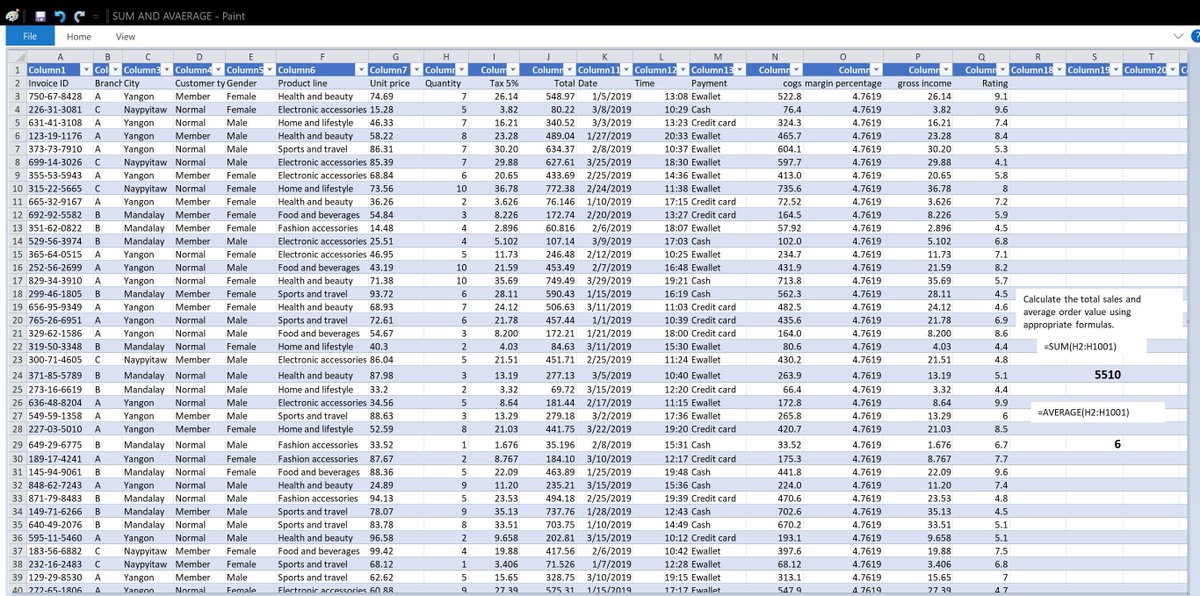
Day 3 challenge: Calculate the total sales and average order value using the appropriate formula For the total sales, I used the =sum(total sales) and for the average, I used the =average(sum of total sales) formula to get my answers. #DataAnalyticswithLabanoAcademy #Easy_p5


Day 5: Creating Charts 10Days Microsoft Excel BootCamp Chart, "Product by Sales",relatnship btw prod. types to cumm.Sales Strength: Food&Beverages_Fund more,diversify Weakness: Health&Beauty_Advertise,human capital #DataAnalyticsWithLabanoAcademy, #LabanoDataAnalysis, Easy_p5


This will be fun and educative, stay tuned #DataAnalyticsWithLabanoAcademy, #LabanoDataAnalysis, #Easy_p5,@richakin2000


Day 8 of 10 of Data Analysis Excel Boot Camp #DataAnalyticsWithLabanoAcademy, #LabanoDataAnalysis, #Easy_p5 #DataAnalysis


Day 7 challenge: Use two advanced function and I would be using the "MATCH" and "VLOOKUP" function #DataAnalyticsWithLabanoAcademy #LabanoDataAnalysis #Easy_p5


=INDEX() returns the value of a cell in a table based on the column and row number. The screenshot shows the formula and the result, Using COGS as subject. #DataAnalyticsWithLabanoAcademy, #LabanoDataAnalysis, #microsoftexcel #dataanalysisskills

Day 5 challenge : Today I am creating a bar chat depicting the product-wise sales distribution. #DataAnalyticsWithLabanoAcademy #LabanoDataAnalysis #Easy_p5

Day 8 Challenge :Analyzing sales trends over time and suggesting strategies for improving sales #DataAnalyticsWithLabanoAcademy #LabanoDataAnalysis #Easy_p5

Day 4 challenge : Conditional formatting Conditional formatting from the highest cells with the highest sales value. #DataAnalyticsWithLabanoAcademy #LabanoDataAnalysis #Easy_p5

Day 10 of 10! YES!!! We did it!! Excited to share my latest visualization in Microsoft Excel. I've mastered the art of customized chart appearance, labels, and colors, taking my data visualizations to the next level. #DataAnalyticsWithLabanoAcademy, #LabanoDataAnalysis

Day 6 challenge: I would be creating a pivot table summarizing sales by varying categories I observed in the dataset. #DataAnalyticsWithLabanoAcademy #LabanoDataAnalysis #Easy_p5

Day 10/10 Challenge and I'm so thrilled to show you the dashboard I created with a variety of chart appearances, labels, and color. Thank you all👍 #DataAnalyticsWithLabanoAcademy #LabanoDataAnalysis #Easy_p5

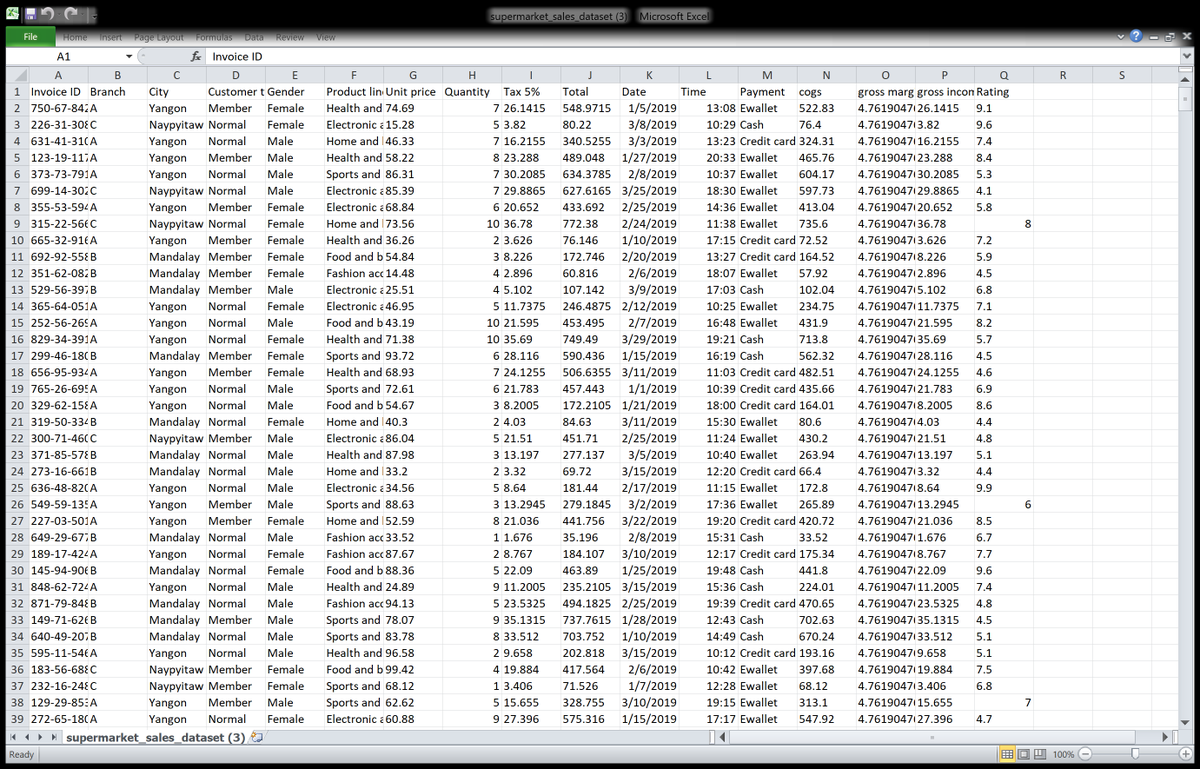
Day 2 challenge: Data importing and cleaning. I filtered the "branch" alphabetically, formatted the data column and converted the table to a standard Excel table. Frame 1: uncleaned data Frame 2: Cleaned data #DataAnalyticsWithLabanoAcademy #LabanoDataAnalysis #Easy_p5


Day 9 challenge: I'm implementing data Validation for product quantities to prevent invalid enteries. Data validation is a powerful tool for ensuring data accuracy,According to my DV any number above 10 is an error . #DataAnalyticsWithLabanoAcademy #LabanoDataAnalysis #Easy_p5


Day 6 of Day 10 ✅created a Pivot Table! It's for organizing and analyzing data efficiently. ✅Below is the table #DataAnalyticsWithLabanoAcademy, #LabanoDataAnalysis, Easy_p5. Labano Academy, Israel Afolabi


10 days bootcamp at Labano Academy Wow, gonna be an exciting journey. #DataAnalyticsWithLabanoAcademy #LabanoDataAnalysis
Day 6 of Day 10 ✅created a Pivot Table! It's for organizing and analyzing data efficiently. ✅Below is the table #DataAnalyticsWithLabanoAcademy, #LabanoDataAnalysis, Easy_p5. Labano Academy, Israel Afolabi
Day 5 of 10days Bootcamp ✅I created a pivot table to get the accurate value ✅ I created a bar chat to show the relationships between total sales and product line #DataAnalyticsWithLabanoAcademy #LabanoDataAnalysis, Easy_p5 Labano Academy, Israel Afolabi Labano ACADEMYCOHORT7


Day 4 of 10 days Bootcamp ✅I calculated the mean, median and mode of Totalsales value ✅I to use the mode value $829 for conditional formatting the highlight in greencolor ✅Below is my screenshot data using #DataAnalyticsWithLabanoAcademy #LabanoDataAnalysis, Israel Afolabi


Day 3 of 10 days #DataAnalyticsWithLabanoAcademy, #LabanoDataAnalysis, Easy_p5. Labano Academy, Israel Afolabi
#DataAnalyticsWithLabanoAcademy, #LabanoDataAnalysis, Easy_p5. Labano Academy, Israel Afolabi
Data Analysis and Visualization Bootcamp.. I would be working on this data set: lnkd.in/dx9AW5Tq So, for the next ten days I would be on this journey with you.. #DataAnalyticsWithLabanoAcademy, #LabanoDataAnalysis, Easy_p5. Labano Academy, Israel Afolabi

Day 10/10 Challenge and I'm so thrilled to show you the dashboard I created with a variety of chart appearances, labels, and color. Thank you all👍 #DataAnalyticsWithLabanoAcademy #LabanoDataAnalysis #Easy_p5
Day 10 Of 10: final day of the Data Analysis Excel Bootcamp. Displayed is my visualization chart, showcasing the data I've been working with since day one. #DataAnalyticsWithLabanoAcademy, #LabanoDataAnalysis, #Easy_p5 #DataAnalysis

Day 9 challenge: I'm implementing data Validation for product quantities to prevent invalid enteries. Data validation is a powerful tool for ensuring data accuracy,According to my DV any number above 10 is an error . #DataAnalyticsWithLabanoAcademy #LabanoDataAnalysis #Easy_p5
Day 9 of 10: Data Validation. Image 1:Validation Setup showing the need for whole numbers & values not morethan 10. Image 2:Error Message caused by an attempt to input a value more than 10 into a cell. #DataAnalyticsWithLabanoAcademy, #LabanoDataAnalysis, #Easy_p5 #DataAnalysis


Day 8 of 10 of Data Analysis Excel Boot Camp #DataAnalyticsWithLabanoAcademy, #LabanoDataAnalysis, #Easy_p5 #DataAnalysis
Day 3 challenge: Calculate the total sales and average order value using the appropriate formula For the total sales, I used the =sum(total sales) and for the average, I used the =average(sum of total sales) formula to get my answers. #DataAnalyticswithLabanoAcademy #Easy_p5
Day 7 challenge: Use two advanced function and I would be using the "MATCH" and "VLOOKUP" function #DataAnalyticsWithLabanoAcademy #LabanoDataAnalysis #Easy_p5
Day 5 challenge : Today I am creating a bar chat depicting the product-wise sales distribution. #DataAnalyticsWithLabanoAcademy #LabanoDataAnalysis #Easy_p5
Day 8 Challenge :Analyzing sales trends over time and suggesting strategies for improving sales #DataAnalyticsWithLabanoAcademy #LabanoDataAnalysis #Easy_p5
Day 4 challenge : Conditional formatting Conditional formatting from the highest cells with the highest sales value. #DataAnalyticsWithLabanoAcademy #LabanoDataAnalysis #Easy_p5
Day 6 challenge: I would be creating a pivot table summarizing sales by varying categories I observed in the dataset. #DataAnalyticsWithLabanoAcademy #LabanoDataAnalysis #Easy_p5
I promise, the journey would be worth the while #DataAnalyticsWithLabanoAcademy,#LabanoDataAnalysis, #Easy_p5 Labano Academy, Israel Afolabi
Day 10/10 Challenge and I'm so thrilled to show you the dashboard I created with a variety of chart appearances, labels, and color. Thank you all👍 #DataAnalyticsWithLabanoAcademy #LabanoDataAnalysis #Easy_p5
Day 2 challenge: Data importing and cleaning. I filtered the "branch" alphabetically, formatted the data column and converted the table to a standard Excel table. Frame 1: uncleaned data Frame 2: Cleaned data #DataAnalyticsWithLabanoAcademy #LabanoDataAnalysis #Easy_p5
Day 9 challenge: I'm implementing data Validation for product quantities to prevent invalid enteries. Data validation is a powerful tool for ensuring data accuracy,According to my DV any number above 10 is an error . #DataAnalyticsWithLabanoAcademy #LabanoDataAnalysis #Easy_p5
This will be fun and educative, stay tuned #DataAnalyticsWithLabanoAcademy, #LabanoDataAnalysis, #Easy_p5,@richakin2000
Day 5: Creating Charts 10Days Microsoft Excel BootCamp Chart, "Product by Sales",relatnship btw prod. types to cumm.Sales Strength: Food&Beverages_Fund more,diversify Weakness: Health&Beauty_Advertise,human capital #DataAnalyticsWithLabanoAcademy, #LabanoDataAnalysis, Easy_p5
Day 8 of 10 of Data Analysis Excel Boot Camp #DataAnalyticsWithLabanoAcademy, #LabanoDataAnalysis, #Easy_p5 #DataAnalysis
#DataAnalyticsWithLabanoAcademy, #LabanoDataAnalysis, #Easy_p5.#richakin2000 Exciting news! Richard Akinware, a Data Analysis intern at Labano Academy, is taking on a 10-day Microsoft Excel challenge with his colleagues, friends, and mentor, Israel Afolabi.
Day 3: Challenge: Calculate the total sales and average order value using appropriate formulas. Attached is the formula to calculate the total sales and average =Sum (H2:H1001) ENTER = Average (H2:H1001) ENTER #DataAnalyticsWithLabanoAcademy, #LabanoDataAnalysis, #Easy_p5,
Day 4: Challenge: Apply conditional formatting to highlight cells with high sales values. Indicate what you think is a high sales value for you. #DataAnalyticsWithLabanoAcademy, #LabanoDataAnalysis, #Easy_p5 @Labano academy, @Israel Afolabi


=INDEX() returns the value of a cell in a table based on the column and row number. The screenshot shows the formula and the result, Using COGS as subject. #DataAnalyticsWithLabanoAcademy, #LabanoDataAnalysis, #microsoftexcel #dataanalysisskills
Something went wrong.
Something went wrong.
United States Trends
- 1. #AcousticPianoSnowGlobe 1,516 posts
- 2. #TSTheErasTour 1,313 posts
- 3. Nano Banana Pro 9,349 posts
- 4. Dick Cheney 12.1K posts
- 5. #NXXT_NEWS N/A
- 6. FINAL DRAFT FINAL LOVE 199K posts
- 7. #LoveDesignFinalEP 181K posts
- 8. YOYOK N/A
- 9. #WeekndTourLeaks N/A
- 10. Nnamdi Kanu 135K posts
- 11. Haymitch 12.5K posts
- 12. Good Thursday 38.6K posts
- 13. Husqvarna N/A
- 14. SEDITIOUS BEHAVIOR 4,272 posts
- 15. sohee 37.9K posts
- 16. Pablo 67.8K posts
- 17. Reaping 78.2K posts
- 18. Unemployment 30.5K posts
- 19. Happy Birthday Erika 3,537 posts
- 20. The Hunger Games 88.3K posts