#excelgraphsandchartshelp resultados de búsqueda


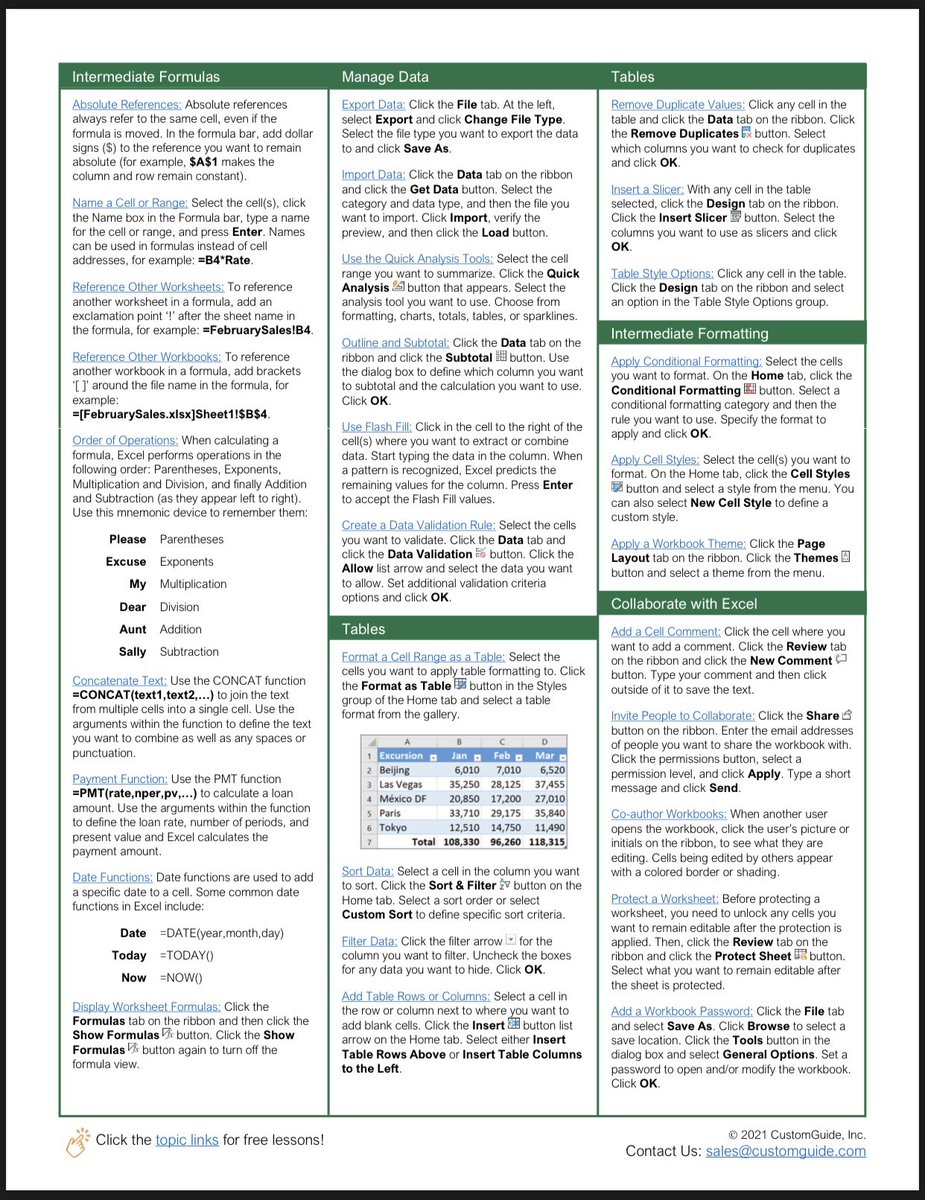
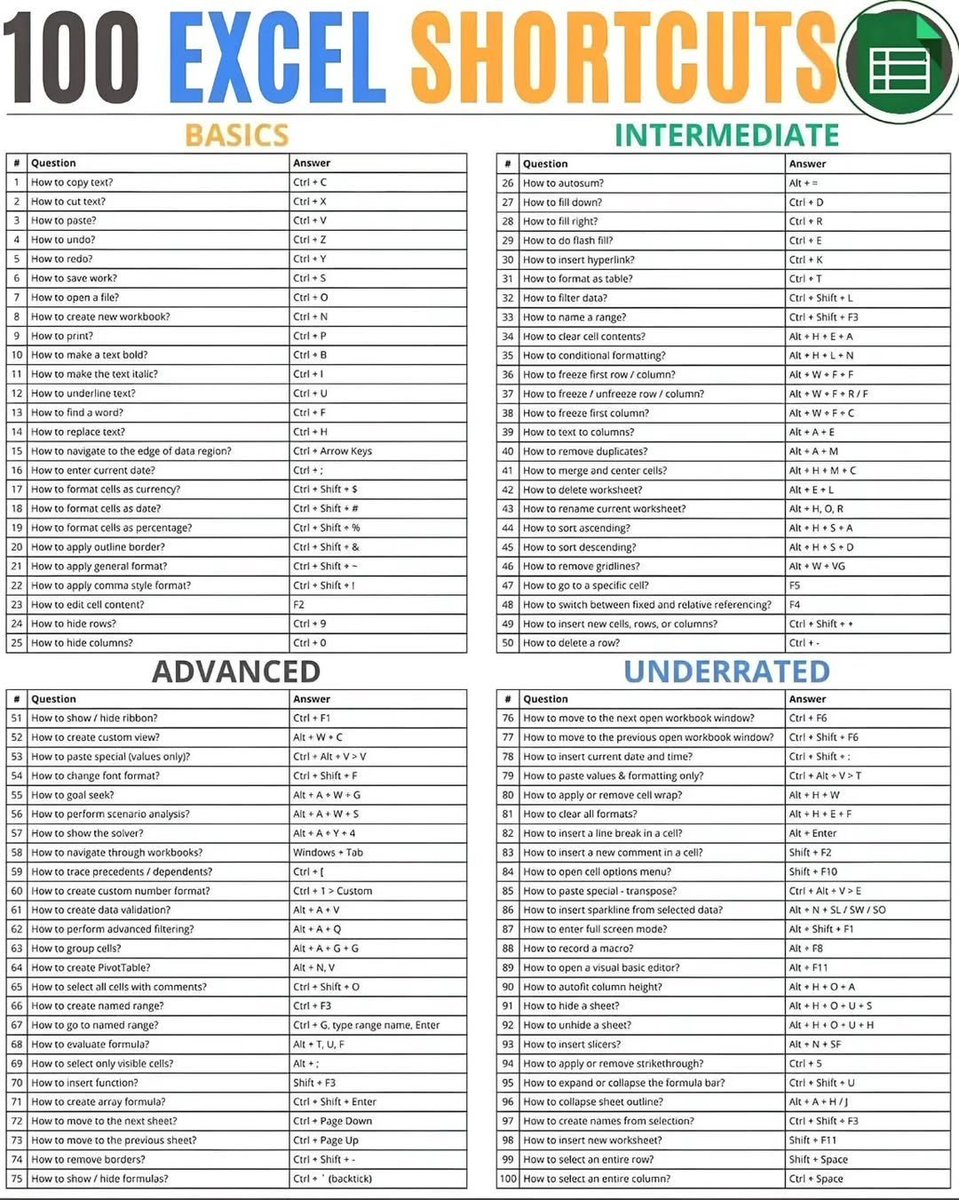
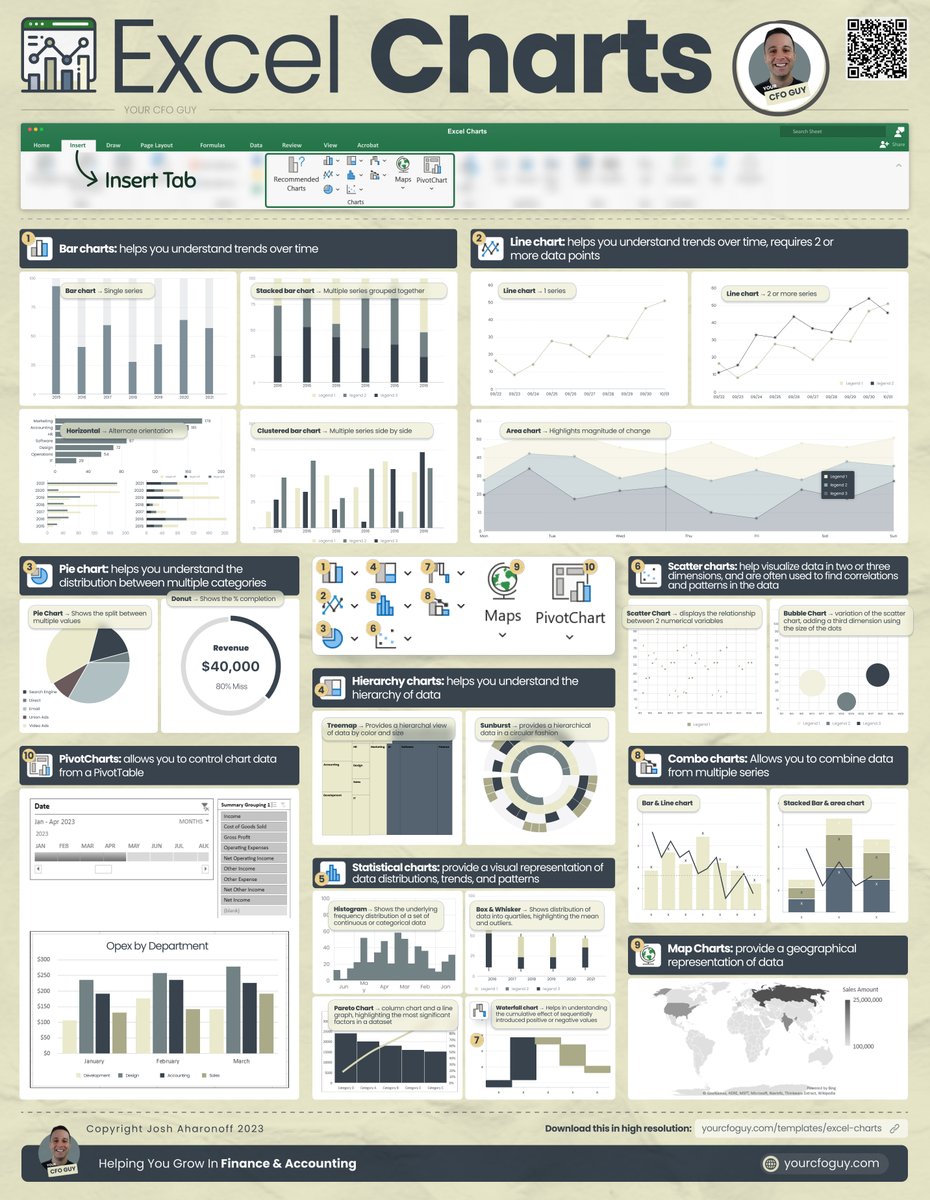
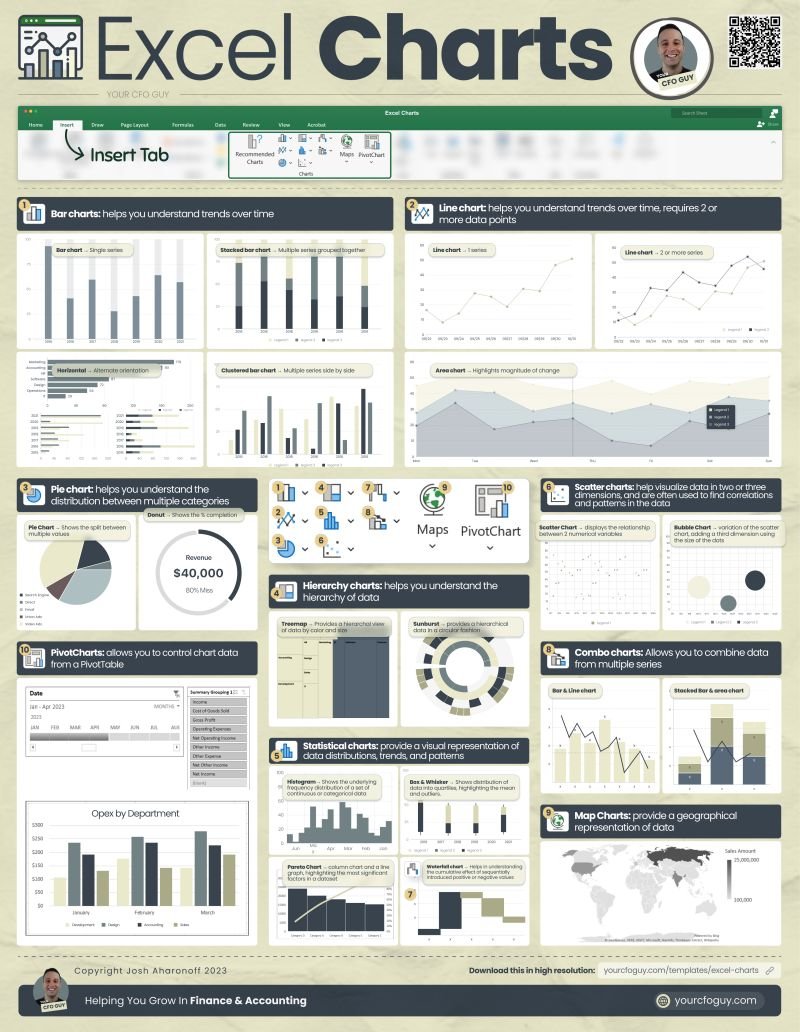
If you are a lover of Excel like me, here’s a cheat sheet that might be useful to you. It has basically everything you need from beginners to Advanced. Even non data analysts can you use it.


Excel is difficult to learn, but not anymore! Introducing "The Ultimate Excel ebook "PDF. You will get: • 74+ pages cheatsheet • Save 100+ hours on research And for 48 hrs, it's 100% FREE! To get it, just: 1. Like & repost 2. Comment “FREE” 3. Follow me (so I can DM).

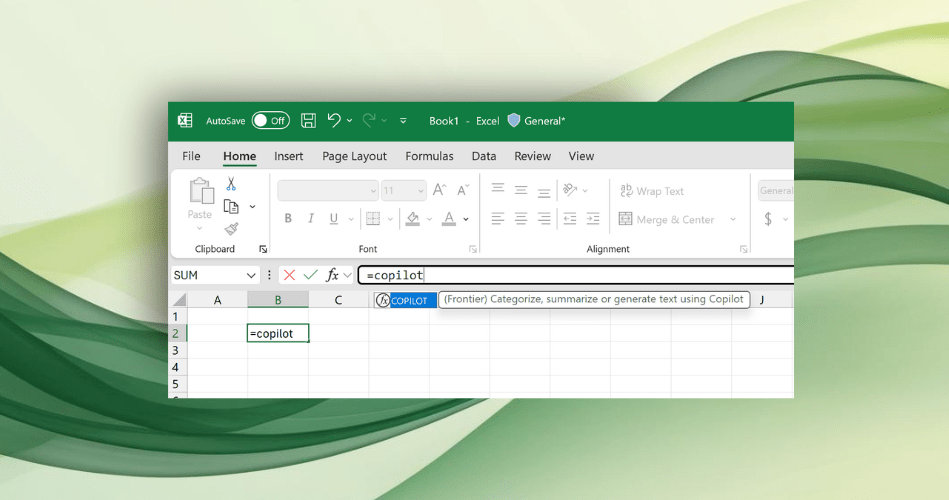
I just love this. The new =COPILOT() function in Excel lets you analyze, generate content, and brainstorm directly in the grid.

Did you know you can put a graph within a cell in Excel? Here's how: 📊

How to make Inline Progress Bars in Excel‼️ ❤️ and follow for daily tips! 🗂️ Save this post for future reference! 👯 Share it with a friend! #cheatsheets #excel #exceltips #googlesheets #spreadsheet

هذا توي اخذته من المنشن نواف ي اخوان انا اصيح عليكم من ٤ سنوات تتعلمون اهم حاجتين في الاكسل - اداة Pivot Table - دالة Vlookup وهذا مثال جديد

How to make a dynamic infographic-style chart in Excel: 📊 • Insert → People Graph • Select Data Range • Choose → Type, Theme, Shape

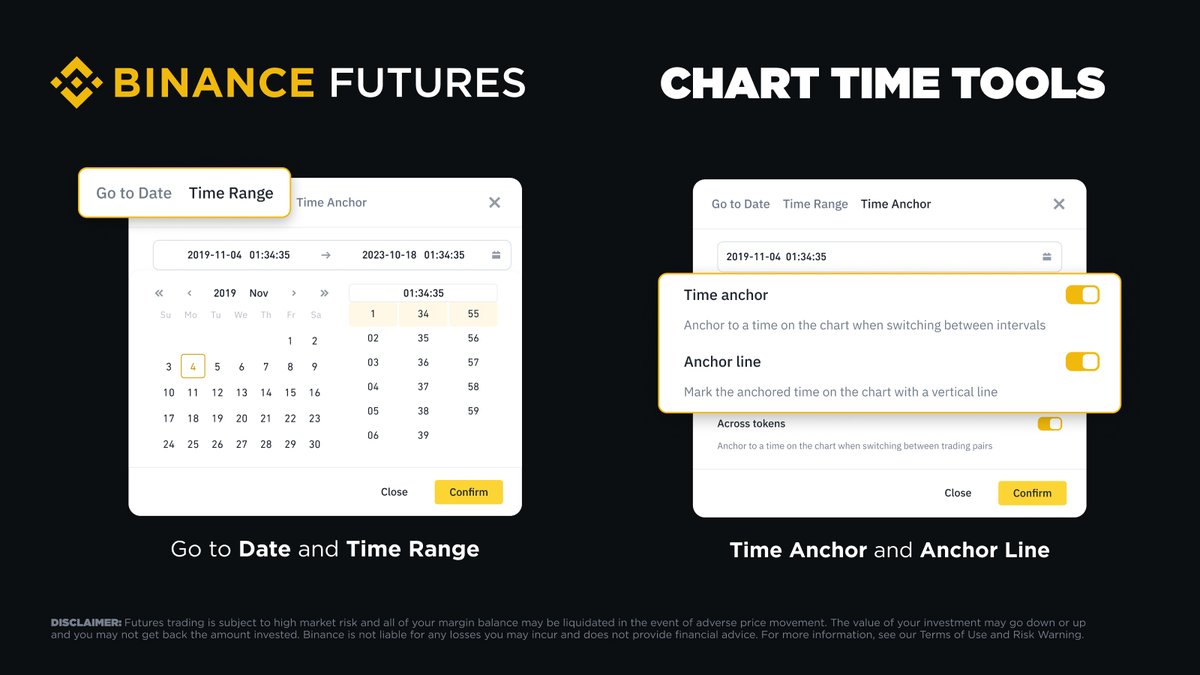
Enhance Your Charting with these time tools! 🔹 Quickly jump to any date and time with the Go to Date tool 🔹 Customize your view by selecting your ideal Time Range for candlesticks 🔹 Keep your focus steady using Time Anchor when switching between intervals Give these tools a…


متعود على الإكسل لكن جديد على إستخدام البور بي اي؟ هذه أفضل أداة اوصيك فيها .. تنقل شغلك اللي بالـExcel إلى Power BI بدون خطوات معقدة : coupler.io/power-bi-integ…
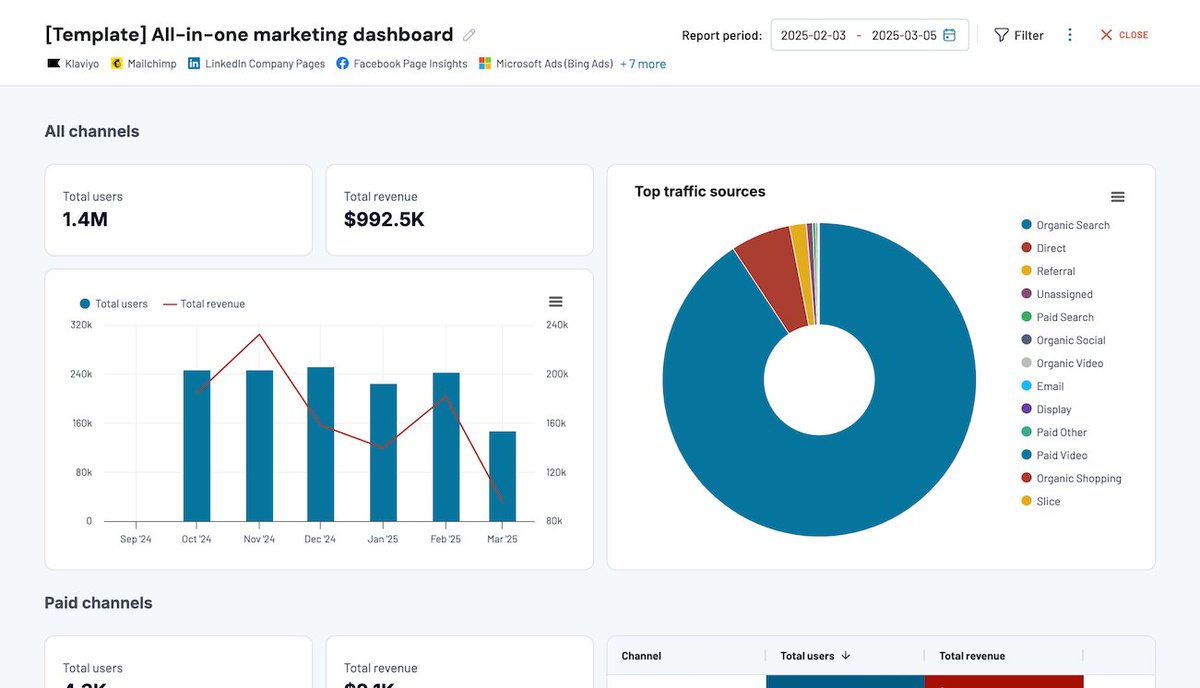

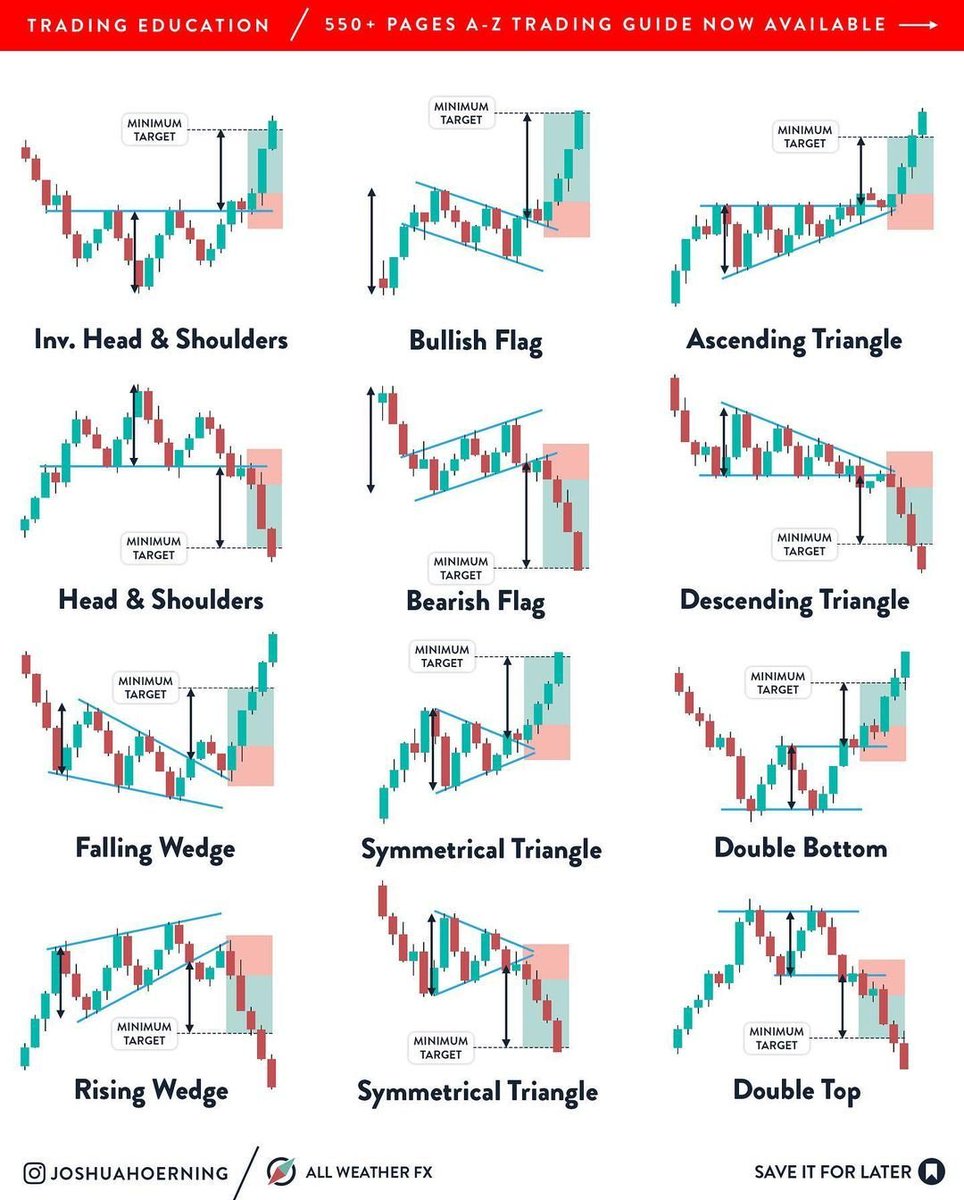
Chart patterns I personally rarely use them. But they can be helpful Source mentioned at the picture
How to build a quick and easy interactive chart in Excel: 📊 • Select Range • Format as Table • Insert Slicer • Insert Chart Like this! 👇🏻
Tuesday: REPT Graph An alternative to Sparklines. Did you know you can put a graph within a cell using the REPT formula in Excel? Here's how: 📊

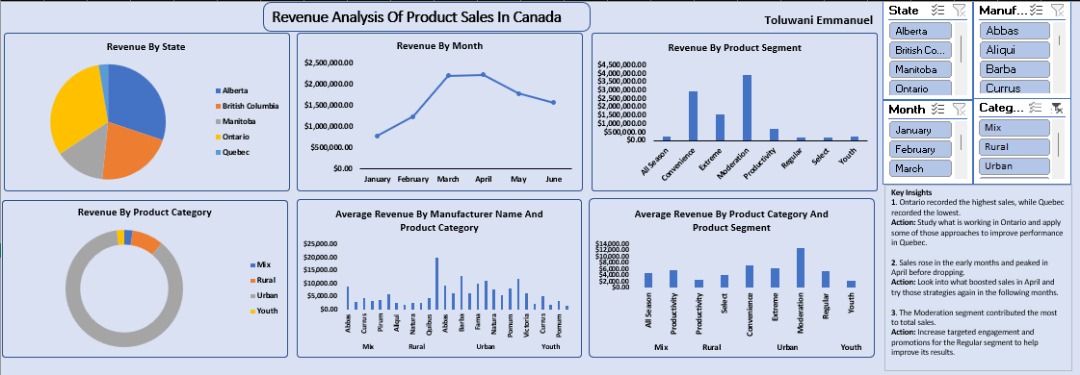
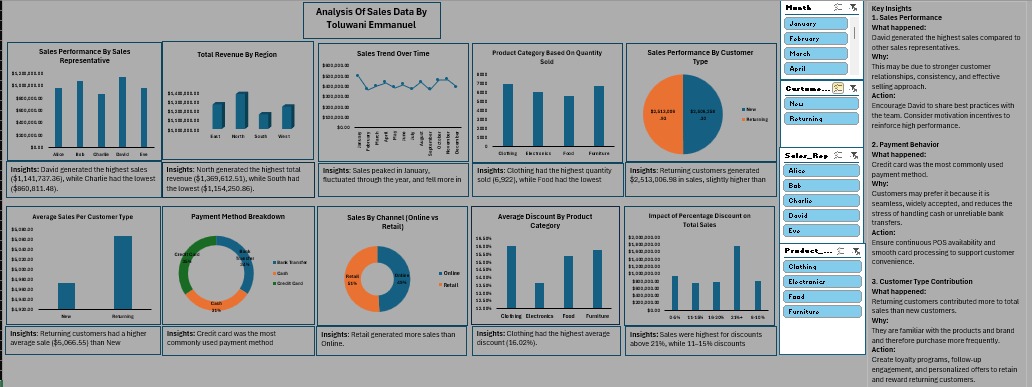
I’ve been working on improving my Excel skills. These are two dashboards I built from recent assignments. Excel isn’t “basic.” Once you understand data cleaning, tables, pivot tables, and visuals, you realize how much you can do with it.

damn this sounds really useful thanks Microsoft


Microsoft Excel adds Copilot AI to help fill in spreadsheet cells theverge.com/news/761338/mi…

Goodbye, ChatGPT Say hello to Microsoft Copilot, your all-in-one assistant for PowerPoint, Excel, Teams, Outlook, and Word. Here are 13 powerful things you can do with Copilot:

How to build a quick and easy interactive chart in Excel: 📊 • Select Range • Format as Table • Insert Slicer • Insert Chart Like this! 👇🏻
Something went wrong.
Something went wrong.
United States Trends
- 1. RIP Beef N/A
- 2. #HardRockBet 4,055 posts
- 3. SNAP 650K posts
- 4. Jamaica 90.6K posts
- 5. #IDontWantToOverreactBUT 5,489 posts
- 6. #MondayMotivation 42.7K posts
- 7. Roger McCreary 1,494 posts
- 8. #ChelleyxTrueReligion 2,881 posts
- 9. MRIs 2,478 posts
- 10. Friendly 56K posts
- 11. John Dickerson 1,002 posts
- 12. #Dandadan215 N/A
- 13. Hurricane Melissa 53.4K posts
- 14. Berghain 41.5K posts
- 15. jungkook 373K posts
- 16. Chapman 3,814 posts
- 17. DNCE Halloween N/A
- 18. Stephen King 5,287 posts
- 19. Victory Monday 4,070 posts
- 20. $QCOM 17.5K posts