#excelseries search results


The #ExcelSeries has been fun to watch so far as well. A huge field, and some really sharp looking paint jobs 😎👍 #B6hr


SIMPLE CHARTS AND GRAPHS I visualized a sales dataset using charts and graphs, which effectively summarized the data in a clear and easily interpretable visual format, making it simpler to understand key trends. #excel #data #excelseries #spreadsheet


DATA VALIDATION I find data validation a very helpful tool especially in Data collection. It helps to ensure accurate and consistent data and reduces the burden of data cleaning. #excel #data #excelseries #spreadsheet


NESTED FUNCTION I used the IFS+ AND logic functions to give remarks to each patient's blood pressure reading based on JNC-7 classification. #excel #data #excelseries #spreadsheet


LOGIC FUNCTION I explored the =NOT() function. It reverses the value of its argument. #excel #data #excelseries #spreadsheet


SORTING AND CONDITIONAL FORMATTING Using the JNC-7 Blood pressure classification and ADA’s Blood glucose level classification, I formatted the SBP, DBP and Blood glucose levels based on the conditions by the governing bodies. #excel #data #excelseries


CUSTOM TABLE OF CONTENT Navigating sheets within a workbook can be a lot so I linked the sheet to the first page so all I need to do is click the sheet I am interested in. #excel #data #excelseries #spreadsheet

NESTED FUNCTION IF + AND IF + OR IFS + OR These and others allow to combine multiple functions in Excel to perform several calculations in a go. #excel #data #excelseries #spreadsheet


POWER QUERY AND POWER PIVOT Power query imports (by extracting, transforming and loading) the data while with Power Pivot we create relationships, explore (using DAX) and visualise the data #excel #data #excelseries #spreadsheet #powerpivot #powerquery


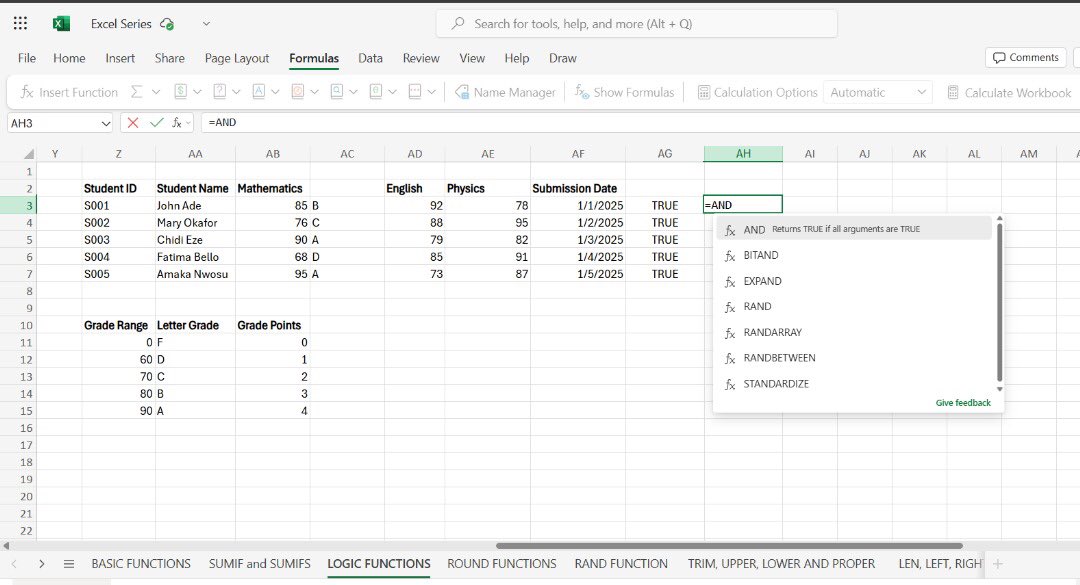
LOGIC FUNCTION I explored another logic function today. The =AND() function. It returns TRUE when both arguments are True and FALSE when one is false. #excel #data #excelseries #spreadsheet


DASHBOARD Today, I made an interactive sales dashboard of a fictional company. #excel #data #excelseries #spreadsheet

LOGIC FUNCTIONS I used the =IFS() function to group the scores of the students following the letter grade system. #excel #data #excelseries #spreadsheet


SHEET PROTECTION It maintains the integrity and privacy of the dataset by preventing others from changing, moving or deleting important data #data #excel #excelseries #spreadsheet


LOGIC FUNCTIONS I used the =IF() function to categorise the amount into Cheap or Expensive while =OR () returns TRUE if any of its conditions is true and FALSE if all are False #excel #data #excelseries #spreadsheet


ADVANCED CHARTS The Waterfall Chart illustrates the net value change between two points. Financial data can be effectively visualized with this chart, as it provides a detailed breakdown of a company's expenses and profits. #data #excel #excelseries #sheets


On today's episode of our ongoing career series, we will be talking about 'How to build your career in an unstable economy'. Join us for an eye opening session with Tunde Aboluwade. Time: 8:30pm Venue: ZOOM Link: Available in bio/Dms #DCLagoshq #ExcelSeries #CareerBuilding

POWER QUERY AND POWER PIVOT Power query imports (by extracting, transforming and loading) the data while with Power Pivot we create relationships, explore (using DAX) and visualise the data #excel #data #excelseries #spreadsheet #powerpivot #powerquery
DASHBOARD Today, I made an interactive sales dashboard of a fictional company. #excel #data #excelseries #spreadsheet
NESTED FUNCTION IF + AND IF + OR IFS + OR These and others allow to combine multiple functions in Excel to perform several calculations in a go. #excel #data #excelseries #spreadsheet
NESTED FUNCTION I used the IFS+ AND logic functions to give remarks to each patient's blood pressure reading based on JNC-7 classification. #excel #data #excelseries #spreadsheet
PIVOT TABLE It summarises, calculates and analyses numerical datasets so that trends and patterns are easily seen especially when working on a large dataset. #excel #data #excelseries #spreadsheet


ADVANCED CHARTS Using the same dataset from the Bullet chart, I decided to visualize the data in a Combo Chart. This chart effectively combines both line and column charts. #excel #data #excelseries #spreadsheet


ADVANCED CHARTS The Waterfall Chart illustrates the net value change between two points. Financial data can be effectively visualized with this chart, as it provides a detailed breakdown of a company's expenses and profits. #data #excel #excelseries #sheets
ADVANCED CHART I explored the column chart to show/depict the progress made by each sales representative. #excel #data #excelseries #spreadsheet

CUSTOM TABLE OF CONTENT Navigating sheets within a workbook can be a lot so I linked the sheet to the first page so all I need to do is click the sheet I am interested in. #excel #data #excelseries #spreadsheet
SHEET PROTECTION It maintains the integrity and privacy of the dataset by preventing others from changing, moving or deleting important data #data #excel #excelseries #spreadsheet
DATA VALIDATION I find data validation a very helpful tool especially in Data collection. It helps to ensure accurate and consistent data and reduces the burden of data cleaning. #excel #data #excelseries #spreadsheet
SIMPLE CHARTS AND GRAPHS I visualized a sales dataset using charts and graphs, which effectively summarized the data in a clear and easily interpretable visual format, making it simpler to understand key trends. #excel #data #excelseries #spreadsheet
SORTING AND CONDITIONAL FORMATTING Using the JNC-7 Blood pressure classification and ADA’s Blood glucose level classification, I formatted the SBP, DBP and Blood glucose levels based on the conditions by the governing bodies. #excel #data #excelseries
LOGIC FUNCTION I explored another logic function today. The =AND() function. It returns TRUE when both arguments are True and FALSE when one is false. #excel #data #excelseries #spreadsheet
LOGIC FUNCTION I explored the =NOT() function. It reverses the value of its argument. #excel #data #excelseries #spreadsheet
LOGIC FUNCTIONS I used the =IFS() function to group the scores of the students following the letter grade system. #excel #data #excelseries #spreadsheet
LOGIC FUNCTIONS I used the =IF() function to categorise the amount into Cheap or Expensive while =OR () returns TRUE if any of its conditions is true and FALSE if all are False #excel #data #excelseries #spreadsheet
INDEX AND MATCH MATCH returns the position of a specified value in a row/column while INDEX returns the value in that position #excel #data #excelseries #spreadsheet


DATA VALIDATION I find data validation a very helpful tool especially in Data collection. It helps to ensure accurate and consistent data and reduces the burden of data cleaning. #excel #data #excelseries #spreadsheet
POWER QUERY AND POWER PIVOT Power query imports (by extracting, transforming and loading) the data while with Power Pivot we create relationships, explore (using DAX) and visualise the data #excel #data #excelseries #spreadsheet #powerpivot #powerquery
ADVANCED CHARTS The Waterfall Chart illustrates the net value change between two points. Financial data can be effectively visualized with this chart, as it provides a detailed breakdown of a company's expenses and profits. #data #excel #excelseries #sheets
NESTED FUNCTION IF + AND IF + OR IFS + OR These and others allow to combine multiple functions in Excel to perform several calculations in a go. #excel #data #excelseries #spreadsheet
NESTED FUNCTION I used the IFS+ AND logic functions to give remarks to each patient's blood pressure reading based on JNC-7 classification. #excel #data #excelseries #spreadsheet
The #ExcelSeries has been fun to watch so far as well. A huge field, and some really sharp looking paint jobs 😎👍 #B6hr
SIMPLE CHARTS AND GRAPHS I visualized a sales dataset using charts and graphs, which effectively summarized the data in a clear and easily interpretable visual format, making it simpler to understand key trends. #excel #data #excelseries #spreadsheet
On today's episode of our ongoing career series, we will be talking about 'How to build your career in an unstable economy'. Join us for an eye opening session with Tunde Aboluwade. Time: 8:30pm Venue: ZOOM Link: Available in bio/Dms #DCLagoshq #ExcelSeries #CareerBuilding
LOGIC FUNCTION I explored another logic function today. The =AND() function. It returns TRUE when both arguments are True and FALSE when one is false. #excel #data #excelseries #spreadsheet
SORTING AND CONDITIONAL FORMATTING Using the JNC-7 Blood pressure classification and ADA’s Blood glucose level classification, I formatted the SBP, DBP and Blood glucose levels based on the conditions by the governing bodies. #excel #data #excelseries
LOGIC FUNCTION I explored the =NOT() function. It reverses the value of its argument. #excel #data #excelseries #spreadsheet
CUSTOM TABLE OF CONTENT Navigating sheets within a workbook can be a lot so I linked the sheet to the first page so all I need to do is click the sheet I am interested in. #excel #data #excelseries #spreadsheet
LOGIC FUNCTIONS I used the =IF() function to categorise the amount into Cheap or Expensive while =OR () returns TRUE if any of its conditions is true and FALSE if all are False #excel #data #excelseries #spreadsheet
SHEET PROTECTION It maintains the integrity and privacy of the dataset by preventing others from changing, moving or deleting important data #data #excel #excelseries #spreadsheet
PIVOT TABLE It summarises, calculates and analyses numerical datasets so that trends and patterns are easily seen especially when working on a large dataset. #excel #data #excelseries #spreadsheet
INDEX AND MATCH MATCH returns the position of a specified value in a row/column while INDEX returns the value in that position #excel #data #excelseries #spreadsheet
DASHBOARD Today, I made an interactive sales dashboard of a fictional company. #excel #data #excelseries #spreadsheet
LOGIC FUNCTIONS I used the =IFS() function to group the scores of the students following the letter grade system. #excel #data #excelseries #spreadsheet
ADVANCED CHARTS Using the same dataset from the Bullet chart, I decided to visualize the data in a Combo Chart. This chart effectively combines both line and column charts. #excel #data #excelseries #spreadsheet
ADVANCED CHART I explored the column chart to show/depict the progress made by each sales representative. #excel #data #excelseries #spreadsheet
Something went wrong.
Something went wrong.
United States Trends
- 1. Pond 214K posts
- 2. Kim Davis 2,821 posts
- 3. $BNKK 1,054 posts
- 4. #IDontWantToOverreactBUT N/A
- 5. #MondayMotivation 40.2K posts
- 6. Go Birds 5,679 posts
- 7. Semper Fi 6,835 posts
- 8. Happy 250th 8,214 posts
- 9. $LMT $450.50 Lockheed F-35 1,109 posts
- 10. $SENS $0.70 Senseonics CGM 1,126 posts
- 11. $APDN $0.20 Applied DNA 1,101 posts
- 12. Good Monday 46.6K posts
- 13. #MYNZ N/A
- 14. Obamacare 22.3K posts
- 15. Edmund Fitzgerald 5,746 posts
- 16. Obergefell 1,979 posts
- 17. Victory Monday 2,884 posts
- 18. Talus Labs 26.4K posts
- 19. #USMC 1,284 posts
- 20. Rudy Giuliani 30.1K posts