#fintechdealactivity search results

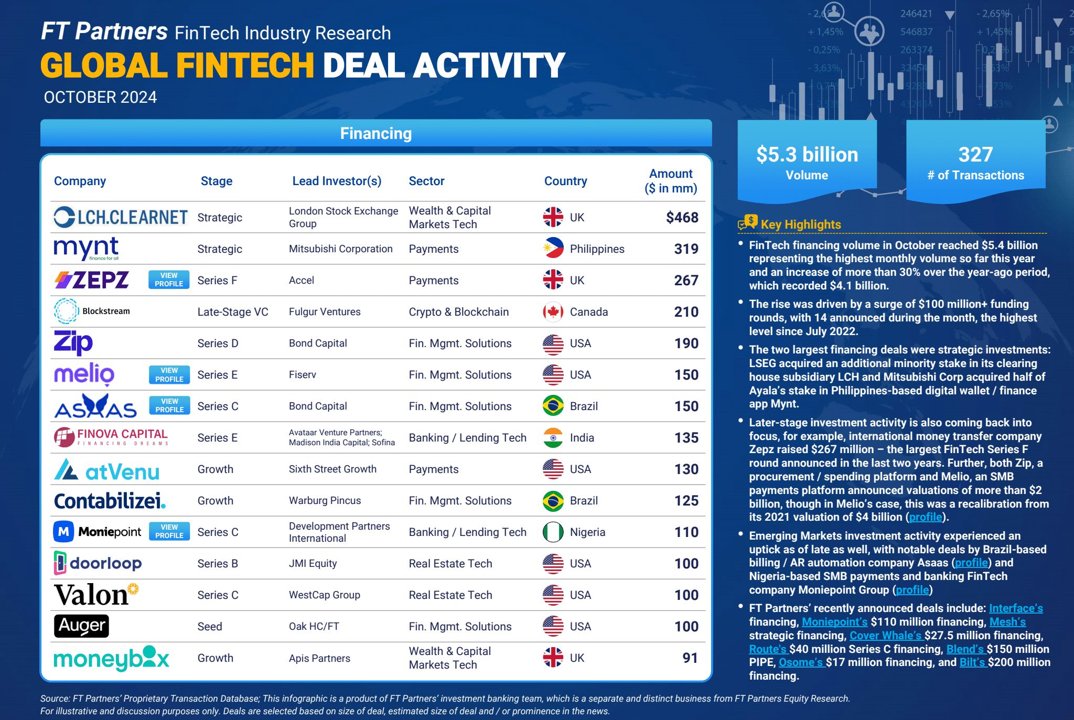
October #FinTech Deal Activity Recap: $9.1 billion in Financing Volume and $11.1 billion in M&A Volume – For professional / institutional investors only, see all of the details in FT Partners' infographic finte.ch/GlobalMonthlyF… #FinTechDealActivity

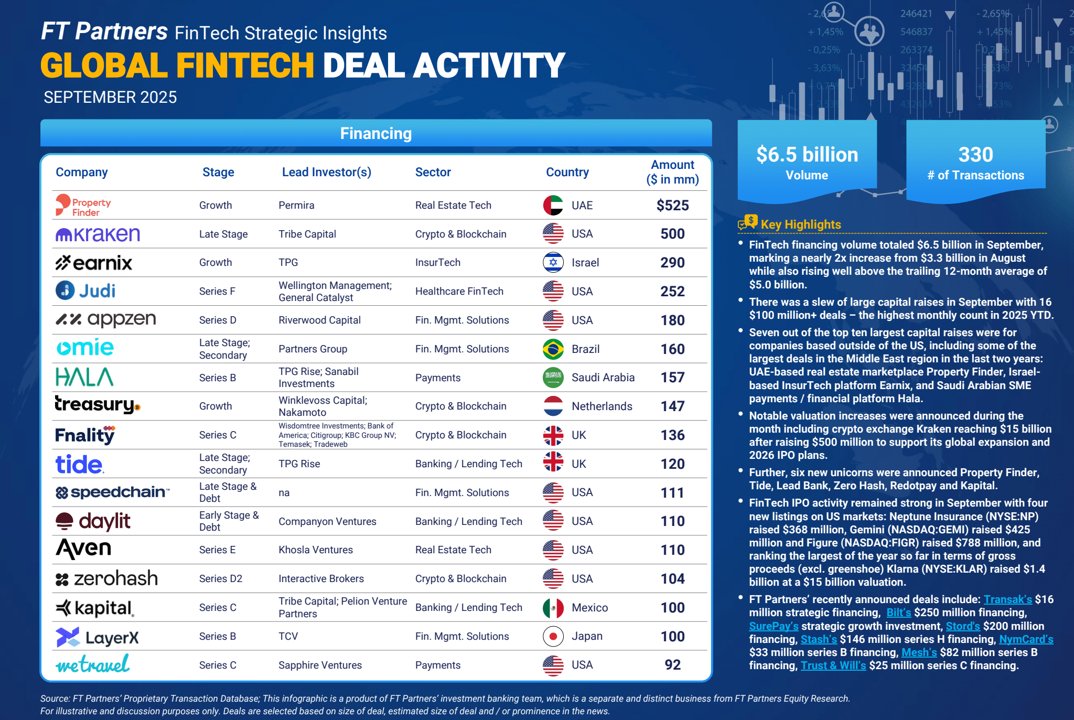
September #FinTech Deal Activity Recap: $6.5 billion in Financing Volume and $19.7 billion in M&A Volume – For professional / institutional investors only, see all of the details in FT Partners' infographic finte.ch/GlobalMonthlyF… #FinTechDealActivity
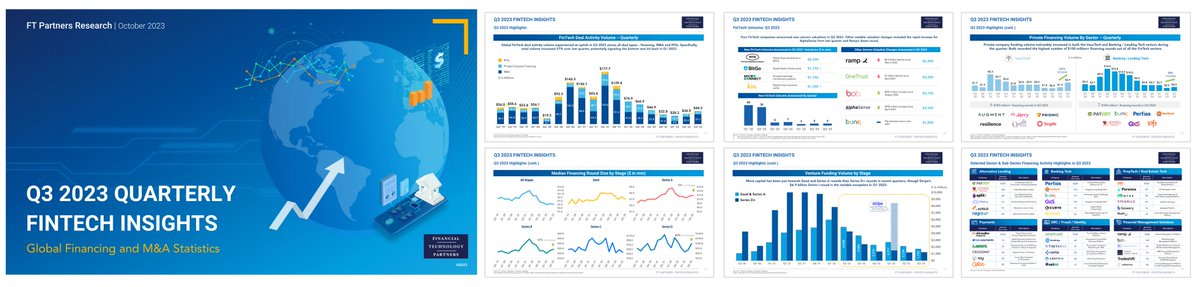
FT Partners publishes its Q3 2023 FinTech Insights Report - the ONLY source for complete #FinTech financing, M&A, and IPO activity cut across geographies and sectors! finte.ch/3Q23FinTechIns… #FinTechDealActivity
FT Partners publishes its Q2 2023 Sponsor FinTech Insights report, providing the most comprehensive quarterly review of global Private Equity FinTech deal activity across sponsor-led M&A and financing transactions finte.ch/2Q23SponsorIns… #FinTech #FinTechDealActivity

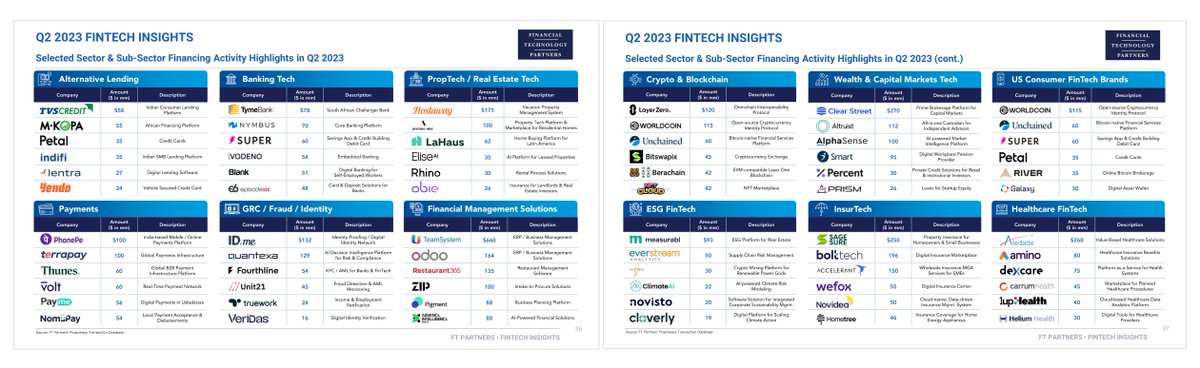
Check out Q2 2023 financing activity across FinTech sub-sectors including PropTech, GRC, and Consumer FinTech – see more in FT Partners’ Q2 2023 FinTech Insights report finte.ch/2Q23FinTechIns… #FinTech #FinTechDealActivity
#FinTech financing volume hit just under $3 billion in February, 34% higher than the year-ago period, though down more than 20% from $3.8 billion in January 2025 - see all of the details in FT Partners' Global Monthly Infographic finte.ch/GlobalMonthlyF… #FinTechDealActivity

FT Partners publishes its Q1 2025 FinTech Insights report - providing the most comprehensive review of #FinTech financing, M&A, and IPO activity cut across geographies and sectors! finte.ch/1Q25FinTechIns… #FinTechDealActivity

Global FinTech deal activity picked up in Q2 over Q1, after a six-quarter straight decline, primarily driven by an uptick in $1 billion+ M&A – see more in FT Partners’ Q2 2023 FinTech Insights report finte.ch/2Q23FinTechIns… #FinTech #FinTechDealActivity

October #FinTech deal activity highlights include a surge of $100 million+ financing and the highest monthly M&A deal count in over two years - see all of the details in FT Partners' Global Monthly Infographic finte.ch/GlobalMonthlyF… #FinTechDealActivity
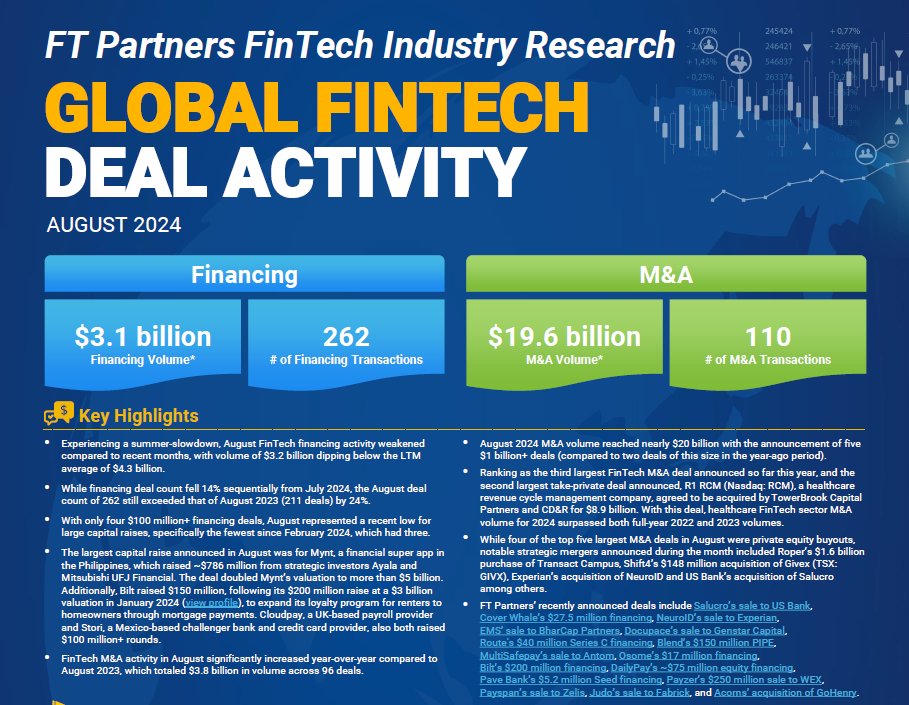
August #FinTech financing activity waned compared to recent months with fewer $100 million+ capital raises, while M&A volume got a boost from five $1 billion+ deals - see all of the details in FT Partners' Global Monthly Infographic finte.ch/GlobalMonthlyF… #FinTechDealActivity
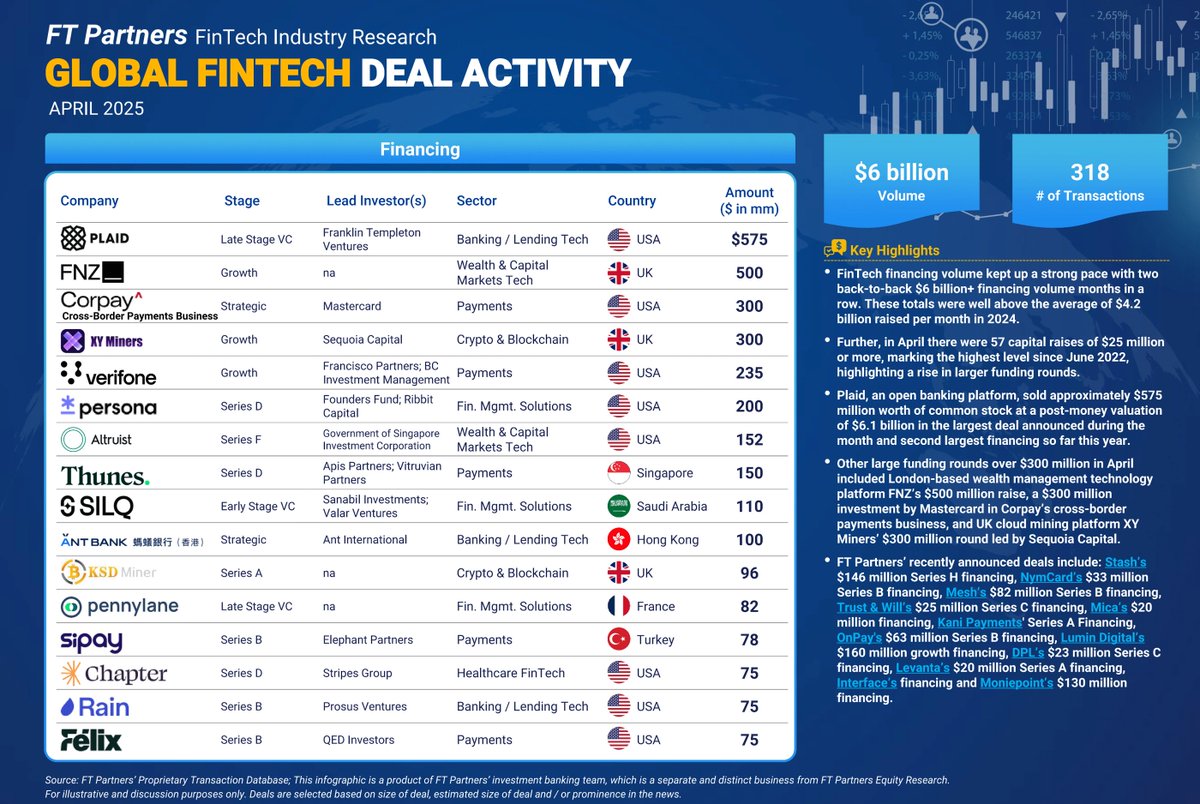
In April, #FinTech financing volume totaled over $6 billion for the second month in a row and M&A volume and deal count both reached the third highest monthly levels ever - see all of the details in FT Partners' infographic finte.ch/GlobalMonthlyF… #FinTechDealActivity
July #FinTech Deal Activity: $7 billion in Financing Volume and $20 billion in M&A Volume – For professional / institutional investors only, see all of the details in FT Partners' infographic finte.ch/GlobalMonthlyF… #FinTechDealActivity

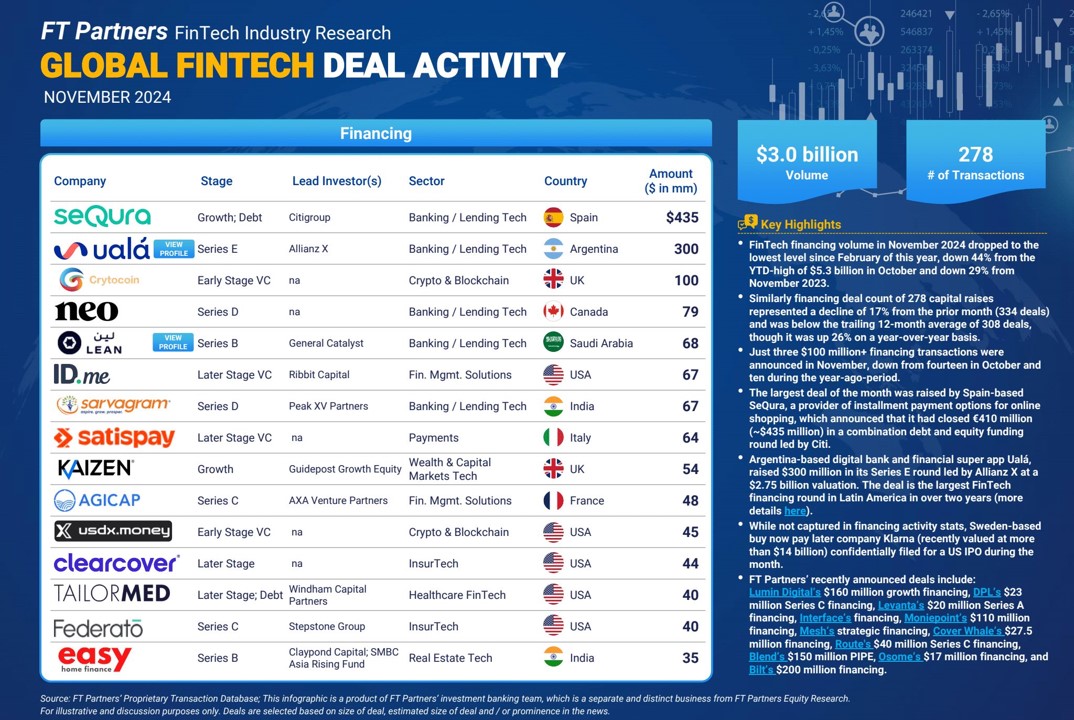
#FinTech financing volume in November dropped to the lowest level since February of this year as just three $100 million+ capital raises were announced in the month - see all of the details in FT Partners' Global Monthly Infographic finte.ch/GlobalMonthlyF… #FinTechDealActivity
May #FinTech Deal Activity: $6.5 billion in Financing Volume and $10.8 billion in M&A Volume – For professional/institutional investors only, see all of the details in FT Partners' infographic finte.ch/GlobalMonthlyF… #FinTechDealActivity

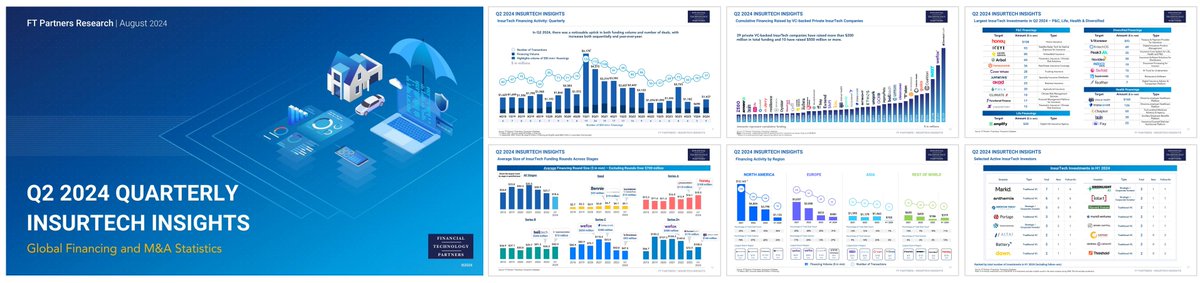
FT Partners publishes its Q2 2024 InsurTech Insights Report - the ONLY source for comprehensive global #InsurTech financing, M&A, and IPO activity data! finte.ch/2Q24InsurTechI… #FinTechDealActivity #FinTech

Boom! October's FinTech deal activity is on fire #FinTechDealActivity
October #FinTech Deal Activity Recap: $9.1 billion in Financing Volume and $11.1 billion in M&A Volume – For professional / institutional investors only, see all of the details in FT Partners' infographic finte.ch/GlobalMonthlyF… #FinTechDealActivity
September #FinTech Deal Activity Recap: $6.5 billion in Financing Volume and $19.7 billion in M&A Volume – For professional / institutional investors only, see all of the details in FT Partners' infographic finte.ch/GlobalMonthlyF… #FinTechDealActivity
August #FinTech Deal Activity: $3.2 billion in Financing Volume and $30.6 billion in M&A Volume – For professional / institutional investors only, see all of the details in FT Partners' infographic finte.ch/GlobalMonthlyF… #FinTechDealActivity

July #FinTech Deal Activity: $7 billion in Financing Volume and $20 billion in M&A Volume – For professional / institutional investors only, see all of the details in FT Partners' infographic finte.ch/GlobalMonthlyF… #FinTechDealActivity
May #FinTech Deal Activity: $6.5 billion in Financing Volume and $10.8 billion in M&A Volume – For professional/institutional investors only, see all of the details in FT Partners' infographic finte.ch/GlobalMonthlyF… #FinTechDealActivity
In April, #FinTech financing volume totaled over $6 billion for the second month in a row and M&A volume and deal count both reached the third highest monthly levels ever - see all of the details in FT Partners' infographic finte.ch/GlobalMonthlyF… #FinTechDealActivity
FT Partners publishes its Q1 2025 FinTech Insights report - providing the most comprehensive review of #FinTech financing, M&A, and IPO activity cut across geographies and sectors! finte.ch/1Q25FinTechIns… #FinTechDealActivity
#FinTech financing volume hit just under $3 billion in February, 34% higher than the year-ago period, though down more than 20% from $3.8 billion in January 2025 - see all of the details in FT Partners' Global Monthly Infographic finte.ch/GlobalMonthlyF… #FinTechDealActivity
#FinTech financing volume in November dropped to the lowest level since February of this year as just three $100 million+ capital raises were announced in the month - see all of the details in FT Partners' Global Monthly Infographic finte.ch/GlobalMonthlyF… #FinTechDealActivity
Boom! October's FinTech deal activity is on fire #FinTechDealActivity
October #FinTech deal activity highlights include a surge of $100 million+ financing and the highest monthly M&A deal count in over two years - see all of the details in FT Partners' Global Monthly Infographic finte.ch/GlobalMonthlyF… #FinTechDealActivity
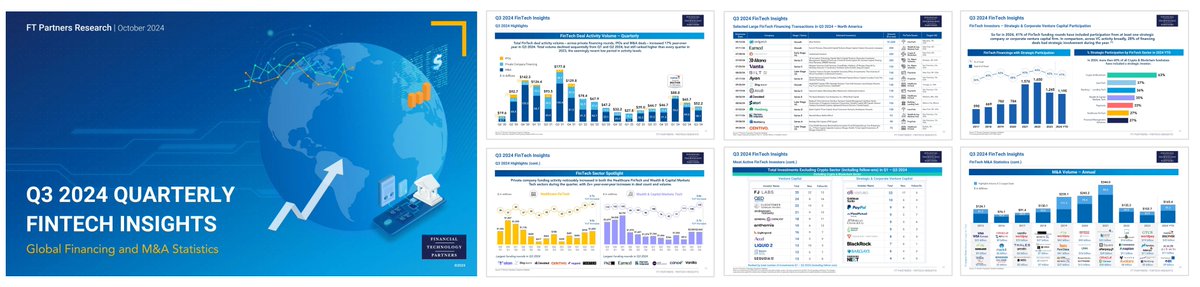
FT Partners publishes its Q3 2024 FinTech Insights Report - the ONLY source for complete #FinTech financing, M&A, and IPO activity cut across geographies and sectors! finte.ch/3Q24FinTechIns… #FinTechDealActivity
August #FinTech financing activity waned compared to recent months with fewer $100 million+ capital raises, while M&A volume got a boost from five $1 billion+ deals - see all of the details in FT Partners' Global Monthly Infographic finte.ch/GlobalMonthlyF… #FinTechDealActivity
FT Partners publishes its Q2 2024 InsurTech Insights Report - the ONLY source for comprehensive global #InsurTech financing, M&A, and IPO activity data! finte.ch/2Q24InsurTechI… #FinTechDealActivity #FinTech
FT Partners publishes its Q2 2024 FinTech Insights Report - the ONLY source for complete #FinTech financing, M&A, and IPO activity cut across geographies and sectors! finte.ch/2Q24FinTechIns… #FinTechDealActivity

FT Partners publishes its Q1 2024 InsurTech Insights Report - the ONLY source for comprehensive global #InsurTech financing, M&A, and IPO activity data! finte.ch/1Q24InsurTechI… #FinTechDealActivity #FinTech

FT Partners publishes its Q1 2024 FinTech Insights Report - the ONLY source for complete #FinTech financing, M&A, and IPO activity cut across geographies and sectors! finte.ch/1Q24FinTechIns… #FinTechDealActivity

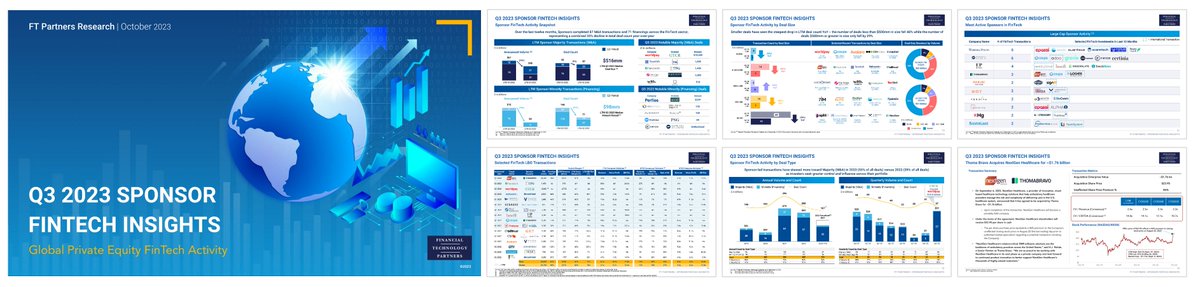
FT Partners publishes its Q3 2023 Sponsor FinTech Insights report, providing the most comprehensive quarterly review of global Private Equity FinTech deal activity across sponsor-led M&A and financing transactions finte.ch/3Q23SponsorIns… #FinTech #FinTechDealActivity
FT Partners publishes its Q3 2023 FinTech Insights Report - the ONLY source for complete #FinTech financing, M&A, and IPO activity cut across geographies and sectors! finte.ch/3Q23FinTechIns… #FinTechDealActivity
Check out Q2 2023 financing activity across FinTech sub-sectors including PropTech, GRC, and Consumer FinTech – see more in FT Partners’ Q2 2023 FinTech Insights report finte.ch/2Q23FinTechIns… #FinTech #FinTechDealActivity
October #FinTech Deal Activity Recap: $9.1 billion in Financing Volume and $11.1 billion in M&A Volume – For professional / institutional investors only, see all of the details in FT Partners' infographic finte.ch/GlobalMonthlyF… #FinTechDealActivity
September #FinTech Deal Activity Recap: $6.5 billion in Financing Volume and $19.7 billion in M&A Volume – For professional / institutional investors only, see all of the details in FT Partners' infographic finte.ch/GlobalMonthlyF… #FinTechDealActivity
FT Partners publishes its Q3 2023 FinTech Insights Report - the ONLY source for complete #FinTech financing, M&A, and IPO activity cut across geographies and sectors! finte.ch/3Q23FinTechIns… #FinTechDealActivity
Check out Q2 2023 financing activity across FinTech sub-sectors including PropTech, GRC, and Consumer FinTech – see more in FT Partners’ Q2 2023 FinTech Insights report finte.ch/2Q23FinTechIns… #FinTech #FinTechDealActivity
Global FinTech deal activity picked up in Q2 over Q1, after a six-quarter straight decline, primarily driven by an uptick in $1 billion+ M&A – see more in FT Partners’ Q2 2023 FinTech Insights report finte.ch/2Q23FinTechIns… #FinTech #FinTechDealActivity
FT Partners publishes its Q2 2023 Sponsor FinTech Insights report, providing the most comprehensive quarterly review of global Private Equity FinTech deal activity across sponsor-led M&A and financing transactions finte.ch/2Q23SponsorIns… #FinTech #FinTechDealActivity
FT Partners publishes its Q1 2025 FinTech Insights report - providing the most comprehensive review of #FinTech financing, M&A, and IPO activity cut across geographies and sectors! finte.ch/1Q25FinTechIns… #FinTechDealActivity
FT Partners publishes its Q2 2024 InsurTech Insights Report - the ONLY source for comprehensive global #InsurTech financing, M&A, and IPO activity data! finte.ch/2Q24InsurTechI… #FinTechDealActivity #FinTech
#FinTech financing volume hit just under $3 billion in February, 34% higher than the year-ago period, though down more than 20% from $3.8 billion in January 2025 - see all of the details in FT Partners' Global Monthly Infographic finte.ch/GlobalMonthlyF… #FinTechDealActivity
October #FinTech deal activity highlights include a surge of $100 million+ financing and the highest monthly M&A deal count in over two years - see all of the details in FT Partners' Global Monthly Infographic finte.ch/GlobalMonthlyF… #FinTechDealActivity
#FinTech financing volume in November dropped to the lowest level since February of this year as just three $100 million+ capital raises were announced in the month - see all of the details in FT Partners' Global Monthly Infographic finte.ch/GlobalMonthlyF… #FinTechDealActivity
August #FinTech financing activity waned compared to recent months with fewer $100 million+ capital raises, while M&A volume got a boost from five $1 billion+ deals - see all of the details in FT Partners' Global Monthly Infographic finte.ch/GlobalMonthlyF… #FinTechDealActivity
July #FinTech Deal Activity: $7 billion in Financing Volume and $20 billion in M&A Volume – For professional / institutional investors only, see all of the details in FT Partners' infographic finte.ch/GlobalMonthlyF… #FinTechDealActivity
In April, #FinTech financing volume totaled over $6 billion for the second month in a row and M&A volume and deal count both reached the third highest monthly levels ever - see all of the details in FT Partners' infographic finte.ch/GlobalMonthlyF… #FinTechDealActivity
May #FinTech Deal Activity: $6.5 billion in Financing Volume and $10.8 billion in M&A Volume – For professional/institutional investors only, see all of the details in FT Partners' infographic finte.ch/GlobalMonthlyF… #FinTechDealActivity
Something went wrong.
Something went wrong.
United States Trends
- 1. #IDontWantToOverreactBUT N/A
- 2. Thanksgiving 140K posts
- 3. #GEAT_NEWS 1,042 posts
- 4. $ENLV 12.1K posts
- 5. Jimmy Cliff 19.1K posts
- 6. #MondayMotivation 12K posts
- 7. #WooSoxWishList N/A
- 8. Victory Monday 3,339 posts
- 9. Good Monday 48.2K posts
- 10. DOGE 222K posts
- 11. $GEAT 1,035 posts
- 12. TOP CALL 4,748 posts
- 13. Monad 164K posts
- 14. The Harder They Come 2,573 posts
- 15. #MondayVibes 3,230 posts
- 16. AI Alert 2,743 posts
- 17. Feast Week 1,480 posts
- 18. Bowen 15.9K posts
- 19. $NVO 3,456 posts
- 20. Renzi 5,411 posts