#graphsarehard search results


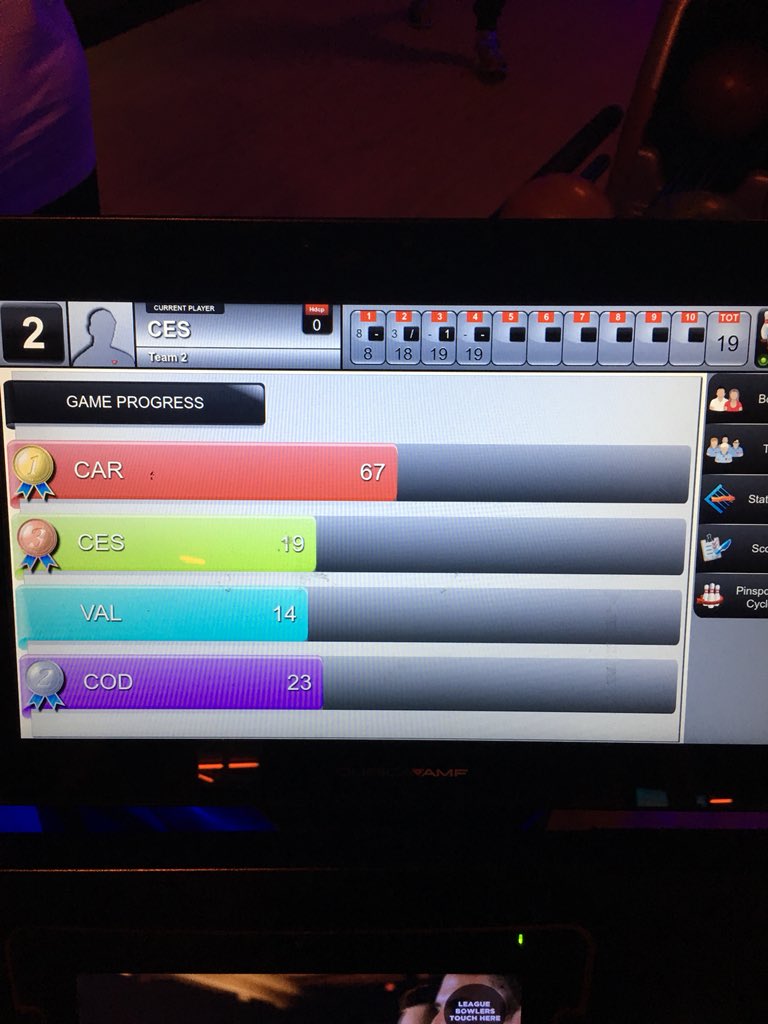
@BowleroBowl needs to take a statistics visualization course. #statistics #graphsarehard #barcharts #wonkybowling

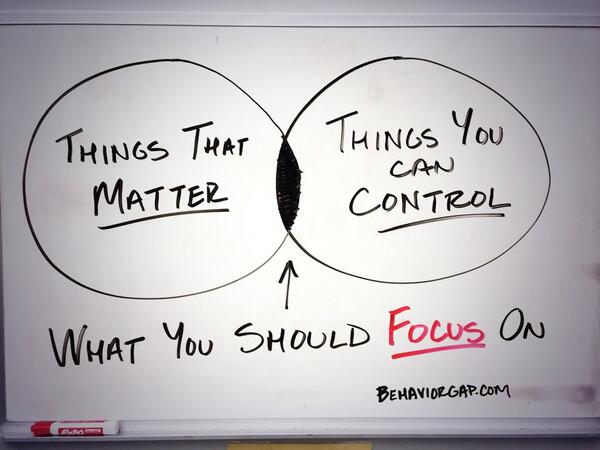
“@BUPerformance: #WhiteboardWednesday http://t.co/5hRvgLafZ0” yes...& nice to see proper use of Venn diagram unlike @netflix #graphsarehard


@emilyengdahl If only I were so science-y. I'll hand him something tasty and say, "that's good beer, huh?" and be on our way! #graphsarehard

@mysecretdinner You’ll enjoy this thread. #GraphsAreHard

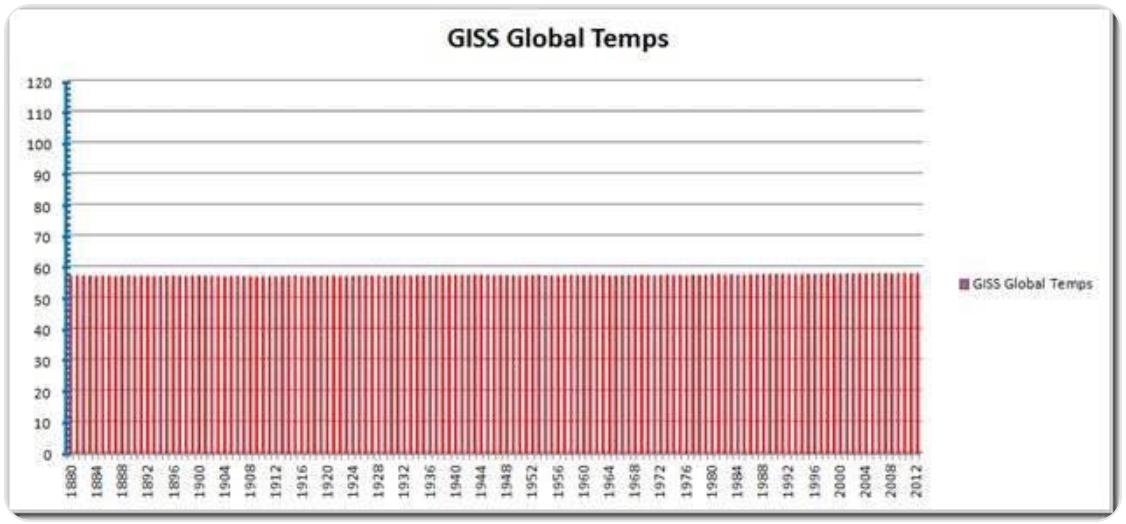
Here's what the "dramatic" rise in global temperature looks like when a realistic scale is used on the Y-axis. It is so not out of the ordinary it is completely ridiculous to make up fake stories about CO2 being the cause of the "climate crisis". The climate is very stable.

Nice. The red line looks like it was the perfect time to start turning up the... wait, what is the blue line? #graphsarehard

@RangerStalked @BLKSUMMER @crg1182 approval rating = percentage #GraphsAreHard


For people under 60, coronavirus is LESS dangerous than the seasonal flu:


See Americans aren't worried about Zika at... wait a second


@diane__h sorry, didn't cop. Still in the office preparing for a presentation tmrw. Still only making the slides now. #graphsarehard

21 years old and I still don't understand pre-algebra. #GraphsAreHard

Ummm... Obama & Biden were sworn in January 2009... that graph shows a decline in poverty from inauguration to completion of term 😂😂😂😂😂😂😂🤣 #graphsarehard

Tea Party Maths! #wut #fail #graphsarehard herit.ag/18kG3qO


@BowleroBowl needs to take a statistics visualization course. #statistics #graphsarehard #barcharts #wonkybowling
“@BUPerformance: #WhiteboardWednesday http://t.co/5hRvgLafZ0” yes...& nice to see proper use of Venn diagram unlike @netflix #graphsarehard
Something went wrong.
Something went wrong.
United States Trends
- 1. Good Thursday 32.1K posts
- 2. #thursdayvibes 2,089 posts
- 3. Merry Christmas 65.9K posts
- 4. Happy Friday Eve N/A
- 5. #NationalCookieDay N/A
- 6. #JASPER_TouchMV 273K posts
- 7. #DareYouToDeathSpecial 82.5K posts
- 8. JASPER COMEBACK TOUCH 178K posts
- 9. #ThursdayThoughts 1,535 posts
- 10. Hilux 8,984 posts
- 11. Metaverse 6,210 posts
- 12. DataHaven 11.6K posts
- 13. Toyota 29.2K posts
- 14. Earl Campbell 2,483 posts
- 15. Omar 186K posts
- 16. Colbert 4,642 posts
- 17. Tacoma N/A
- 18. Prince Harry 9,565 posts
- 19. Halle Berry 4,476 posts
- 20. USPS 7,696 posts