#influxdb search results

Augmentation isn’t the future — it’s how industrial leaders are winning today. Stop by Booth 151 at AWS re:Invent 2025. See how to modernize with confidence. buff.ly/SXpGv1Z #sponsored #influxdata_iiot #InfluxDB @InfluxDB

If your AI model fails, don’t blame the algorithm — blame the pipes. This session dives into how time-series data architectures power predictive operations that work. Free registration closes Dec 3: buff.ly/M68nFKw #sponsored #influxdata_iiot #InfluxDB #Manufacturing

Your data pipeline shouldn’t be your bottleneck. See how #InfluxDB helps industrial teams scale without risking downtime. Visit the @InfluxDB team at AWS re:Invent 2025, Booth 151. buff.ly/SXpGv1Z #sponsored #influxdata_iiot #Industry40
Why replace your historian when you can augment it? #InfluxDB gives you the real-time performance Industry 4.0 demands. Stop by and see @InfluxDB in action at Booth 151. → Experience the difference live. buff.ly/SXpGv1Z #sponsored #influxdata_iiot #industry40
Latency. Bandwidth. Reliability. Edge computing is rewriting how industries move data. #InfluxDB is built for this new reality. See it in action at AWS re:Invent 2025 — Booth #151. buff.ly/SXpGv1Z #sponsored #influxdata_iiot #EdgeComputing
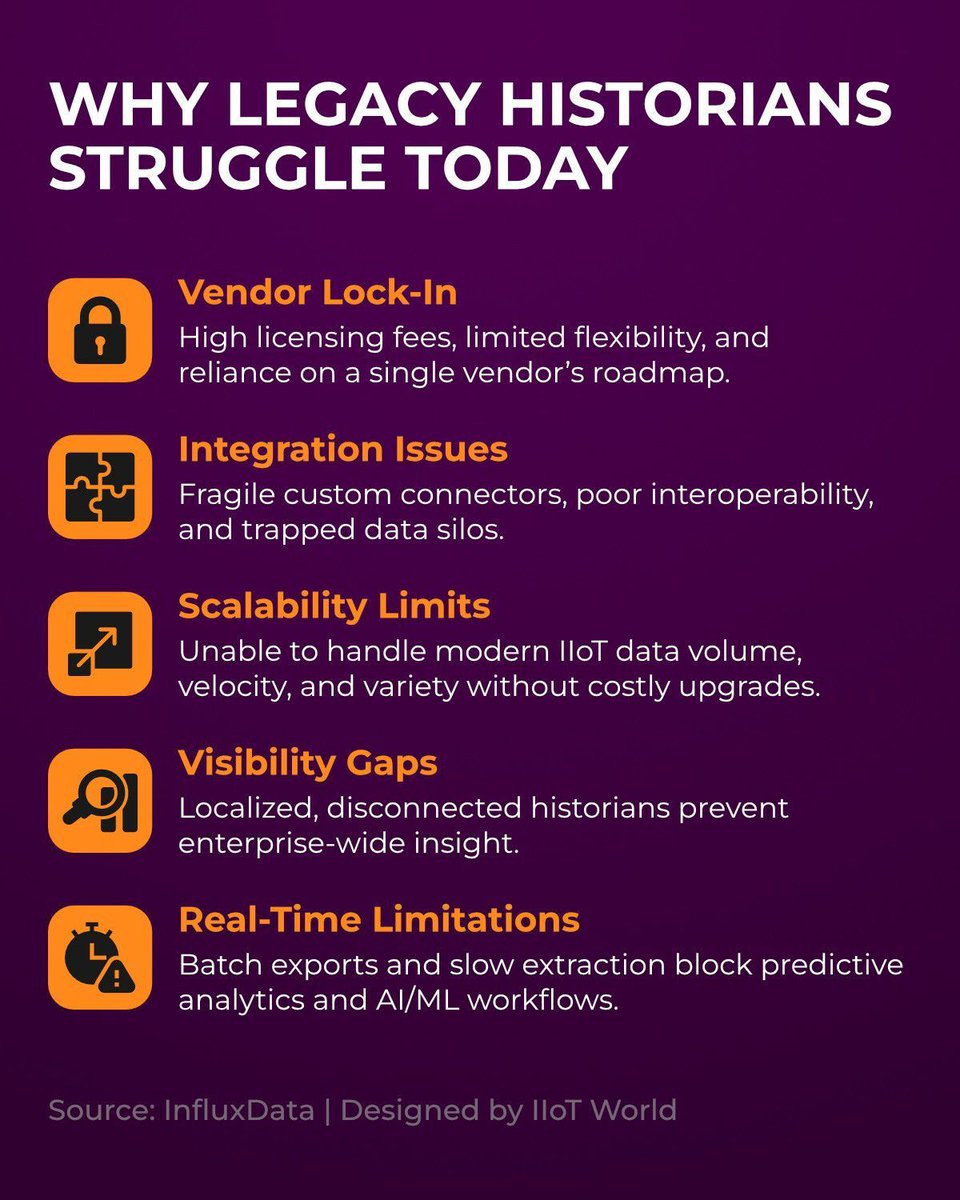
If your historian can’t scale, your insights can’t either. Vendor lock-in and silos can’t power Industry 4.0. Visit @InfluxDB at AWS re:Invent, Booth 151. See how augmentation unlocks visibility. buff.ly/SXpGv1Z #sponsored #influxdata_iiot #InfluxDB @IIoT_World

Most predictive pilots don’t die because of the math. They die because the data arrives late, dirty, or out of order. buff.ly/NwfEKGu #sponsored #influxdata_iiot #InfluxDB @lucianilie15 via @fogoros


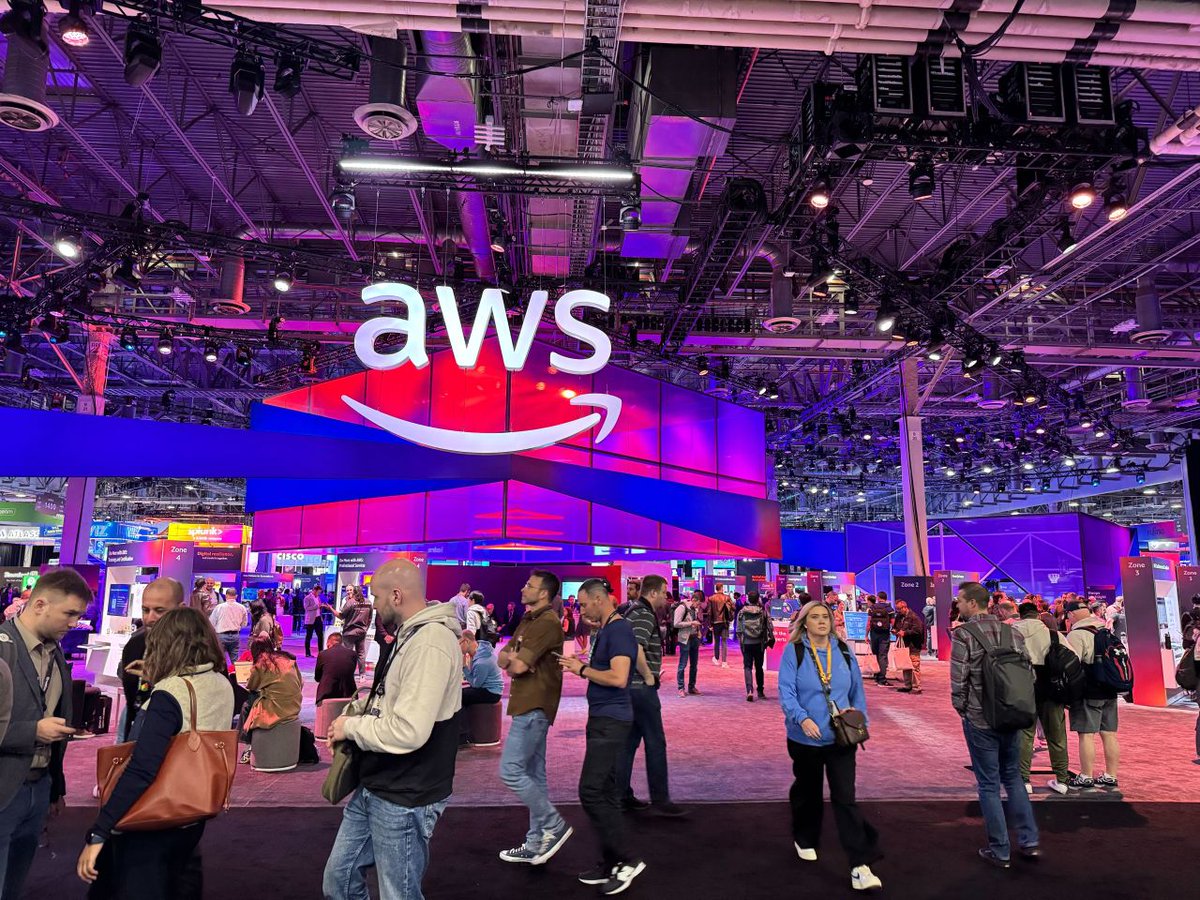
We’re just a couple of weeks away from #AWSreInvent and already gearing up for a big week in Vegas. Whether you’re building high-performance systems, working with sensor telemetry at scale, or just curious how #InfluxDB 3 handles real-time workloads, come by and put it to the…


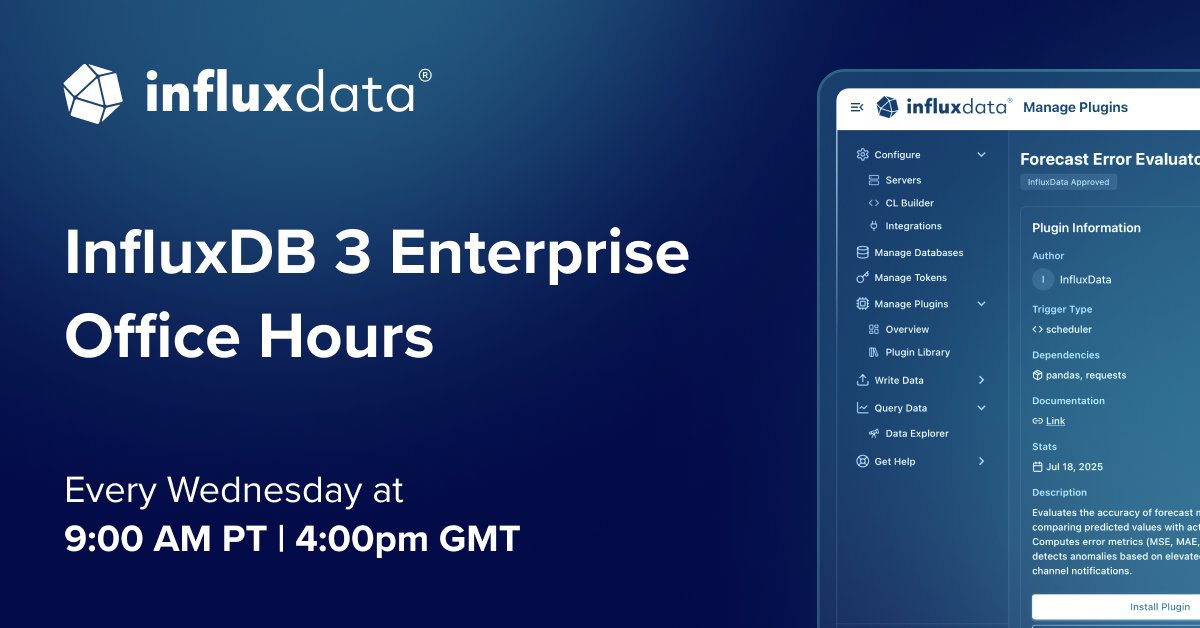
If you have questions about #InfluxDB 3 Enterprise, our team is here to help! Join us every Wednesday for open office hours with InfluxData experts. Whether you're troubleshooting, exploring features during your trial, or looking for best practices, bring your questions and…
Modernization doesn’t need a big-bang reboot — just smart steps forward. Join @InfluxDB at AWS re:Invent 2025, Booth 151. Start your journey with the right foundation. buff.ly/SXpGv1Z #sponsored #influxdata_iiot #InfluxDB #reinvent #Industry40 @FogorosAndrei @Lago72
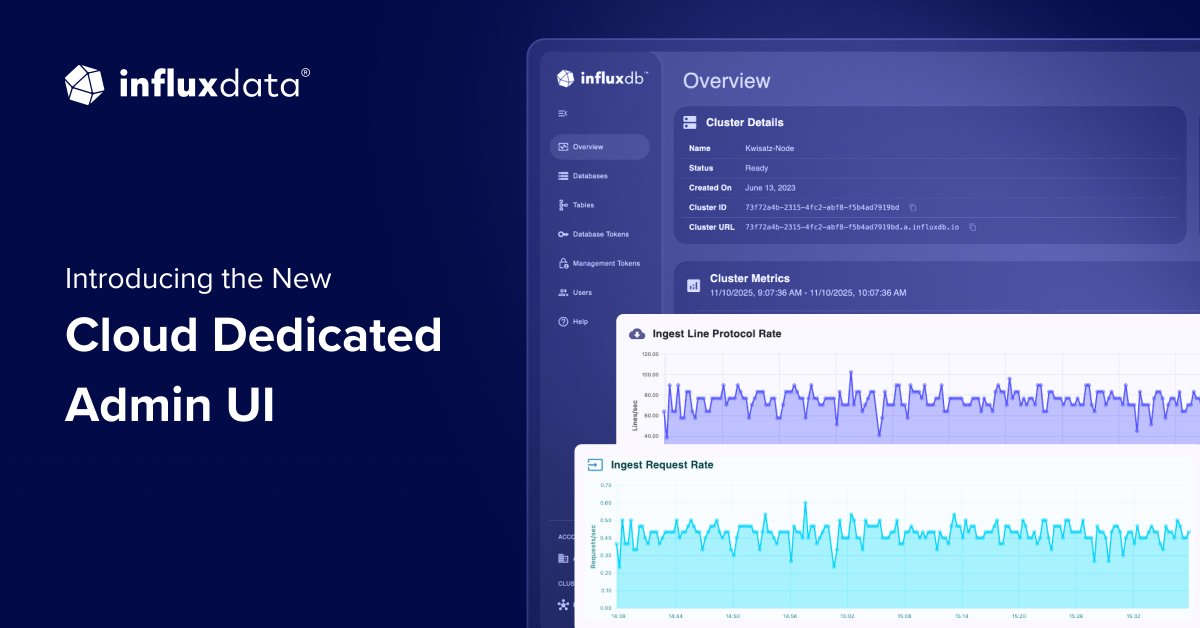
The new #InfluxDB Cloud Dedicated Admin UI is here, built for teams managing high-volume time series workloads. Get live observability metrics for your cluster, streamlined navigation between databases and tokens, and detailed table schema views, all in one place. Plus, easy…

![NoLabNoPartY's tweet image. [ Blog ] Monitoring #Proxmox with #InfluxDB and #Grafana bit.ly/4oHK8AP #monitor](https://pbs.twimg.com/media/G6y36YbXEAA6iUw.jpg)
#InfluxDB 3 embeds a Python VM directly in the database, allowing you to run analytics, anomaly detection, and forecasting right where your data resides. No extra pipelines, no data movement—just processing at the source with access to NumPy, Polars, and modern AI libraries.…

Factories. Pipelines. Satellites. Your data doesn’t live in the cloud anymore — it lives at the edge. #InfluxDB handles it with high-speed ingestion and reliable replication. Meet the team at AWS re:Invent 2025 — Booth #151. buff.ly/SXpGv1Z #sponsored #influxdata_iiot
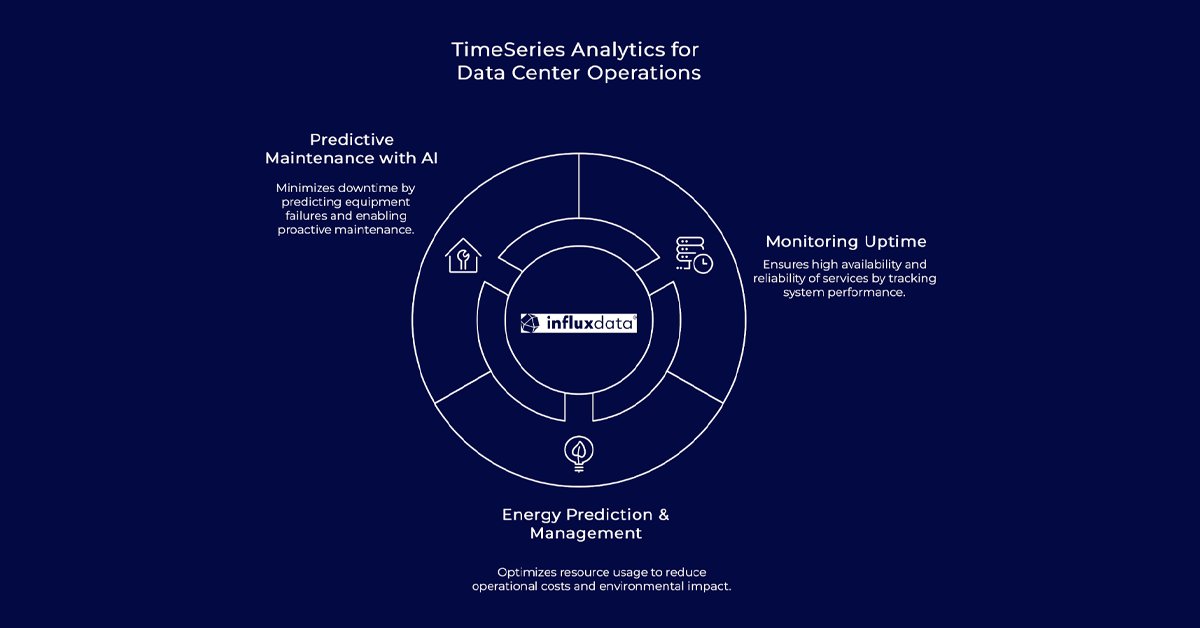
Data centers generate millions of metrics per second. Legacy monitoring systems can't keep up. #InfluxDB 3 handles the volume, cardinality, and latency, enabling real-time insights for PUE, uptime, and predictive maintenance without complex ETL pipelines. 👉…
What works today doesn’t have to slow down what’s next. Visit @InfluxDB at AWS re:Invent, Dec 1–5 — Booth 151. → Come see augmentation in action. buff.ly/SXpGv1Z #sponsored #influxdata_iiot #InfluxDB #Industry40 #DigitalTransformation @lucianilie15 @IIoT_World
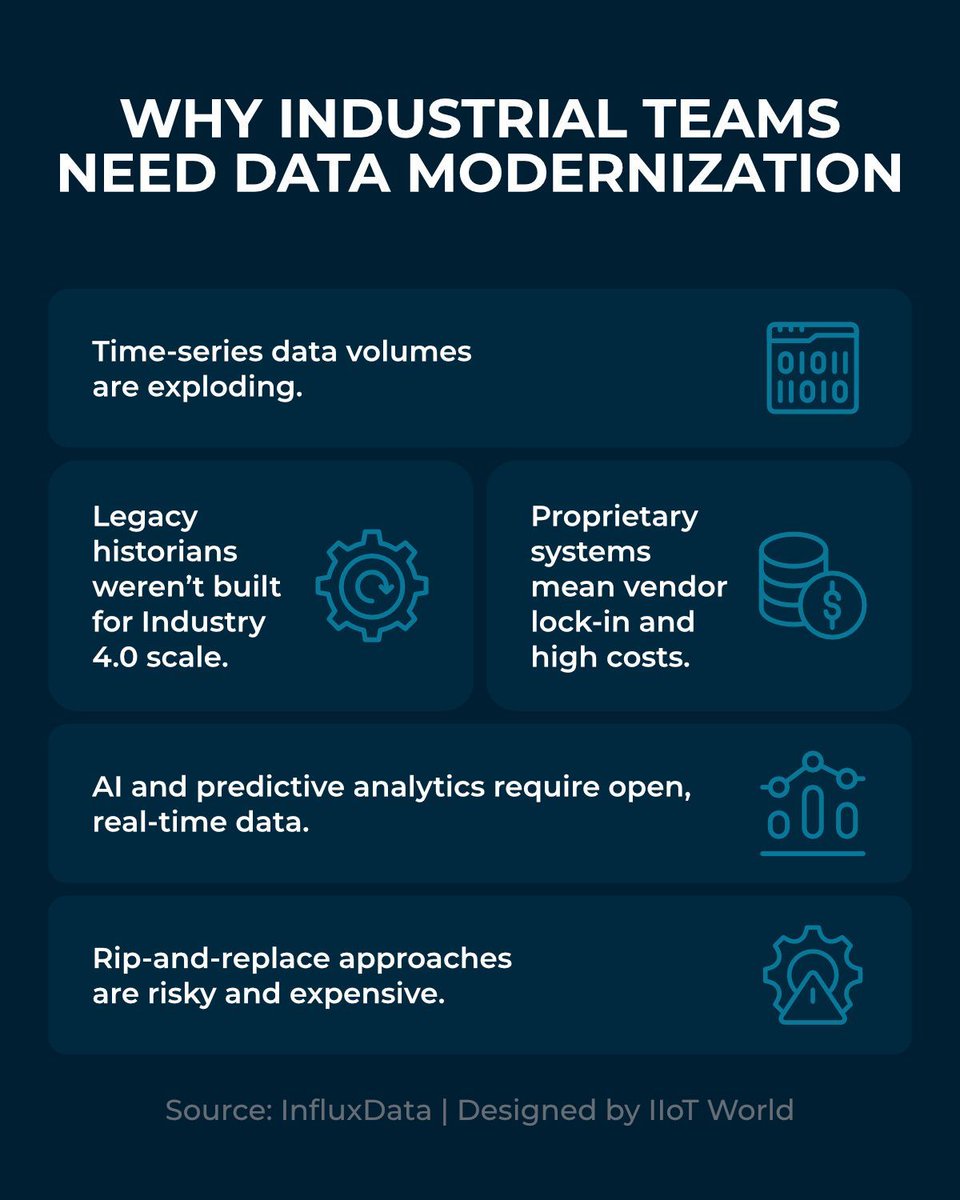
[Whitepaper] Modernizing Without Disruption A practical roadmap for handling industrial data growth—without replacing your existing systems. Download: buff.ly/4jTRGSs #sponsored #influxdata_iiot #InfluxDB #SmartFactories #Industry40 @jblefevre60 @ipfconline
![IIoT_World's tweet image. [Whitepaper] Modernizing Without Disruption
A practical roadmap for handling industrial data growth—without replacing your existing systems.
Download: buff.ly/4jTRGSs
#sponsored #influxdata_iiot #InfluxDB #SmartFactories #Industry40 @jblefevre60
@ipfconline](https://pbs.twimg.com/media/G6FgBUuWwAAGkqX.jpg)
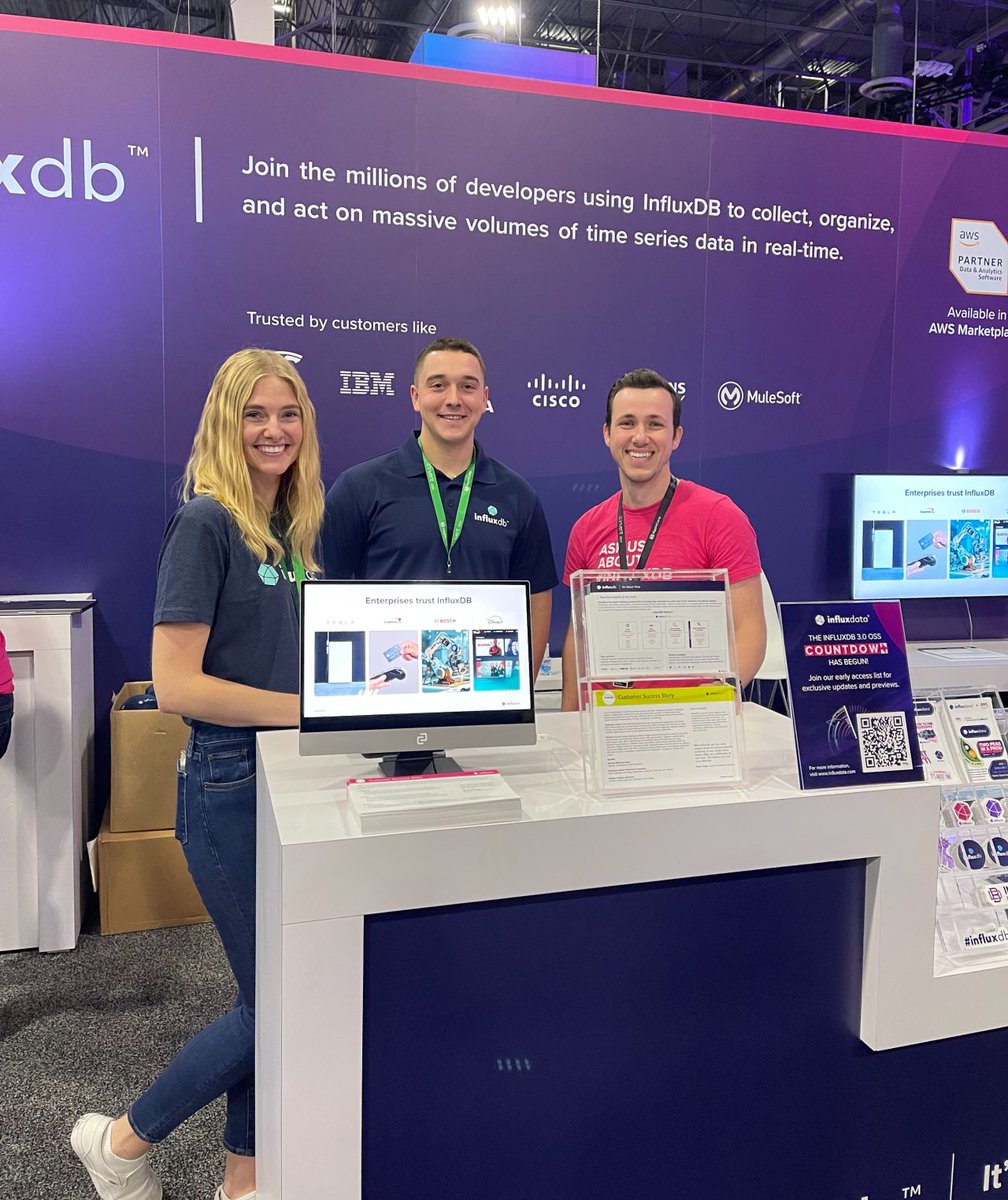
Viva Las Vegas! 🕺 Join us at AWS re:Invent, booth 151, and see how #InfluxDB simplifies complex data management, enabling high-speed ingestion, unlimited cardinality, and analytics at scale. tl;dr—we'll be showing off some really cool stuff at #AWSreInvent, and you should be…
Legacy systems weren’t designed for edge, cloud, AI, or Industry 4.0 scale. Modernization isn’t optional — it’s strategic. Explore what @InfluxDB can do for your data stack at AWS re:Invent, Booth 151. buff.ly/SXpGv1Z #sponsored #influxdata_iiot #InfluxDB #reinvent
Augmentation isn’t the future — it’s how industrial leaders are winning today. Stop by Booth 151 at AWS re:Invent 2025. See how to modernize with confidence. buff.ly/SXpGv1Z #sponsored #influxdata_iiot #InfluxDB @InfluxDB
If your historian can’t scale, your insights can’t either. Vendor lock-in and silos can’t power Industry 4.0. Visit @InfluxDB at AWS re:Invent, Booth 151. See how augmentation unlocks visibility. buff.ly/SXpGv1Z #sponsored #influxdata_iiot #InfluxDB @IIoT_World
What works today doesn’t have to slow down what’s next. Visit @InfluxDB at AWS re:Invent, Dec 1–5 — Booth 151. → Come see augmentation in action. buff.ly/SXpGv1Z #sponsored #influxdata_iiot #InfluxDB #Industry40 #DigitalTransformation @lucianilie15 @IIoT_World
If your AI model fails, don’t blame the algorithm — blame the pipes. This session dives into how time-series data architectures power predictive operations that work. Free registration closes Dec 3: buff.ly/M68nFKw #sponsored #influxdata_iiot #InfluxDB #Manufacturing
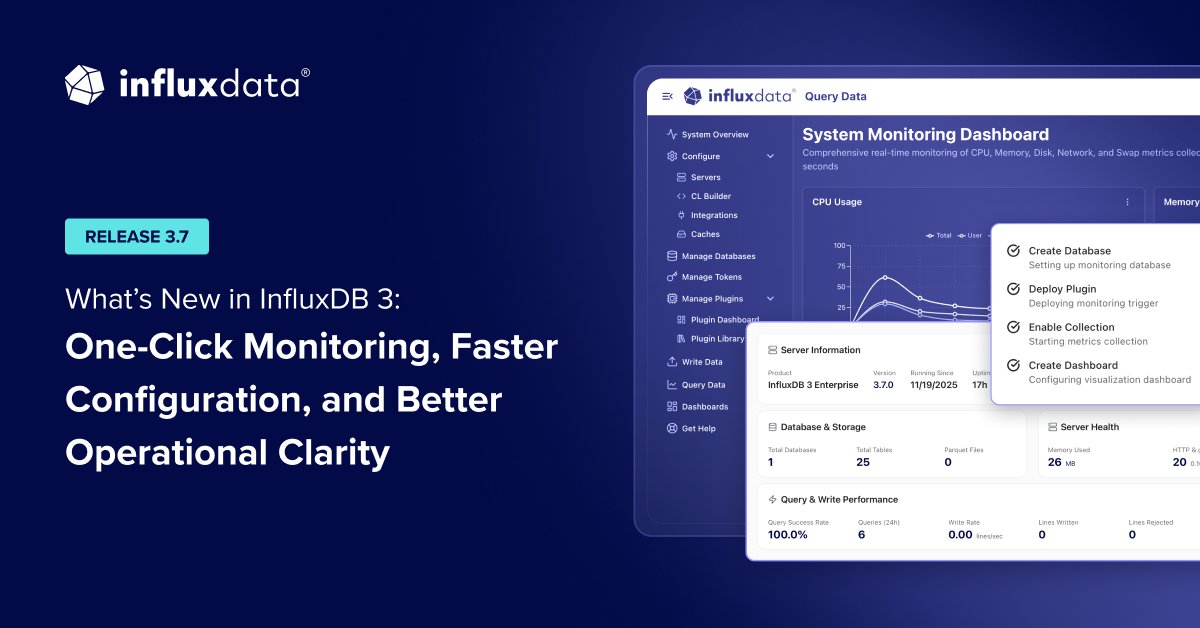
🔥 #InfluxDB 3.7 has dropped! Devs can now: • See your system instantly with one-click monitoring • Spin up fast with Docker Compose • Fine-tune Processing Engine triggers for full control Available for Core (OSS) & Enterprise. bit.ly/4ieRji6
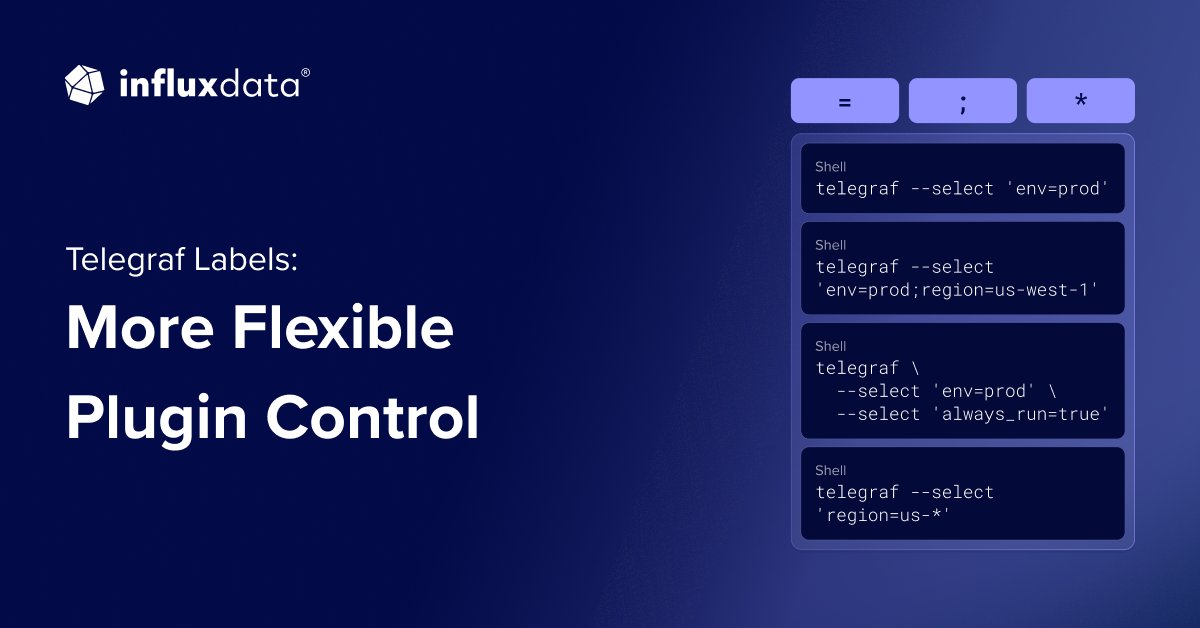
Telegraf 1.36 adds labels and selectors—attach metadata to plugins and control which ones run at startup. Perfect for managing multiple environments or rolling out features gradually! bit.ly/3KWlXAm #InfluxDB
Modernization doesn’t need a big-bang reboot — just smart steps forward. Join @InfluxDB at AWS re:Invent 2025, Booth 151. Start your journey with the right foundation. buff.ly/SXpGv1Z #sponsored #influxdata_iiot #InfluxDB #reinvent #Industry40 @FogorosAndrei @Lago72
Most predictive pilots don’t die because of the math. They die because the data arrives late, dirty, or out of order. buff.ly/NwfEKGu #sponsored #influxdata_iiot #InfluxDB @lucianilie15 via @fogoros
Legacy systems weren’t designed for edge, cloud, AI, or Industry 4.0 scale. Modernization isn’t optional — it’s strategic. Explore what @InfluxDB can do for your data stack at AWS re:Invent, Booth 151. buff.ly/SXpGv1Z #sponsored #influxdata_iiot #InfluxDB #reinvent
Most plants find problems only after they’ve already cost throughput. See what happens when you spot issues the moment they begin with #InfluxDB on AWS. Live at re:Invent, Booth 151. buff.ly/jTJ5DEA #sponsored #influxdata_iiot #reinvent @IIoT_World @lucianilie15
Real-time flight telemetry at 60 FPS isn't just a gaming flex—it's a blueprint for enterprise aviation systems! ✈️ We built a complete pipeline: FSUIPC → C# bridge → #InfluxDB 3 Enterprise → live dashboards with sub-10ms queries. Check it out here: bit.ly/46teiCe
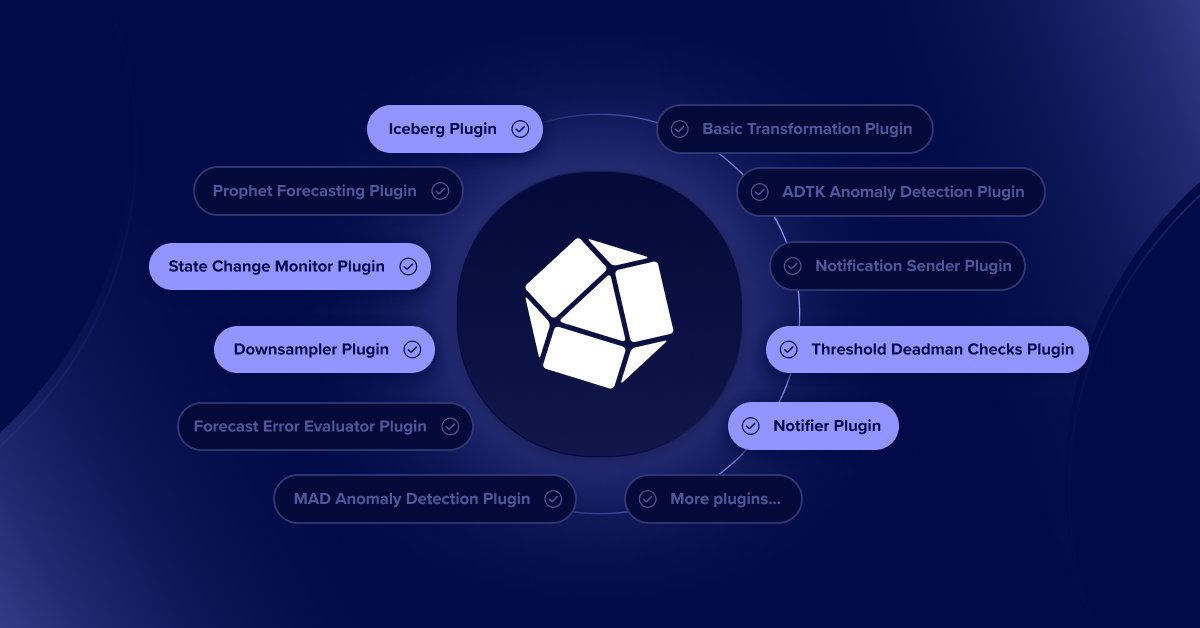
The #InfluxDB 3 plugin ecosystem is packed with tools for smarter data workflows. Export to Iceberg, detect anomalies, send alerts, or downsample data, all in one flexible system built to manage your time series data in motion. bit.ly/4nGlPTN
#InfluxDB 3 Core and Enterprise run on a stateless, “diskless” architecture that separates compute from storage and persists all data to object storage like S3 or GCS. The result? Simpler ops, horizontal scaling, and built-in durability. No clustering logic or data replication…
Latency. Bandwidth. Reliability. Edge computing is rewriting how industries move data. #InfluxDB is built for this new reality. See it in action at AWS re:Invent 2025 — Booth #151. buff.ly/SXpGv1Z #sponsored #influxdata_iiot #EdgeComputing
Why replace your historian when you can augment it? #InfluxDB gives you the real-time performance Industry 4.0 demands. Stop by and see @InfluxDB in action at Booth 151. → Experience the difference live. buff.ly/SXpGv1Z #sponsored #influxdata_iiot #industry40
Time series data has unique characteristics that set it apart from other data types. Explore the fundamentals and why they matter for how you build and scale your applications. #InfluxDB youtube.com/watch?v=wBWTj-…

youtube.com
YouTube
InfluxDB: The Basics of Time Series Data
Not all metrics are worth keeping. Learn how Telegraf filters let you decide what data makes it through so you only store what actually matters. 📊 #InfluxDB
Build time series forecasting without writing code! 🤩 This tutorial shows how to predict Wikipedia page views using #InfluxDB 3 Core's Python Processing Engine and Prophet—all implemented through LLM prompts: bit.ly/45uYU7K via @thenewstack

The TIG stack (Telegraf, #InfluxDB 3, Grafana) gives you a complete pipeline for collecting, storing, and visualizing time series data. This tutorial walks through setup and configuration for monitoring CPU metrics: bit.ly/4kyKI2c via @thenewstack


Augmentation isn’t the future — it’s how industrial leaders are winning today. Stop by Booth 151 at AWS re:Invent 2025. See how to modernize with confidence. buff.ly/SXpGv1Z #sponsored #influxdata_iiot #InfluxDB @InfluxDB

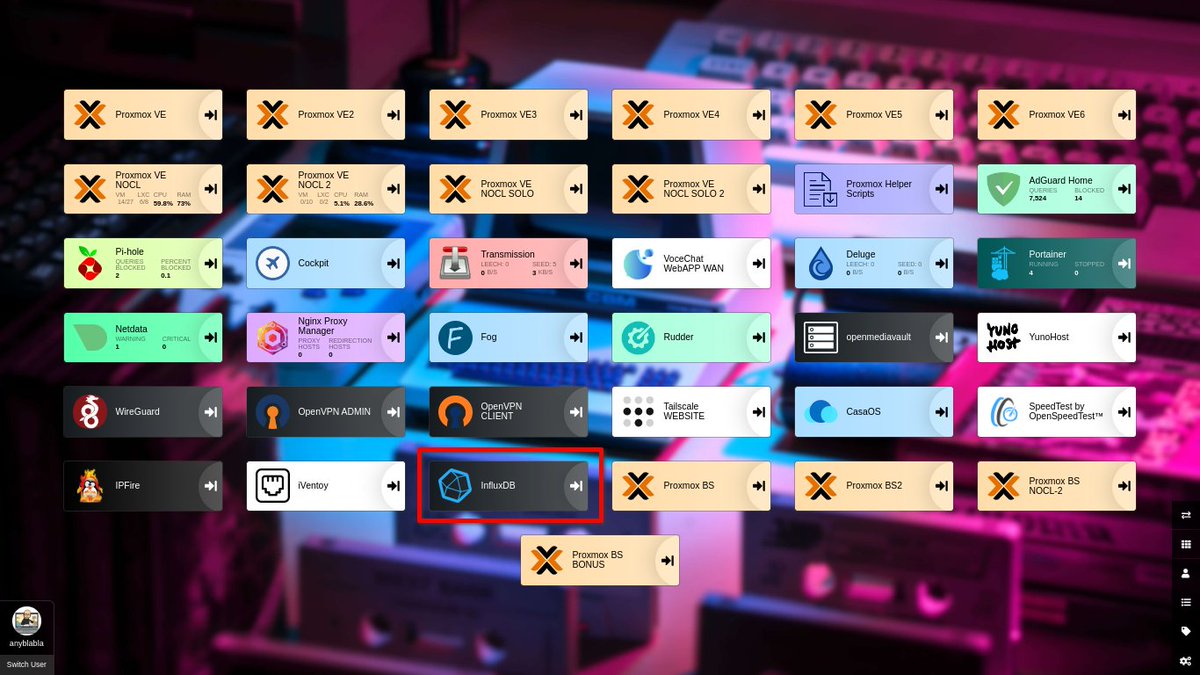
#Proxmox VE - Serveur de #métriques #InfluxDB et le gestionnaire de #graphiques #Grafana 😉 Je suis donc passé à la pratique (😜), et rien de compliqué 👍


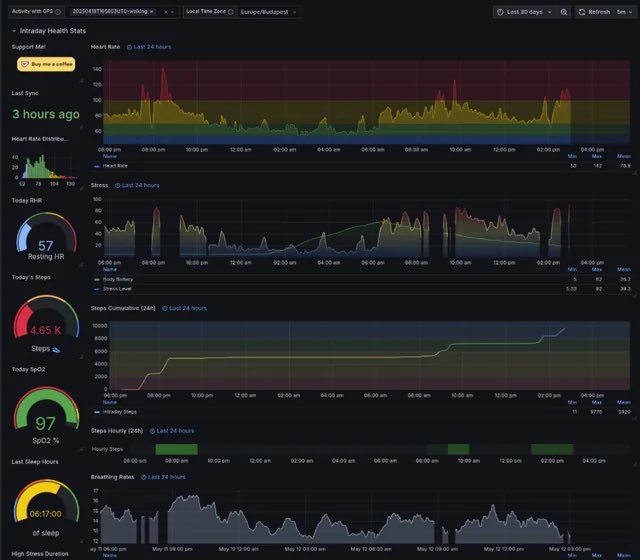
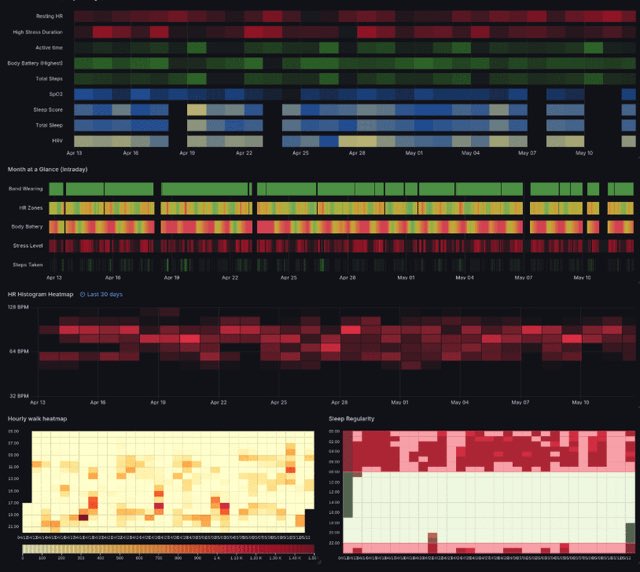
“A docker container to fetch data from #Garmin servers and store the data in a local #influxdb database for appealing visualization with #Grafana” eh gimana.. Unlike #Strava or other similar application tracking only recorded exercises, this project can extract everything…


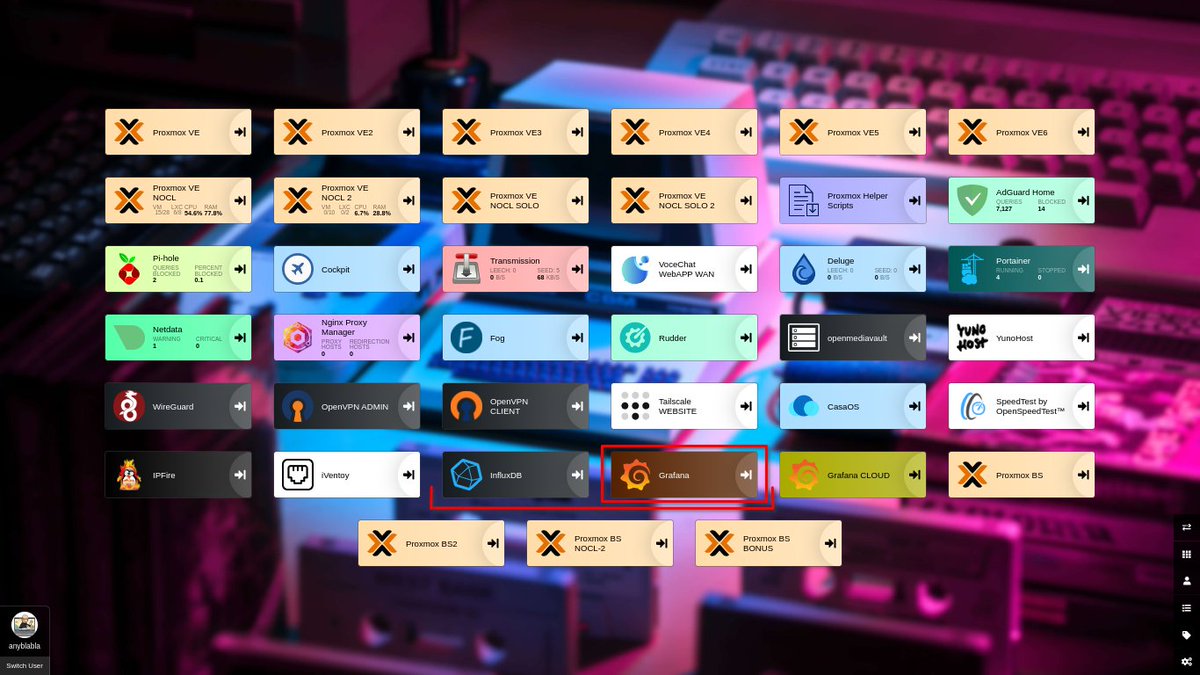
Nouveau service ❗ Et oui, encore 😜 Serveur de métriques #InfluxDB pour le petit cluster Proxmox 🤙 Pour visualiser toutes ses données, #Grafana va bientôt faire son entrée 😎 Le deuxième petit et le grand, c'est pour plus tard 😁


Monitoring trafficu na mikrotiku: - skript v mikrotiku spouštěný schedulerem každých 5s - data ukládá přímo do InfluxDB - vizualizace v Grafaně Data obsahují sumu přenesených bajtů na daném interface, v Grafaně to jde pak nad InfluxDB skvěle analyzovat. #Grafana #InfluxDB…


Found an old people picture of my AireOS monitoring dashboard. 187 clients on a single 5GHz radio! How is that possible. I tell you. It depends. #PhoneInPocket #Grafana #InfluxDB #CiscoChampion


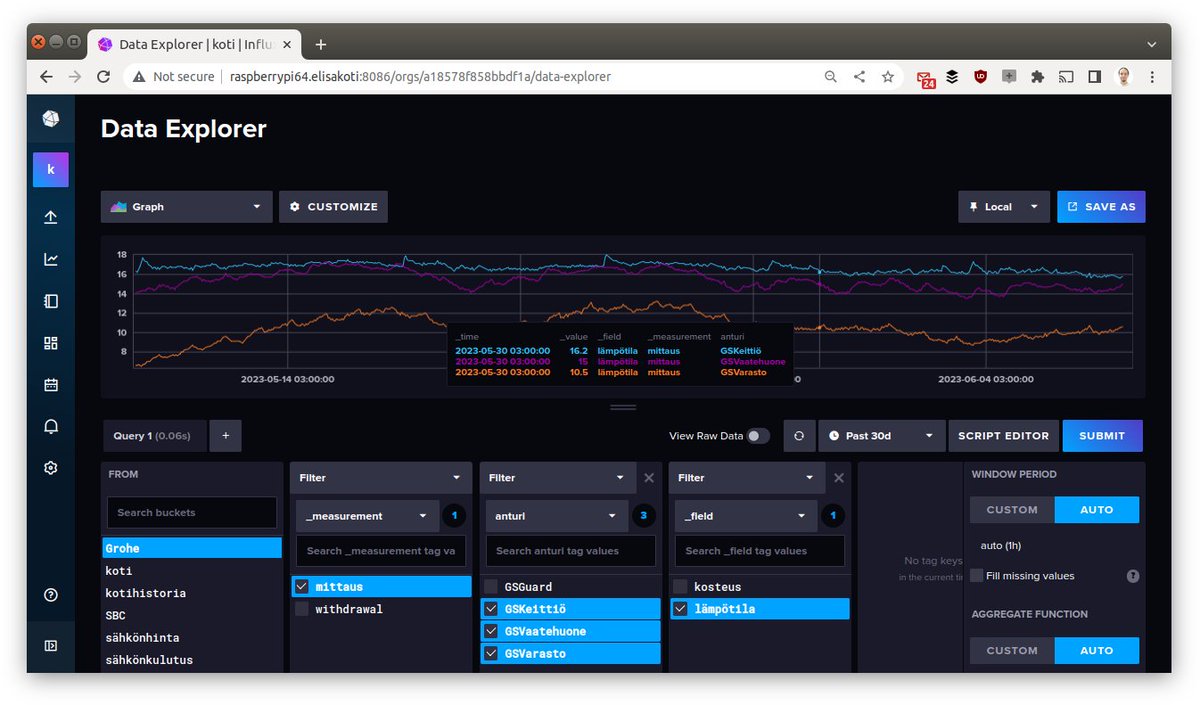
Nyt sujahtaa mittaus- ja ilmoitustiedot Grohe-laitteilta InfluxDB-kantaan ja kotiautomaatiojärjestelmääni. Mittaustietoja on mm. ilmankosteudet, lämpötilat, veden paine, veden kulutus ja veden maksimivirtaus. #ohjelmointi #kotiautomaatio #influxdb #python #grohe

Everything ready for my little weekend project: collecting the data of the solar converter in #InfluxDB, visualizing it with #Grafana, running everything on a Raspberry Pi. Was about time for that thing to become affordable again 🤓.

The Cost of Bad Data: Why Time Series Integrity Matters More Than You Think #sponsored #influxdata_iiot #InfluxDB

#Proxmox VE - Nouveau service ❗❓ #Grafana se chargera de réaliser les tableaux de bord grâce aux bases de données en provenances d' #InfluxDB 😉 C'est beau la théorie, maintenant, il ne reste plus qu'à mettre ça en pratique 😜


尝试 Revise 了一下 GreptimeDB 的 README .. github.com/GreptimeTeam/g… 结合了 @DatabendLabs 的先进经验和同类产品的一些表述,突出 GreptimeDB 能替换 #InfluxDB 和作为 #Prometheus 云后端的能力。 其实我是前几天才知道 InfluxDB 这么常用的 .. Prometheus 倒是指标上报标配了。


🎙️Double release on #AWSDevelopers Podcast! 🎉 @thedavedev & I explore #TimeSeries data with Jay Clifford, Dev Advocate @InfluxDB, in a 2-part interview! Learn about #InfluxDB, data management, best practices, & real-world success stories! 🌟 🎧 Ep 1: bit.ly/3MmOEFa…


I'm very excited about the new Processing Engine with #InfluxDB 3. It allows you to execute Python code in InfluxDB on data ingest, on a schedule, or in response to an HTTP call. It also appears the plugin system will be replacing Telegraf in the future 😯. Check out more here:…


🚀 Performance #Monitoring leicht gemacht! Heute und morgen findet unsere #InfluxDB & #Grafana Schulung mal wieder bei uns vor Ort in Nürnberg statt. Wir freuen uns über motivierte Teilnehmer und zwei Tage voller erstklassigem Praxiswissen!

Thank you to #NDCOslo for showing up for my Time Series Data talk! Lots of great questions after. If you like the github repo check it out: github.com/Quorralyne/DeL… #influxdb


Who's ready for some time series data talk with a dash of cinema? join me at 10:10am in room 2 and we'll jump into it! #dotnetdayswitzerland #influxdb #sql #dotnet #delorean


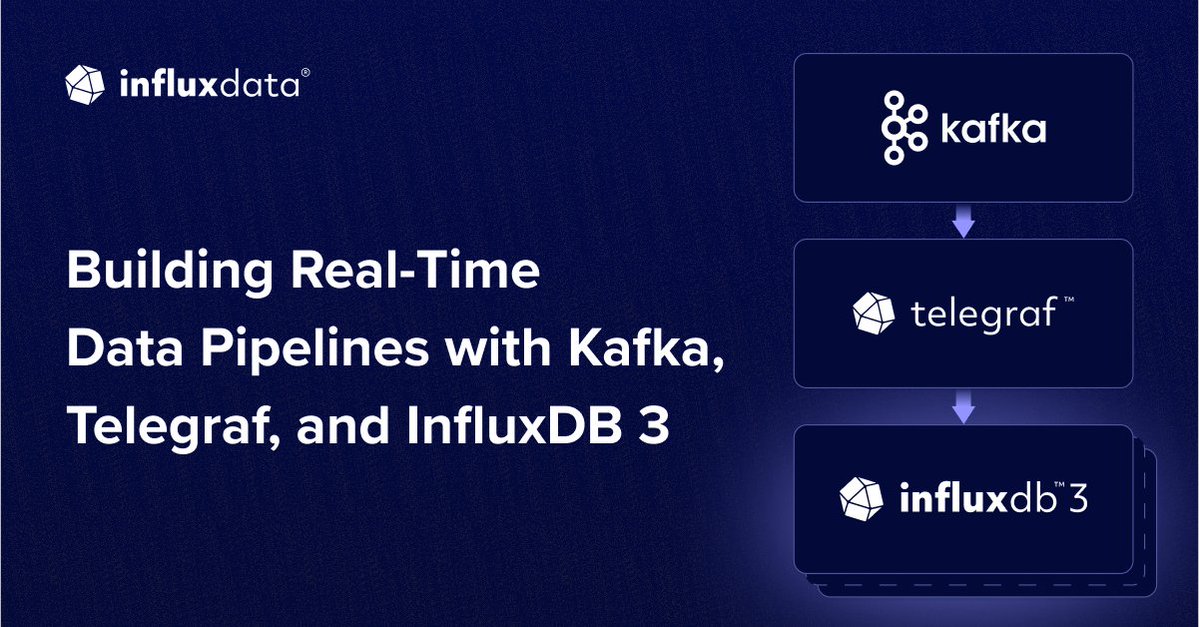
Together, Kafka, Telegraf, and #InfluxDB 3 Core deliver a pipeline that can handle high-velocity data with reliability and scale. 🍕 Step into our fictitious pizza shop use case, where every oven, prep station, and order generates data. 1: Customers = Events 2: Waitstaff =…
Today we released #InfluxDB 3.2 in open source Core and Enterprise. Retention policies are back, and, for Enterprise customers, per table retention policies have arrived! We've also reached GA for InfluxDB 3 Explorer, our all new UI for working with InfluxDB 3!

That's a wrap for @hannover_messe #hm25 🇩🇪 What a huge tech event! Great connections and lots of innovative possibilities. #InfluxDB

Something went wrong.
Something went wrong.
United States Trends
- 1. #lip_bomb_RESCENE N/A
- 2. #River 3,687 posts
- 3. Ravens 58.7K posts
- 4. Lamar 46.5K posts
- 5. #heatedrivalry 16.1K posts
- 6. ilya 17.4K posts
- 7. Shane 20.8K posts
- 8. Joe Burrow 21.2K posts
- 9. Hudson 11.9K posts
- 10. Connor 15.1K posts
- 11. #WhoDey 4,218 posts
- 12. BNB Chain 8,049 posts
- 13. Zay Flowers 4,207 posts
- 14. #hrspoilers 3,581 posts
- 15. Sarah Beckstrom 225K posts
- 16. scott hunter N/A
- 17. Third World Countries 28.2K posts
- 18. Derrick Henry 4,491 posts
- 19. AFC North 2,368 posts
- 20. Harbaugh 3,213 posts