#influxdb search results

#InfluxDB 3.6 is live with Ask AI now in beta! Query your time series data in plain English—no SQL required, just answers. 💬 Try: “Show CPU usage by region over the last hour.” Available now in Explorer 1.4 for both Core and Enterprise: bit.ly/4odfGPb

MuleSoft monitors 12+ billion API transactions using #InfluxDB as the core data infrastructure for Anypoint Platform™. Modern businesses route digital transactions across 35+ backend systems on average, and legacy monitoring tools can't keep up with that complexity. @MuleSoft…


The Cost of Bad Data: Why Time Series Integrity Matters More Than You Think #sponsored #influxdata_iiot #InfluxDB


Historians are great for local data collection, but they create silos that block insights and slow decisions. Pairing #InfluxDB 3 with your historian breaks down those barriers, enabling real-time analysis, long-term forecasting, and scalable data access across your entire…

Power BI users, your wait is over! ⚡ The #InfluxDB 3 ODBC connector for Power BI Desktop is here. Pull time series data straight from InfluxDB 3 into your dashboards with DirectQuery support. Check out the full setup guide. 👇 bit.ly/3X8ezV3


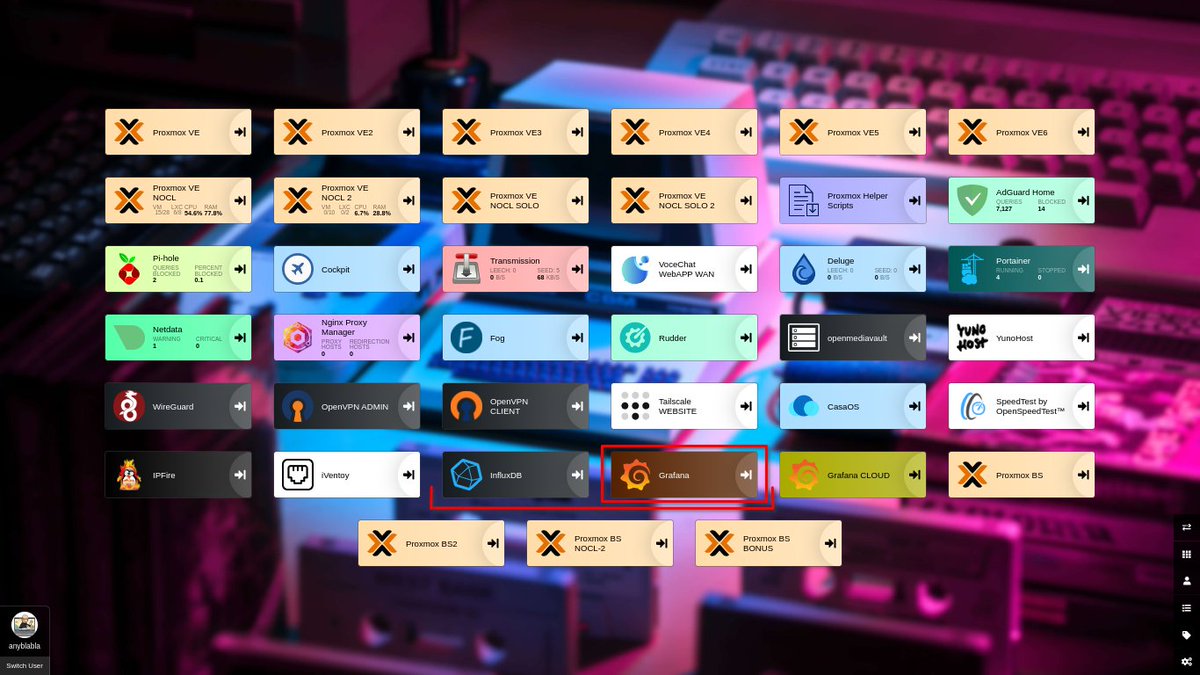
#Proxmox VE - Serveur de #métriques #InfluxDB et le gestionnaire de #graphiques #Grafana 😉 Je suis donc passé à la pratique (😜), et rien de compliqué 👍


Nouveau service ❗ Et oui, encore 😜 Serveur de métriques #InfluxDB pour le petit cluster Proxmox 🤙 Pour visualiser toutes ses données, #Grafana va bientôt faire son entrée 😎 Le deuxième petit et le grand, c'est pour plus tard 😁


Monitoring trafficu na mikrotiku: - skript v mikrotiku spouštěný schedulerem každých 5s - data ukládá přímo do InfluxDB - vizualizace v Grafaně Data obsahují sumu přenesených bajtů na daném interface, v Grafaně to jde pak nad InfluxDB skvěle analyzovat. #Grafana #InfluxDB…


#InfluxDB 3 users now have more visualization options than ever before! 𝗔𝗱𝘃𝗮𝗻𝗰𝗲𝗱, 𝗰𝘂𝘀𝘁𝗼𝗺𝗶𝘇𝗮𝗯𝗹𝗲 𝗱𝗮𝘀𝗵𝗯𝗼𝗮𝗿𝗱𝘀 → Grafana with enhanced InfluxDB 3 integration 𝗤𝘂𝗶𝗰𝗸, 𝗯𝘂𝗶𝗹𝘁-𝗶𝗻 𝘃𝗶𝘀𝘂𝗮𝗹𝗶𝘇𝗮𝘁𝗶𝗼𝗻 → Native dashboards in Cloud…


From vibration to temperature to sound — every metric speaks. Time series makes it possible to translate them. buff.ly/gmS60Gs #sponsored #influxdata_iiot #InfluxDB #Industry40 @lucianilie15 via @IIoT_World


Found an old people picture of my AireOS monitoring dashboard. 187 clients on a single 5GHz radio! How is that possible. I tell you. It depends. #PhoneInPocket #Grafana #InfluxDB #CiscoChampion


Everything ready for my little weekend project: collecting the data of the solar converter in #InfluxDB, visualizing it with #Grafana, running everything on a Raspberry Pi. Was about time for that thing to become affordable again 🤓.

UNE VIDÉO, C'EST MIEUX 😮 #Proxmox VE - Serveur de #métriques #InfluxDB et le gestionnaire de #graphiques #Grafana 😉 Je suis donc passé à la pratique (😜), et rien de compliqué 👍
#InfluxDB 3's Python Processing Engine lets you run custom plugins for real-time data processing. Five ready-to-use plugins: 🔌 Prophet forecasting 🔌 Deadman alerts 🔌 SMS/WhatsApp notifications 🔌 Data replication 🔌 Auto-aggregation All open source and ready to customize!…


Habe übers Wochenende einen ersten Wurf für die Darstellung der in Homeassistant erfassten Daten gemacht. Sehr cool, das sich so etwas so schnell auf die Beine stellen lässt. Gemacht mit #react #r3f und #influxdb query api.
Time series data is everywhere, and it’s growing by the second. #InfluxDB gives you a fully managed, serverless platform to turn that data into real value. No servers to manage. No scaling limits. One API across the entire suite. 🔽

尝试 Revise 了一下 GreptimeDB 的 README .. github.com/GreptimeTeam/g… 结合了 @DatabendLabs 的先进经验和同类产品的一些表述,突出 GreptimeDB 能替换 #InfluxDB 和作为 #Prometheus 云后端的能力。 其实我是前几天才知道 InfluxDB 这么常用的 .. Prometheus 倒是指标上报标配了。


From vibration to temperature to sound — every metric speaks. Time series makes it possible to translate them. buff.ly/gmS60Gs #sponsored #influxdata_iiot #InfluxDB #Industry40 @lucianilie15 via @IIoT_World
MuleSoft monitors 12+ billion API transactions using #InfluxDB as the core data infrastructure for Anypoint Platform™. Modern businesses route digital transactions across 35+ backend systems on average, and legacy monitoring tools can't keep up with that complexity. @MuleSoft…
The #InfluxDB Python client library makes querying data straightforward for Python developers. Learn about the different options and settings to get your queries running efficiently. 👇 youtube.com/watch?v=MvVsBB…

youtube.com
YouTube
Querying Data with InfluxDB's Python Client Library
Power BI users, your wait is over! ⚡ The #InfluxDB 3 ODBC connector for Power BI Desktop is here. Pull time series data straight from InfluxDB 3 into your dashboards with DirectQuery support. Check out the full setup guide. 👇 bit.ly/3X8ezV3
Need to populate dropdown menus or dashboard variables with tag values? The Distinct Value Cache in #InfluxDB 3 returns distinct column values in under 30ms — no full table scans, no time bounds needed. Just fast, in-memory queries. 👇 bit.ly/3WwFRV3

#InfluxDB 3.6 is live with Ask AI now in beta! Query your time series data in plain English—no SQL required, just answers. 💬 Try: “Show CPU usage by region over the last hour.” Available now in Explorer 1.4 for both Core and Enterprise: bit.ly/4odfGPb
🔊 Boston devs! Join the @ApacheDataFusio community on November 12th at @datadoghq's office. Dive into lightning talks on performance innovations, panel discussions, and networking with folks building modern data infrastructure: lu.ma/w9pw5rce #InfluxDB

Edge processing, hybrid architectures, and AI-driven analytics. Evan Kaplan, CEO of InfluxData, breaks down how time series data is reshaping industrial operations on the IT/OT Insider Podcast. #InfluxDB bit.ly/41VkG1a
🐌 Slow queries. Missed alerts. Tool sprawl. The wrong database doesn't just hurt performance—it multiplies costs and risks over time. Here's what happens when your data stack can't keep up with modern workloads: bit.ly/3JpYs1I #InfluxDB

#InfluxDB 3's Distinct Value Cache lets you query distinct tag values in under 30ms—no full table scans, no awkward time bounds. 📊 Perfect for populating dropdowns and Grafana variables without the performance hit! bit.ly/3WwFRV3
Your Python scripts can now run directly inside #InfluxDB 3—no external processors, no tool sprawl, just faster time series processing at the source. ⚡ Filter, transform, and act on data the moment it arrives. ↴ bit.ly/4lVKgLN

✅ Client libraries let you work with #InfluxDB using the languages you already know. This video breaks down what they are, how they work, and why they make your life easier. ⬇️ youtube.com/watch?v=2q-Qbv…

youtube.com
YouTube
Intro to Client Libraries in InfluxDB

Supercharge your Home Assistant! 🚀 Learn to optimize the Recorder component, prevent database bloat, and ensure long-term data analysis. newerest.space/mastering-home… #HomeAssistant #SmartHome #InfluxDB

Hoyo Tech manages 1,300+ IoT sensors across smart homes and offices using #InfluxDB. 🤩 Join us on November 13th to hear how they built secure, cloud-optional systems that deliver real-time insights for connected environments. ➡️ bit.ly/3JrwiDM

Modern energy grids stream millions of measurements per second—voltage shifts, current spikes, temperature changes. To make sense of it all, you need real-time performance and scale. #InfluxDB 3 on Amazon Timestream brings sub-10 ms queries and unlimited cardinality to AWS.…

Developers used to need separate tools for alerts, ETL pipelines, and data transformation. Now you can run Python directly inside #InfluxDB 3; right where your time series lives. No extra infrastructure, no network latency. 👉 bit.ly/4mFcL1C via @InfoWorld by…

Upgrading from #InfluxDB 3 Core to Enterprise is simple! Point Enterprise at the same object store Core uses—no data migration needed. Get high availability, long-range queries, enhanced security, and multi-node deployment. 👇 bit.ly/3JNAvlj

Historians keep OT stable. #InfluxDB 3 makes data open, scalable, and ready for IIoT. See how pairing them delivers real-time insights without a costly overhaul. ↴ bit.ly/46brqLG

Time series data powers the systems that never sleep. This paper breaks down what it is, how it differs from stream processing, and how to build real-time analytics that perform at scale: bit.ly/46f7YLl #InfluxDB

When IoT scales, data doesn’t stay put—it moves. #InfluxDB runs seamlessly across edge and cloud with one API, so you decide where it lives and how it flows.


The Cost of Bad Data: Why Time Series Integrity Matters More Than You Think #sponsored #influxdata_iiot #InfluxDB
#Proxmox VE - Serveur de #métriques #InfluxDB et le gestionnaire de #graphiques #Grafana 😉 Je suis donc passé à la pratique (😜), et rien de compliqué 👍
Nouveau service ❗ Et oui, encore 😜 Serveur de métriques #InfluxDB pour le petit cluster Proxmox 🤙 Pour visualiser toutes ses données, #Grafana va bientôt faire son entrée 😎 Le deuxième petit et le grand, c'est pour plus tard 😁
Found an old people picture of my AireOS monitoring dashboard. 187 clients on a single 5GHz radio! How is that possible. I tell you. It depends. #PhoneInPocket #Grafana #InfluxDB #CiscoChampion

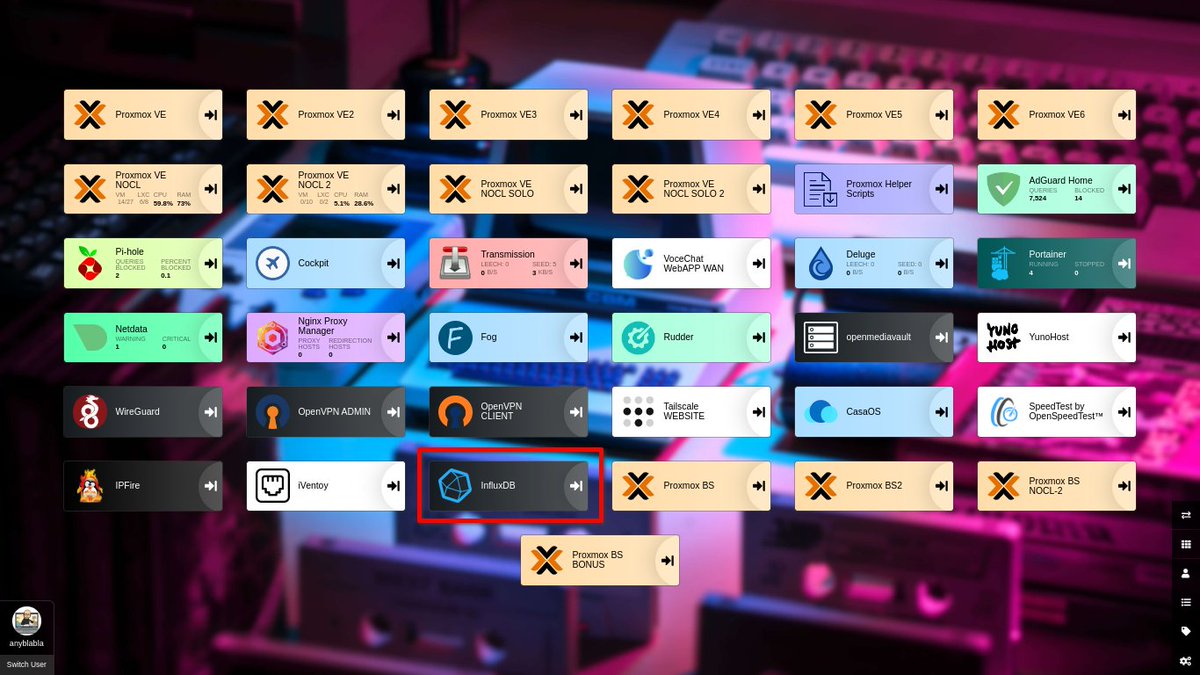
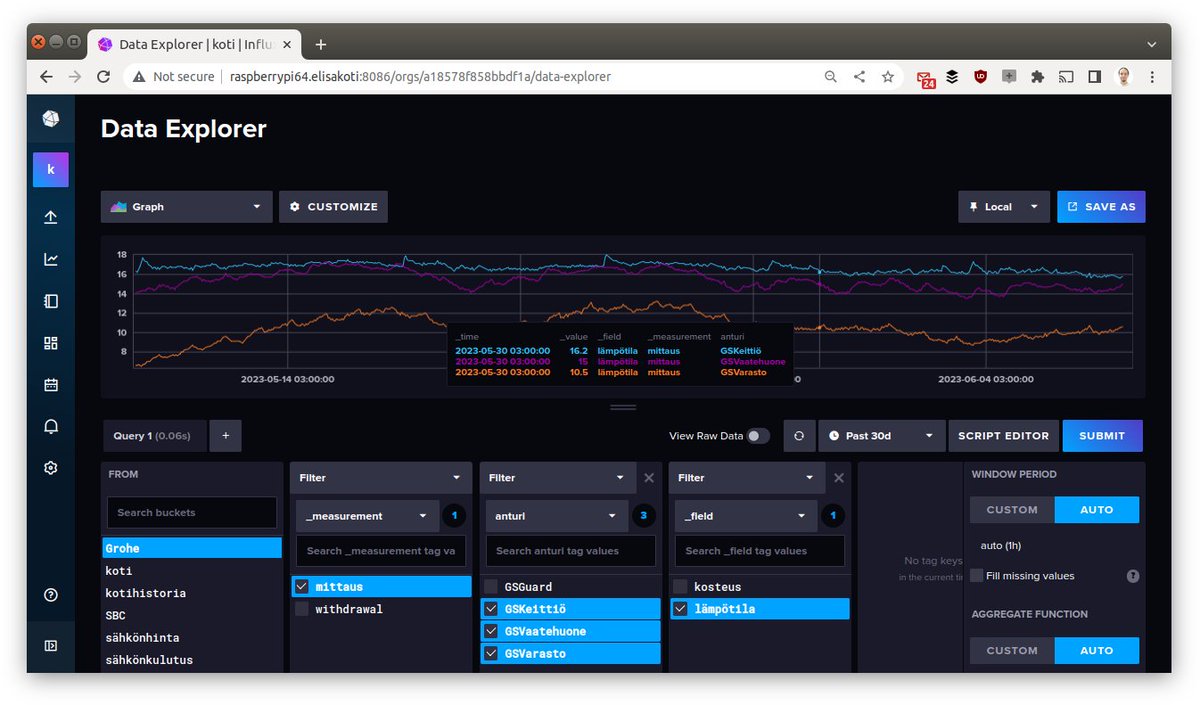
Nyt sujahtaa mittaus- ja ilmoitustiedot Grohe-laitteilta InfluxDB-kantaan ja kotiautomaatiojärjestelmääni. Mittaustietoja on mm. ilmankosteudet, lämpötilat, veden paine, veden kulutus ja veden maksimivirtaus. #ohjelmointi #kotiautomaatio #influxdb #python #grohe
Monitoring trafficu na mikrotiku: - skript v mikrotiku spouštěný schedulerem každých 5s - data ukládá přímo do InfluxDB - vizualizace v Grafaně Data obsahují sumu přenesených bajtů na daném interface, v Grafaně to jde pak nad InfluxDB skvěle analyzovat. #Grafana #InfluxDB…
#Proxmox VE - Nouveau service ❗❓ #Grafana se chargera de réaliser les tableaux de bord grâce aux bases de données en provenances d' #InfluxDB 😉 C'est beau la théorie, maintenant, il ne reste plus qu'à mettre ça en pratique 😜


Everything ready for my little weekend project: collecting the data of the solar converter in #InfluxDB, visualizing it with #Grafana, running everything on a Raspberry Pi. Was about time for that thing to become affordable again 🤓.
MuleSoft monitors 12+ billion API transactions using #InfluxDB as the core data infrastructure for Anypoint Platform™. Modern businesses route digital transactions across 35+ backend systems on average, and legacy monitoring tools can't keep up with that complexity. @MuleSoft…
尝试 Revise 了一下 GreptimeDB 的 README .. github.com/GreptimeTeam/g… 结合了 @DatabendLabs 的先进经验和同类产品的一些表述,突出 GreptimeDB 能替换 #InfluxDB 和作为 #Prometheus 云后端的能力。 其实我是前几天才知道 InfluxDB 这么常用的 .. Prometheus 倒是指标上报标配了。

🎙️Double release on #AWSDevelopers Podcast! 🎉 @thedavedev & I explore #TimeSeries data with Jay Clifford, Dev Advocate @InfluxDB, in a 2-part interview! Learn about #InfluxDB, data management, best practices, & real-world success stories! 🌟 🎧 Ep 1: bit.ly/3MmOEFa…

Beyond features: What really matters when choosing a technology partner? In this guide, learn what to look for—from edge to cloud—to build a scalable, future-ready industrial stack. buff.ly/k1vXzLt #sponsored #InfluxData_IIoT #InfluxDB #Industry40 @Fabot70 @FogorosAndrei

#InfluxDB 3 users now have more visualization options than ever before! 𝗔𝗱𝘃𝗮𝗻𝗰𝗲𝗱, 𝗰𝘂𝘀𝘁𝗼𝗺𝗶𝘇𝗮𝗯𝗹𝗲 𝗱𝗮𝘀𝗵𝗯𝗼𝗮𝗿𝗱𝘀 → Grafana with enhanced InfluxDB 3 integration 𝗤𝘂𝗶𝗰𝗸, 𝗯𝘂𝗶𝗹𝘁-𝗶𝗻 𝘃𝗶𝘀𝘂𝗮𝗹𝗶𝘇𝗮𝘁𝗶𝗼𝗻 → Native dashboards in Cloud…
Historians are great for local data collection, but they create silos that block insights and slow decisions. Pairing #InfluxDB 3 with your historian breaks down those barriers, enabling real-time analysis, long-term forecasting, and scalable data access across your entire…

I'm very excited about the new Processing Engine with #InfluxDB 3. It allows you to execute Python code in InfluxDB on data ingest, on a schedule, or in response to an HTTP call. It also appears the plugin system will be replacing Telegraf in the future 😯. Check out more here:…

Thank you to #NDCOslo for showing up for my Time Series Data talk! Lots of great questions after. If you like the github repo check it out: github.com/Quorralyne/DeL… #influxdb


#InfluxDB 3.6 is live with Ask AI now in beta! Query your time series data in plain English—no SQL required, just answers. 💬 Try: “Show CPU usage by region over the last hour.” Available now in Explorer 1.4 for both Core and Enterprise: bit.ly/4odfGPb

🚀 Performance #Monitoring leicht gemacht! Heute und morgen findet unsere #InfluxDB & #Grafana Schulung mal wieder bei uns vor Ort in Nürnberg statt. Wir freuen uns über motivierte Teilnehmer und zwei Tage voller erstklassigem Praxiswissen!

Who's ready for some time series data talk with a dash of cinema? join me at 10:10am in room 2 and we'll jump into it! #dotnetdayswitzerland #influxdb #sql #dotnet #delorean


Something went wrong.
Something went wrong.
United States Trends
- 1. #WWERaw 104K posts
- 2. Packers 61.8K posts
- 3. Packers 61.8K posts
- 4. Jordan Love 9,248 posts
- 5. John Cena 85.5K posts
- 6. Patullo 6,143 posts
- 7. Jalen 19.8K posts
- 8. Pistons 13.9K posts
- 9. #GoPackGo 6,108 posts
- 10. #MondayNightFootball 1,567 posts
- 11. Jenkins 5,227 posts
- 12. #RawOnNetflix 2,545 posts
- 13. Matt LaFleur 2,368 posts
- 14. Nikki Bella 6,622 posts
- 15. AJ Brown 2,960 posts
- 16. Lane Johnson 1,620 posts
- 17. Bo Melton N/A
- 18. Green Bay 13.9K posts
- 19. Desmond Bane 3,505 posts
- 20. Gunther 6,743 posts