#key2stats search results

Overcomplicating Terminology 🧠💥 Mistake: Using overly technical jargon without explanation. Tip: Break down terms into simple, relatable language. For example, explain "standard deviation" as "how spread out the data is." #ClearExplanations #StatJargon #Key2STATS

🕵️♀️ Data Detective Time! Solve this stats puzzle and let’s see your answer. 🔢 #Key2STATS #DataChallenge #StatsSkills
🔍 Quick Data Challenge! How confident are you in your stats skills? Prove it! 💬 #StatisticsFun #STEMChallenge #Key2STATS

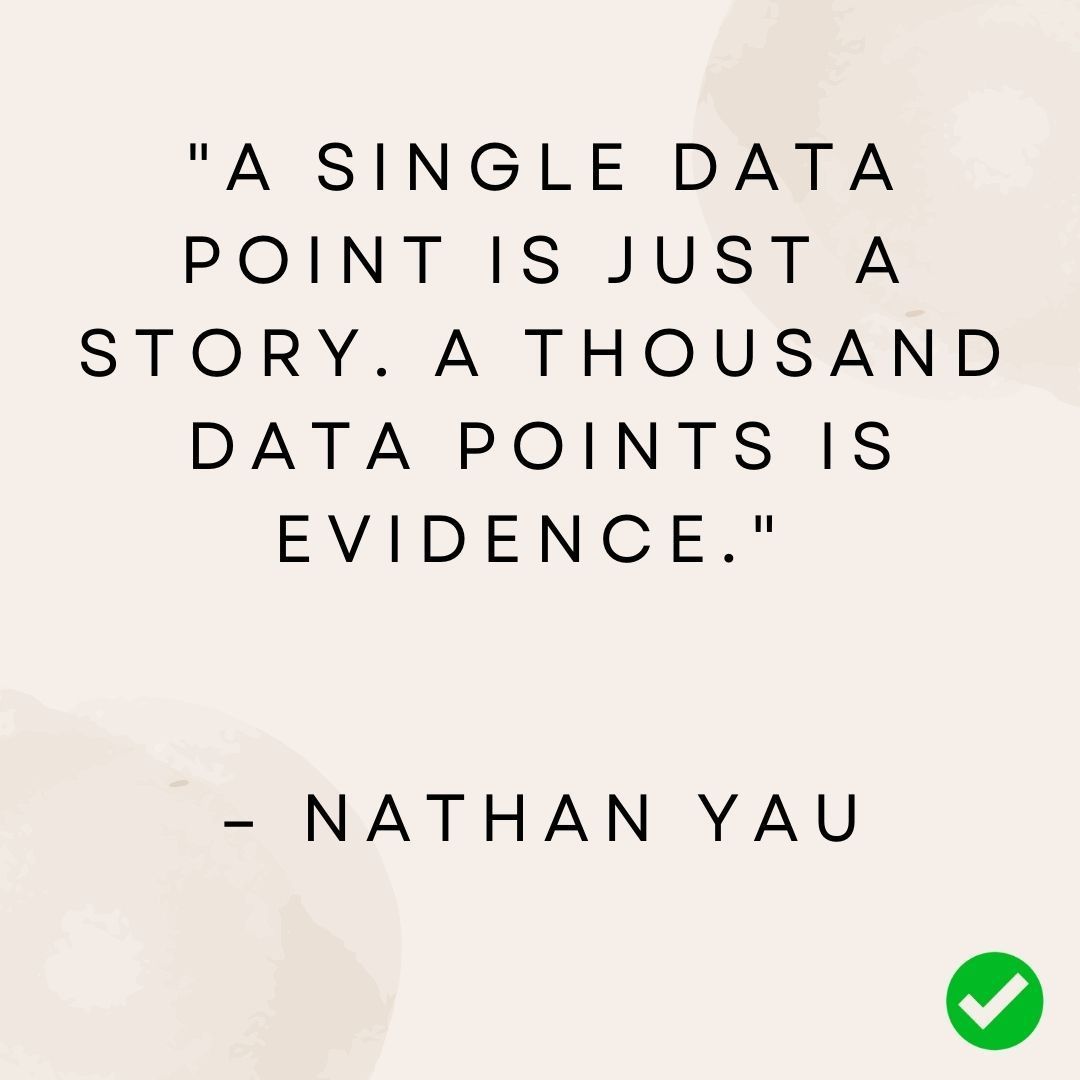
Always seek robust data to strengthen your conclusions. One point isn’t enough! #RobustData #StatisticalThinking #Key2STATS
🎯🍀 Teach Probability with Everyday Scenarios Use coins, dice, or lottery odds to make probability relatable. Hands-on learning turns theory into practical skills! #ProbabilityInAction #EverydayStats #Key2STATS

🎮 Video Games and RNG Loot boxes? 🎁 It’s all about random number generators! Developers use probability to balance fun (and frustration) in gameplay. #GamingAndStats #RNGInGames #Key2STATS

Teach “Data Ethics” Early On ⚖️🔍 Incorporate lessons on responsible data use, like avoiding bias and respecting privacy. These skills are as important as learning to analyze data. #DataEthics #ResponsibleStats #Key2STATS

☕📊 The Statistic Behind Your Morning Coffee 2.25B cups of coffee are consumed daily—enough to fill 33 Olympic pools! Next latte = a sip of global stats. #CoffeeAndStats #FunWithData #Key2STATS

Food Delivery Times 🍕 When your favorite pizza app predicts a 30-minute delivery time, it’s using data! 🚴 Delivery platforms analyze traffic, order volume, and preparation times to keep you informed. #FoodDeliveryStats #FastAndAccurate #Key2STATS

Predicting Oscar Winners 🎥🏆 Oscar winners are more likely to be announced last if they’re for Best Picture. This ordering is statistically planned to build suspense and boost ratings—data drives drama! #OscarsAndStats #AwardShowSecrets #Key2STATS

Weather Forecasts in Disaster Movies 🌪️ From The Day After Tomorrow to Twister, weather forecasts play a dramatic role in disaster films. But did you know real forecasts rely on Bayesian statistics? 🔍 Predicting chaos is no small feat! #WeatherAndMovies #BayesianStats #Key2STATS

Airline Overbooking and Revenue 📉 Airlines often overbook flights, but why? It’s all about statistics! They calculate the probability of no-shows to maximize revenue. 📈 Ever wondered if the math really works? #AirlineStats #OverbookingLogic #Key2STATS

What If Everyone Had Identical DNA? 🧬 If every person’s DNA were the same, diversity in height, health, and talents would vanish. But evolution thrives on variation, so statistics remind us that differences make us stronger! #WhatIfWonders #DNAAndDiversity #Key2STATS

Create a Class Data Project 🧑🔬📂 Let students design and execute a small research project. From collecting survey responses to analyzing trends, this hands-on approach gives them real-world experience in statistical methods. #ProjectBasedLearning #ClassroomStats #Key2STATS

What If Every Vote Counted Perfectly? 🗳️ No recounts, no contested results! Statistically perfect voting systems would eliminate errors and ensure every voice is heard. Technology and data analysis are bringing us closer to this reality. #WhatIfWonders #VotingStats #Key2STATS

Myth: All Surveys Are Reliable 🗳️❌ Reality: A survey’s reliability depends on how it’s designed. Leading questions or biased samples can produce misleading results. Crafting good surveys is an art and a science! #SurveyScience #ReliableData #Key2STATS

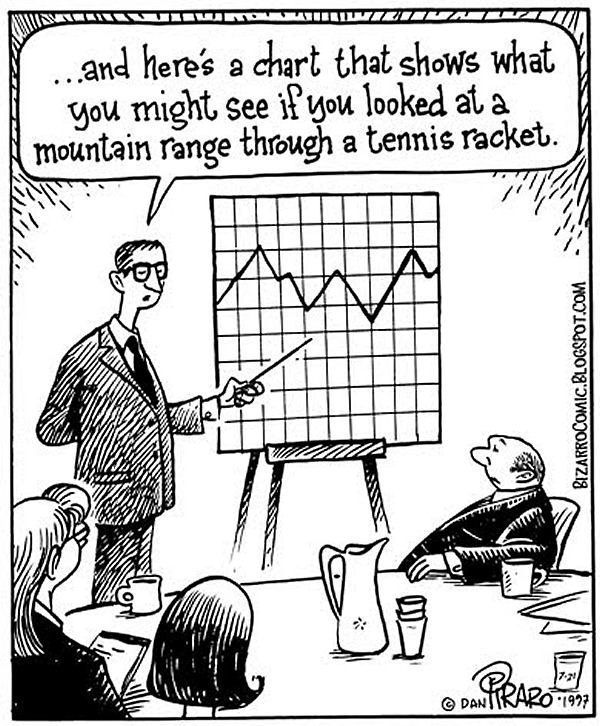
📉 "Not All Graphs Tell a Story..." 🔎 Your data should make sense—not look like a mountain range through a tennis racket! 🎾 Key2STATS keeps it clear. 👉 buff.ly/3BMwJV4 #DataVisualization #StatisticsMadeFun #Key2STATS
📦 Visualize Data at a Glance! Boxplots summarize data with medians, ranges, quartiles, & outliers—perfect for spotting trends & comparing datasets. 📖 Learn more 👉 buff.ly/3PDbQPM #BoxplotBasics #DataVisualization #Key2STATS

Free Statistical Graphics Gallery 🎨 Get inspired with the R Graph Gallery, featuring hundreds of examples of beautiful statistical graphics made with R. 🔗 buff.ly/3ZvEW7B #StatGraphics #LearnWithR #Key2STATS
☕📊 The Statistic Behind Your Morning Coffee 2.25B cups of coffee are consumed daily—enough to fill 33 Olympic pools! Next latte = a sip of global stats. #CoffeeAndStats #FunWithData #Key2STATS
📉 "Not All Graphs Tell a Story..." 🔎 Your data should make sense—not look like a mountain range through a tennis racket! 🎾 Key2STATS keeps it clear. 👉 buff.ly/3BMwJV4 #DataVisualization #StatisticsMadeFun #Key2STATS
Create a Class Data Project 🧑🔬📂 Let students design and execute a small research project. From collecting survey responses to analyzing trends, this hands-on approach gives them real-world experience in statistical methods. #ProjectBasedLearning #ClassroomStats #Key2STATS
🕵️♀️ Data Detective Time! Solve this stats puzzle and let’s see your answer. 🔢 #Key2STATS #DataChallenge #StatsSkills
What If Everyone Had Identical DNA? 🧬 If every person’s DNA were the same, diversity in height, health, and talents would vanish. But evolution thrives on variation, so statistics remind us that differences make us stronger! #WhatIfWonders #DNAAndDiversity #Key2STATS
Food Delivery Times 🍕 When your favorite pizza app predicts a 30-minute delivery time, it’s using data! 🚴 Delivery platforms analyze traffic, order volume, and preparation times to keep you informed. #FoodDeliveryStats #FastAndAccurate #Key2STATS
🎮 Video Games and RNG Loot boxes? 🎁 It’s all about random number generators! Developers use probability to balance fun (and frustration) in gameplay. #GamingAndStats #RNGInGames #Key2STATS
Free Statistical Graphics Gallery 🎨 Get inspired with the R Graph Gallery, featuring hundreds of examples of beautiful statistical graphics made with R. 🔗 buff.ly/3ZvEW7B #StatGraphics #LearnWithR #Key2STATS
Always seek robust data to strengthen your conclusions. One point isn’t enough! #RobustData #StatisticalThinking #Key2STATS
Myth: All Surveys Are Reliable 🗳️❌ Reality: A survey’s reliability depends on how it’s designed. Leading questions or biased samples can produce misleading results. Crafting good surveys is an art and a science! #SurveyScience #ReliableData #Key2STATS
Teach “Data Ethics” Early On ⚖️🔍 Incorporate lessons on responsible data use, like avoiding bias and respecting privacy. These skills are as important as learning to analyze data. #DataEthics #ResponsibleStats #Key2STATS
Overcomplicating Terminology 🧠💥 Mistake: Using overly technical jargon without explanation. Tip: Break down terms into simple, relatable language. For example, explain "standard deviation" as "how spread out the data is." #ClearExplanations #StatJargon #Key2STATS
📦 Visualize Data at a Glance! Boxplots summarize data with medians, ranges, quartiles, & outliers—perfect for spotting trends & comparing datasets. 📖 Learn more 👉 buff.ly/3PDbQPM #BoxplotBasics #DataVisualization #Key2STATS
Predicting Oscar Winners 🎥🏆 Oscar winners are more likely to be announced last if they’re for Best Picture. This ordering is statistically planned to build suspense and boost ratings—data drives drama! #OscarsAndStats #AwardShowSecrets #Key2STATS
🎯🍀 Teach Probability with Everyday Scenarios Use coins, dice, or lottery odds to make probability relatable. Hands-on learning turns theory into practical skills! #ProbabilityInAction #EverydayStats #Key2STATS
🔍 Quick Data Challenge! How confident are you in your stats skills? Prove it! 💬 #StatisticsFun #STEMChallenge #Key2STATS
What If Every Vote Counted Perfectly? 🗳️ No recounts, no contested results! Statistically perfect voting systems would eliminate errors and ensure every voice is heard. Technology and data analysis are bringing us closer to this reality. #WhatIfWonders #VotingStats #Key2STATS
Airline Overbooking and Revenue 📉 Airlines often overbook flights, but why? It’s all about statistics! They calculate the probability of no-shows to maximize revenue. 📈 Ever wondered if the math really works? #AirlineStats #OverbookingLogic #Key2STATS
Weather Forecasts in Disaster Movies 🌪️ From The Day After Tomorrow to Twister, weather forecasts play a dramatic role in disaster films. But did you know real forecasts rely on Bayesian statistics? 🔍 Predicting chaos is no small feat! #WeatherAndMovies #BayesianStats #Key2STATS
Practice Data Analysis for Free 🧮 Google’s Colab Notebooks let you analyze datasets and practice Python coding for free—no software installation needed! 🔗 buff.ly/2GqrUmL #DataAnalysis #FreeTools #Key2STATS
Overcomplicating Terminology 🧠💥 Mistake: Using overly technical jargon without explanation. Tip: Break down terms into simple, relatable language. For example, explain "standard deviation" as "how spread out the data is." #ClearExplanations #StatJargon #Key2STATS
🕵️♀️ Data Detective Time! Solve this stats puzzle and let’s see your answer. 🔢 #Key2STATS #DataChallenge #StatsSkills
Focus on solving meaningful problems, even if the solution isn’t perfect. #TukeyWisdom #StatisticsQuotes #Key2STATS

🔍 Quick Data Challenge! How confident are you in your stats skills? Prove it! 💬 #StatisticsFun #STEMChallenge #Key2STATS
Always seek robust data to strengthen your conclusions. One point isn’t enough! #RobustData #StatisticalThinking #Key2STATS
🎮 Video Games and RNG Loot boxes? 🎁 It’s all about random number generators! Developers use probability to balance fun (and frustration) in gameplay. #GamingAndStats #RNGInGames #Key2STATS
☕📊 The Statistic Behind Your Morning Coffee 2.25B cups of coffee are consumed daily—enough to fill 33 Olympic pools! Next latte = a sip of global stats. #CoffeeAndStats #FunWithData #Key2STATS
🎯🍀 Teach Probability with Everyday Scenarios Use coins, dice, or lottery odds to make probability relatable. Hands-on learning turns theory into practical skills! #ProbabilityInAction #EverydayStats #Key2STATS
Teach “Data Ethics” Early On ⚖️🔍 Incorporate lessons on responsible data use, like avoiding bias and respecting privacy. These skills are as important as learning to analyze data. #DataEthics #ResponsibleStats #Key2STATS
Food Delivery Times 🍕 When your favorite pizza app predicts a 30-minute delivery time, it’s using data! 🚴 Delivery platforms analyze traffic, order volume, and preparation times to keep you informed. #FoodDeliveryStats #FastAndAccurate #Key2STATS
Predicting Oscar Winners 🎥🏆 Oscar winners are more likely to be announced last if they’re for Best Picture. This ordering is statistically planned to build suspense and boost ratings—data drives drama! #OscarsAndStats #AwardShowSecrets #Key2STATS
Weather Forecasts in Disaster Movies 🌪️ From The Day After Tomorrow to Twister, weather forecasts play a dramatic role in disaster films. But did you know real forecasts rely on Bayesian statistics? 🔍 Predicting chaos is no small feat! #WeatherAndMovies #BayesianStats #Key2STATS
Airline Overbooking and Revenue 📉 Airlines often overbook flights, but why? It’s all about statistics! They calculate the probability of no-shows to maximize revenue. 📈 Ever wondered if the math really works? #AirlineStats #OverbookingLogic #Key2STATS
What If Everyone Had Identical DNA? 🧬 If every person’s DNA were the same, diversity in height, health, and talents would vanish. But evolution thrives on variation, so statistics remind us that differences make us stronger! #WhatIfWonders #DNAAndDiversity #Key2STATS
Create a Class Data Project 🧑🔬📂 Let students design and execute a small research project. From collecting survey responses to analyzing trends, this hands-on approach gives them real-world experience in statistical methods. #ProjectBasedLearning #ClassroomStats #Key2STATS
What If Every Vote Counted Perfectly? 🗳️ No recounts, no contested results! Statistically perfect voting systems would eliminate errors and ensure every voice is heard. Technology and data analysis are bringing us closer to this reality. #WhatIfWonders #VotingStats #Key2STATS
Myth: All Surveys Are Reliable 🗳️❌ Reality: A survey’s reliability depends on how it’s designed. Leading questions or biased samples can produce misleading results. Crafting good surveys is an art and a science! #SurveyScience #ReliableData #Key2STATS
📉 "Not All Graphs Tell a Story..." 🔎 Your data should make sense—not look like a mountain range through a tennis racket! 🎾 Key2STATS keeps it clear. 👉 buff.ly/3BMwJV4 #DataVisualization #StatisticsMadeFun #Key2STATS
📦 Visualize Data at a Glance! Boxplots summarize data with medians, ranges, quartiles, & outliers—perfect for spotting trends & comparing datasets. 📖 Learn more 👉 buff.ly/3PDbQPM #BoxplotBasics #DataVisualization #Key2STATS
Something went wrong.
Something went wrong.
United States Trends
- 1. Daboll 37.4K posts
- 2. Pond 239K posts
- 3. Schoen 19.2K posts
- 4. Veterans Day 21.9K posts
- 5. Bowen 10.3K posts
- 6. Giants 73.6K posts
- 7. Go Birds 11.7K posts
- 8. Zendaya 8,677 posts
- 9. Joe Burrow 5,848 posts
- 10. Joe Dirt N/A
- 11. Dart 23.8K posts
- 12. Kim Davis 13.2K posts
- 13. Marines 63.5K posts
- 14. #jimromeonx N/A
- 15. Hanoi Jane 1,079 posts
- 16. #ROBOGIVE 1,160 posts
- 17. Jeffries 42.2K posts
- 18. Marte 3,743 posts
- 19. Johnny Carson N/A
- 20. Correísmo Nunca Más 1,558 posts