#kubernetesmonitoring search results
NETSCOUT Enhances Cloud Compliance for Enterprises digitrendz.blog/?p=78862 #CloudCompliance #ContinuousMonitoring #KubernetesMonitoring #Zero-trustSecurity
Refcard update: “Kubernetes Monitoring Essentials” 👉 dzone.com/refcardz/monit… Capture monitoring data insights, leverage core Kubernetes components for monitoring, and identify key metrics. Special thanks to our author, Sudip Sengupta! #Kubernetes #Kubernetesmonitoring

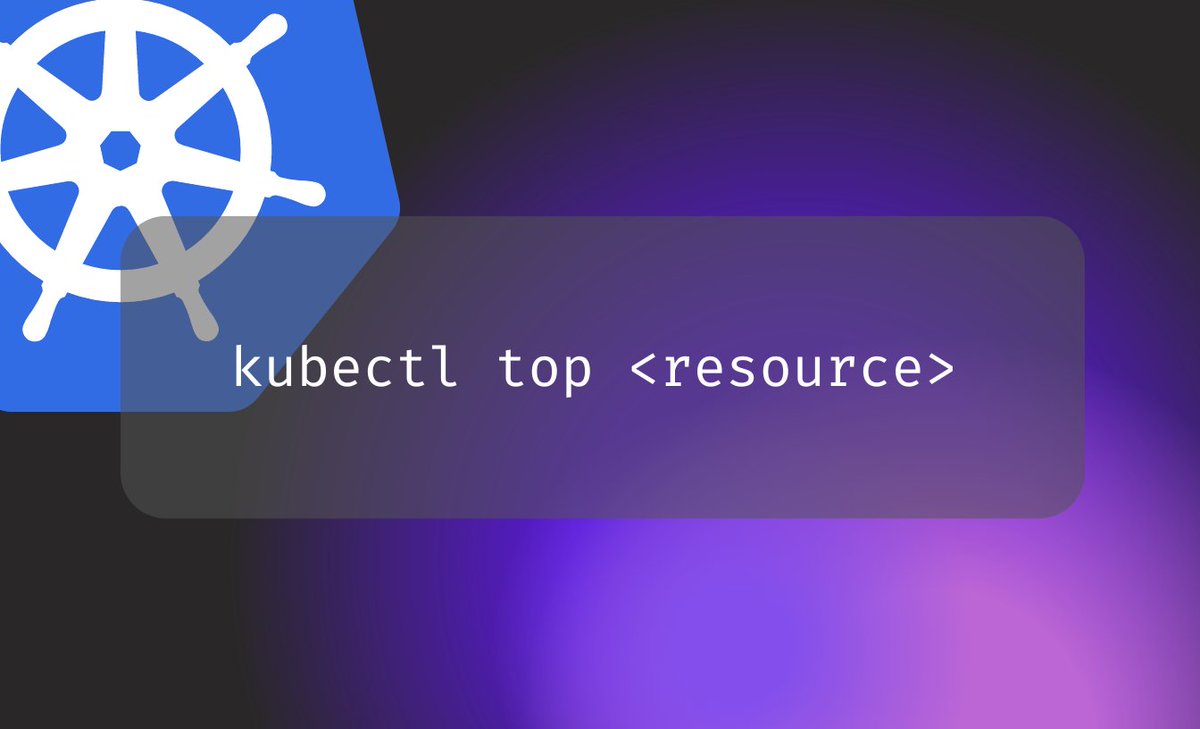
📊 Kubernetes tip: Monitor your cluster with `kubectl top` Get real-time resource utilization information for nodes, pods, and containers within your Kubernetes environment. #KubernetesMonitoring #ResourceUsage checkout my blog to understand more. debasishbsws.hashnode.dev/understanding-…

Kubernetes monitoring | Learn the working of Kubernetes monitoring buff.ly/3xXHWMw #Kubernetesmonitoring

Don't wait for a crisis to hit—proactively build resilience into your enterprise with effective Kubernetes monitoring. Learn the top strategies and best practices in our latest blog post. site24x7.com/blog/enterpris… #ITOps #KubernetesMonitoring

No one can be a "cluster whisperer," but KubeVision comes close! 🔧 From Timeline Views to Deprecated API Dashboards, take control of your Kubernetes clusters like never before. 🌟 Start your free 30-day trial today: hubs.ly/Q032vQRL0 #DevOps #KubernetesMonitoring

1️⃣2️⃣ Monitoring & Logging 📊 🔹 Prometheus – Metrics collection 🔹 Grafana – Data visualization 🔹 Fluentd – Log forwarding 🔹 Loki – Log aggregation 🔹 ELK Stack – Centralized logging Monitor Kubernetes to keep your cluster healthy! #KubernetesMonitoring
🟡 Prometheus Architecture: - Prometheus server retrieves cluster data and stores it as TSDB - Integrates with AlertManager for alerts (email, Slack) - Use PromQL for filtering data in Prometheus UI & Grafana dashboards 🚀 #KubernetesMonitoring #CloudComputing
📢 Check out this insightful blog on #KubernetesMonitoring with Prometheus and Grafana! 🚀📊 Gain real-time insights into your cluster's performance and take control of your applications. 🔍⚙️ Don't miss this comprehensive guide! #DevOps #k8s #AWS [github.com/naveed-a-satta…] 🌐✨
![NaveedDot's tweet image. 📢 Check out this insightful blog on #KubernetesMonitoring with Prometheus and Grafana! 🚀📊 Gain real-time insights into your cluster's performance and take control of your applications. 🔍⚙️ Don't miss this comprehensive guide! #DevOps #k8s #AWS [github.com/naveed-a-satta…] 🌐✨](https://pbs.twimg.com/media/F1527WkaEAAkWS3.jpg)
Kubernetes Monitoring is available to all Grafana Cloud users, including on free tier. Container orchestration to deploy at scale, iterate quickly, and manage a large number of apps and services. hi.satyenkumar.com/k8s #kubernetesmonitoring #grafanacloud #prometheus
A crucial part of Kubernetes monitoring is about choosing the right tool and methodology. This post introduces 5 popular options. #kubernetesmonitoring bit.ly/42Dotzx
10/ **How do you monitor and troubleshoot performance issues in Kubernetes?** Use Prometheus, Grafana, and Jaeger to monitor performance and trace requests. Set up dashboards and alerts to track key metrics and catch issues early. #KubernetesMonitoring
11/ **How do you monitor and audit Kubernetes network security?** Use Prometheus and Grafana for network monitoring, integrate with audit logs, and use runtime security tools like Falco to detect and respond to network-related security events. #KubernetesMonitoring
10/ **How do you monitor and troubleshoot stateful applications in Kubernetes?** Track metrics with tools like Prometheus and Grafana, and set up alerts for critical events. Centralized logging helps aggregate logs and troubleshoot issues. #KubernetesMonitoring
2/ **Why is monitoring important in Kubernetes environments?** Monitoring helps detect issues early, track resource usage, and ensure your applications meet performance requirements. It’s critical for avoiding incidents. #KubernetesMonitoring
6/ **What tools can you use to monitor, optimize Kubernetes cluster performance?** Prometheus, Grafana, and Kube-State-Metrics provide insights into your cluster’s performance. Set up dashboards to monitor key metrics like CPU, memory, and network usage. #KubernetesMonitoring
11/ **What are best practices for monitoring and validating deployments during rollouts?** Use Prometheus and Grafana to monitor key metrics and set up alerts for critical issues. Automated tests and health checks validate performance. #KubernetesMonitoring
8/ **How do you monitor performance across multiple clusters?** Use centralized monitoring tools like Prometheus + Thanos to aggregate metrics and distributed tracing tools like Jaeger to track requests across clusters. #KubernetesMonitoring
11/ **How do you monitor and troubleshoot multi-cluster environments?** Use centralized monitoring tools like Prometheus, Grafana, or Thanos, and set up distributed tracing for cross-cluster requests. #KubernetesMonitoring
9/ **What are best practices for monitoring and logging Kubernetes deployments?** Use Prometheus and Grafana for monitoring, and centralized logging solutions to troubleshoot deployment issues. #KubernetesMonitoring
NETSCOUT Enhances Cloud Compliance for Enterprises digitrendz.blog/?p=78862 #CloudCompliance #ContinuousMonitoring #KubernetesMonitoring #Zero-trustSecurity
gsoftcomm.net/blogs/top-kube… #kubernetes #kubernetesmonitoring #cloudnative #cloudnative2025 #k8sbestpractices #infrastructuremonitoring #cloud #devopstools #containersecurity #observability
Deploy cost-effective Kubernetes monitoring with Prometheus, Grafana, and Mimir using Helm, Terraform, and GCP in this detailed, open-source setup guide. - hackernoon.com/big-monitoring… #kubernetesmonitoring #prometheusgrafanamimir
1️⃣2️⃣ Monitoring & Logging 📊 🔹 Prometheus – Metrics collection 🔹 Grafana – Data visualization 🔹 Fluentd – Log forwarding 🔹 Loki – Log aggregation 🔹 ELK Stack – Centralized logging Monitor Kubernetes to keep your cluster healthy! #KubernetesMonitoring
No one can be a "cluster whisperer," but KubeVision comes close! 🔧 From Timeline Views to Deprecated API Dashboards, take control of your Kubernetes clusters like never before. 🌟 Start your free 30-day trial today: hubs.ly/Q032vQRL0 #DevOps #KubernetesMonitoring

Check out how to get Kube node metrics with Netdata monitoring for your Kubernetes cluster. It is simple to install and start getting metrics immediately: virtualizationhowto.com/2024/12/kube-n… @netdatahq #kubernetesmonitoring
virtualizationhowto.com
Kube node metrics with Netdata Kubernetes monitoring
Learn how to monitor your Kube node metrics with Netdata and get up and running quickly with Kubernetes monitoring and alerting
🟡 Prometheus Architecture: - Prometheus server retrieves cluster data and stores it as TSDB - Integrates with AlertManager for alerts (email, Slack) - Use PromQL for filtering data in Prometheus UI & Grafana dashboards 🚀 #KubernetesMonitoring #CloudComputing
10/ **How do you monitor and troubleshoot stateful applications in Kubernetes?** Track metrics with tools like Prometheus and Grafana, and set up alerts for critical events. Centralized logging helps aggregate logs and troubleshoot issues. #KubernetesMonitoring
11/ **How do you monitor and audit Kubernetes network security?** Use Prometheus and Grafana for network monitoring, integrate with audit logs, and use runtime security tools like Falco to detect and respond to network-related security events. #KubernetesMonitoring
10/ **How do you monitor and troubleshoot performance issues in Kubernetes?** Use Prometheus, Grafana, and Jaeger to monitor performance and trace requests. Set up dashboards and alerts to track key metrics and catch issues early. #KubernetesMonitoring
8/ **How do you monitor performance across multiple clusters?** Use centralized monitoring tools like Prometheus + Thanos to aggregate metrics and distributed tracing tools like Jaeger to track requests across clusters. #KubernetesMonitoring
2/ **Why is monitoring important in Kubernetes environments?** Monitoring helps detect issues early, track resource usage, and ensure your applications meet performance requirements. It’s critical for avoiding incidents. #KubernetesMonitoring
11/ **What are best practices for monitoring and validating deployments during rollouts?** Use Prometheus and Grafana to monitor key metrics and set up alerts for critical issues. Automated tests and health checks validate performance. #KubernetesMonitoring
6/ **What tools can you use to monitor, optimize Kubernetes cluster performance?** Prometheus, Grafana, and Kube-State-Metrics provide insights into your cluster’s performance. Set up dashboards to monitor key metrics like CPU, memory, and network usage. #KubernetesMonitoring
8/ **What are best practices for auditing and monitoring Kubernetes clusters?** Use Kubernetes Audit Logs and integrate with SIEM tools for real-time threat detection and incident response. #KubernetesMonitoring
9/ **What are best practices for monitoring and logging Kubernetes deployments?** Use Prometheus and Grafana for monitoring, and centralized logging solutions to troubleshoot deployment issues. #KubernetesMonitoring
11/ **How do you monitor and troubleshoot multi-cluster environments?** Use centralized monitoring tools like Prometheus, Grafana, or Thanos, and set up distributed tracing for cross-cluster requests. #KubernetesMonitoring
3/ **How do you monitor resource usage and performance in Kubernetes?** Prometheus and Grafana help monitor CPU, memory, and disk usage. Set up alerts for abnormal metrics. #KubernetesMonitoring
4/ **How do you optimize logging and monitoring in Kubernetes?** Use centralized logging with Fluentd or ELK, and monitor with Prometheus and Grafana. Set up alerts for key metrics. #KubernetesMonitoring
8/ **How do you monitor and log Kubernetes apps at scale?** Use Prometheus, Grafana, and Fluentd for monitoring and logging. #KubernetesMonitoring
No one can be a "cluster whisperer," but KubeVision comes close! 🔧 From Timeline Views to Deprecated API Dashboards, take control of your Kubernetes clusters like never before. 🌟 Start your free 30-day trial today: hubs.ly/Q032vQRL0 #DevOps #KubernetesMonitoring

Refcard update: “Kubernetes Monitoring Essentials” 👉 dzone.com/refcardz/monit… Capture monitoring data insights, leverage core Kubernetes components for monitoring, and identify key metrics. Special thanks to our author, Sudip Sengupta! #Kubernetes #Kubernetesmonitoring

Don't wait for a crisis to hit—proactively build resilience into your enterprise with effective Kubernetes monitoring. Learn the top strategies and best practices in our latest blog post. site24x7.com/blog/enterpris… #ITOps #KubernetesMonitoring

📊 Kubernetes tip: Monitor your cluster with `kubectl top` Get real-time resource utilization information for nodes, pods, and containers within your Kubernetes environment. #KubernetesMonitoring #ResourceUsage checkout my blog to understand more. debasishbsws.hashnode.dev/understanding-…

Kubernetes monitoring | Learn the working of Kubernetes monitoring buff.ly/3xXHWMw #Kubernetesmonitoring

📢 Check out this insightful blog on #KubernetesMonitoring with Prometheus and Grafana! 🚀📊 Gain real-time insights into your cluster's performance and take control of your applications. 🔍⚙️ Don't miss this comprehensive guide! #DevOps #k8s #AWS [github.com/naveed-a-satta…] 🌐✨
![NaveedDot's tweet image. 📢 Check out this insightful blog on #KubernetesMonitoring with Prometheus and Grafana! 🚀📊 Gain real-time insights into your cluster's performance and take control of your applications. 🔍⚙️ Don't miss this comprehensive guide! #DevOps #k8s #AWS [github.com/naveed-a-satta…] 🌐✨](https://pbs.twimg.com/media/F1527WkaEAAkWS3.jpg)
🌟 Elevate your Kubernetes game with Coralogix! Join Chris Cooney as he guides you through detecting and correcting common Kubernetes misconfigurations. #CloudInfrastructure #KubernetesMonitoring bit.ly/3OrwT7Y

Something went wrong.
Something went wrong.
United States Trends
- 1. Marshawn Kneeland 44K posts
- 2. Nancy Pelosi 64.6K posts
- 3. Craig Stammen 1,772 posts
- 4. Gordon Findlay 2,259 posts
- 5. Ozempic 5,780 posts
- 6. Michael Jackson 68.5K posts
- 7. Pujols N/A
- 8. #ThankYouNancy 1,478 posts
- 9. Novo Nordisk 5,971 posts
- 10. GLP-1 4,670 posts
- 11. Abraham Accords 4,279 posts
- 12. #NO1ShinesLikeHongjoong 37.4K posts
- 13. Kazakhstan 6,019 posts
- 14. Kyrou N/A
- 15. #영원한_넘버원캡틴쭝_생일 36.6K posts
- 16. Preller N/A
- 17. Gremlins 3 4,898 posts
- 18. Kinley N/A
- 19. Unplanned 9,115 posts
- 20. Joe Dante N/A


