#solarstats search results

Misschien wil @TenneTTSO, @TenneTPublicAff en/of @JoostGreunsven inhoudelijk reageren op de voortdurende, en aanhoudende problemen met de Nederlandse #solarstats in relatie tot de "mistige" cijfers op het @ENTSO_E platform ?
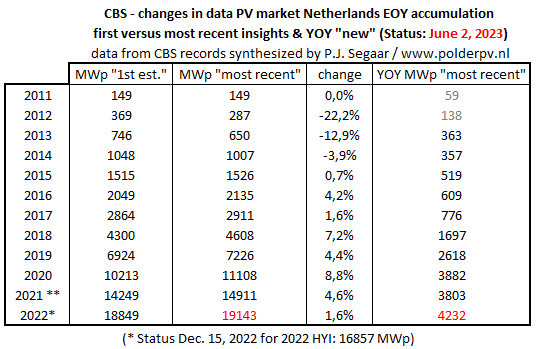
1st adjustment of #solarstats NL 🇳🇱 in 2022 by national @statistiekcbs bureau, published today. New marks EOY 19143 MWp, and new record year growth, YOY 4232 MWp. Data will be further adjusted in later updates polderpv.nl/nieuws_PV184.h… @PHOTON_Magazine @pvmagazine @SolarPowerEU
Waarschuwing bij #solarstats UK: nogal wat "red tape", lastig te doorgronden deel-dossiers, regime changes, veel correcties, en veel pending. What's new under the ☀️ ...

The sun shines for everyone… but these countries are turning it into serious power: China is dominating The US is catching up India is charging forward Japan & Germany are solar veterans Solar isn’t a trend — it’s a transformation. #SolarEnergy #TopSolarCountries #SolarStats


Our #SolarStats for May. Below data is about 98% accurate to our energy provider, so small discrepancies but well within acceptable limits. Summary to follow.
Sunniest day of the year so far here in Midlothian! Our solar production peaked at 35.4kWh, just under 1kWh more than the last peak day back in the middle of May! Wonder if we’ll see this beaten as we head to summer solstice ☀️ #SolarStats
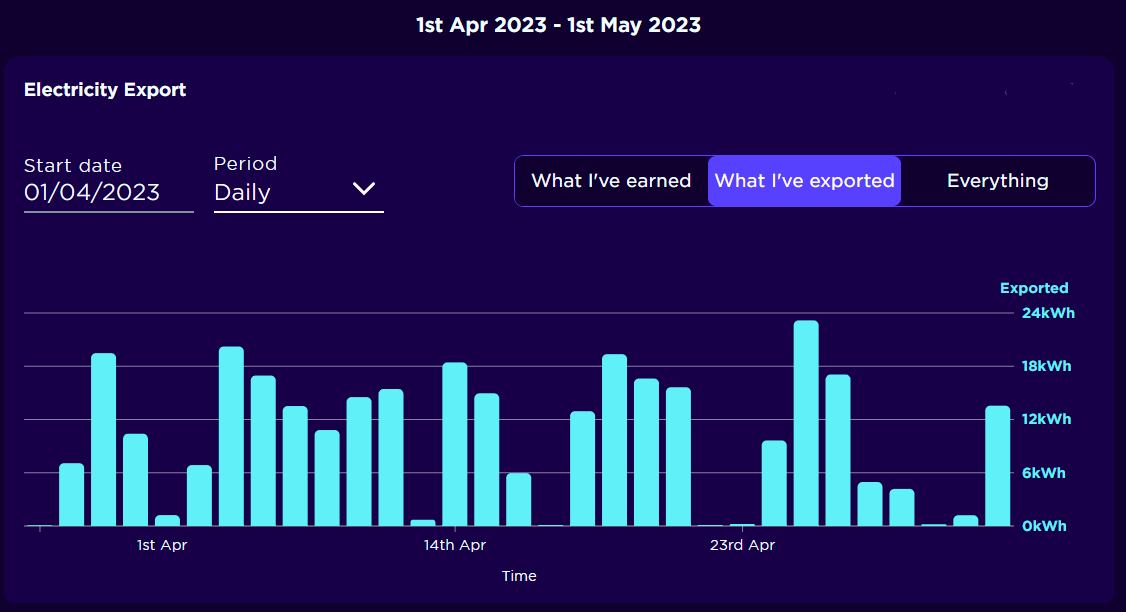
Our export shows an almost inverse picture of our #SolarStats In total we generated 507kWh, used 216kWh, and exported 291kWh back to the grid. This is a fantastic amount but given that the weather was so-so, I know we haven't hit our peak yet.
Niet. Maar in Nederland kan kennelijk "alles" op het gebied van statistieken. Dat weet je toch ? Maar niet aan onze Duitse vrienden vertellen, die liggen toch al lang onder tafel te rollebollen als het over NLse #solarstats gaat ... @energy_charts

☀️ Solar = 69% of new U.S. electricity capacity in Q1 2025. Only one segment grew: commercial solar (+4%), thanks in part to California’s NEM 2.0 projects coming online. #SolarStats #CleanEnergy #Soleeva
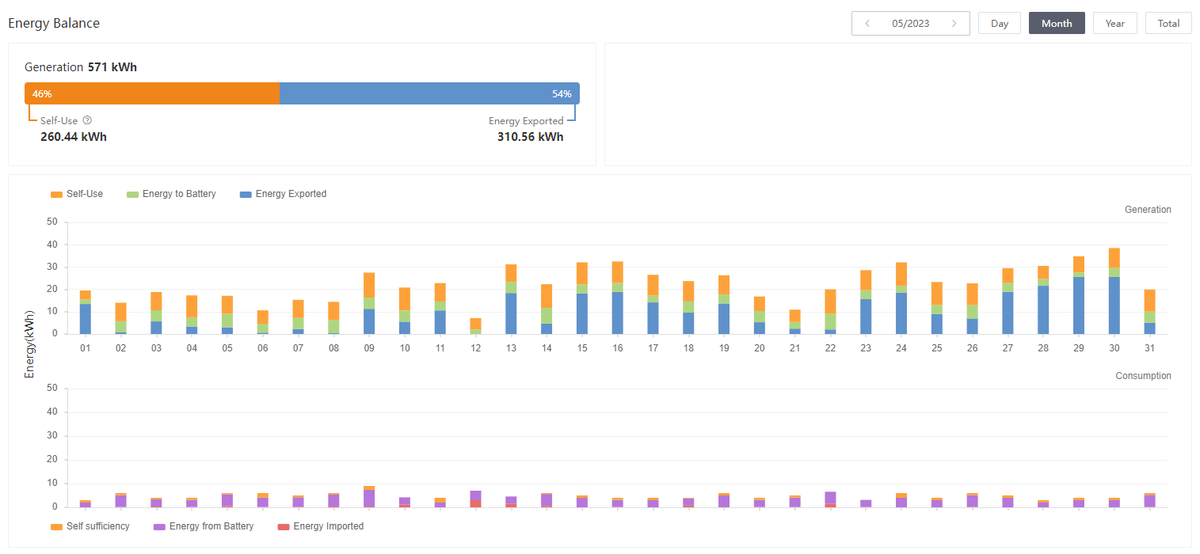
#SolarStats for May: - Generated 571kWh, used 254kWh, exported 317kwh. - Used 12kWh from the grid (so 95% of our useage is purely from solar) - Peak generation day of the year was 30th May with 34.5kWh generated Financials to follow.

ESR Growth Story. 72K → 188K projects 600MW → 1,508MW 98% → 99% approval rate 33M more trees planted equivalent At ESR Growth Meets Excellence. Want excellent solar installation support? quote.sunscape.solar #solarstats
Month-on-month comparisons so far #SolarStats March - Generated 271kWh, used 216kWh (74% of total consumption) - Exported 96kWh - Total utility = £85.68 April - Generated 507kWh, used 216kWh (87% of total consumption) - Exported 291kWh - Total utility = £114.93

🌞 #Sahara Covering just 1.2 % of the Sahara’s ~9 M km² with solar panels could meet 100 % of global annual energy demand—thanks to ~300–400 kWh output per m² each year. Desert sand, grid power. #SolarStats #ClimateTech
#SolarStats for May: We were charged: - £18.61 standing charge - £3.95 for grid energy used = £22.56 debit We exported: + £47.55 We "saved" from using our solar energy rather than grid: +£83.59 End value: £47.55 + £83.59 - £22.56 = £108.58 in credit Winner! 😎😎😎
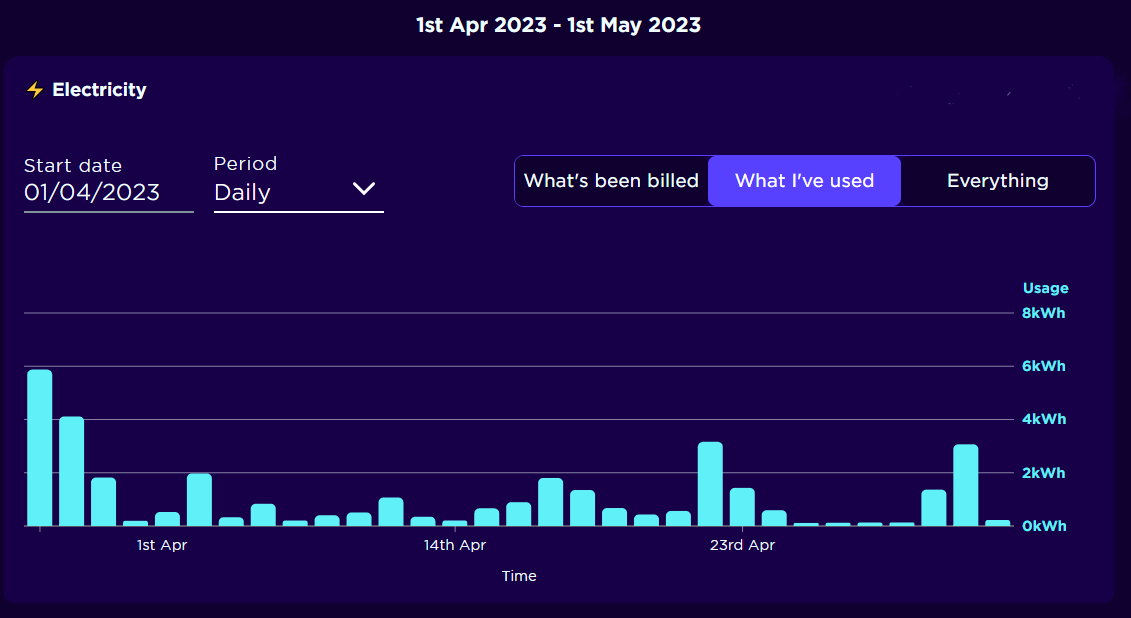
So, some more fun #SolarStats for Apr. First, our usage. For Apr, our total electricity consumption was 216kWh (7.2kWh per day), of which 27kWh was from the grid (13% of our total consumption). We had roughtly half the month on less than 0.5kWh grid energy per day. Not bad.

#solarstats 6 kWh Array North West England. 12 x 500w panels, 8 East and 4 West facing. September 2023 Generation - 433.8 kWh. Best Day 5th - 25.7 kWh. Worst day 28th - 4.2 kWh
☀️ Solar = 69% of new U.S. electricity capacity in Q1 2025. Only one segment grew: commercial solar (+4%), thanks in part to California’s NEM 2.0 projects coming online. #SolarStats #CleanEnergy #Soleeva
The sun shines for everyone… but these countries are turning it into serious power: China is dominating The US is catching up India is charging forward Japan & Germany are solar veterans Solar isn’t a trend — it’s a transformation. #SolarEnergy #TopSolarCountries #SolarStats
🌞 #Sahara Covering just 1.2 % of the Sahara’s ~9 M km² with solar panels could meet 100 % of global annual energy demand—thanks to ~300–400 kWh output per m² each year. Desert sand, grid power. #SolarStats #ClimateTech
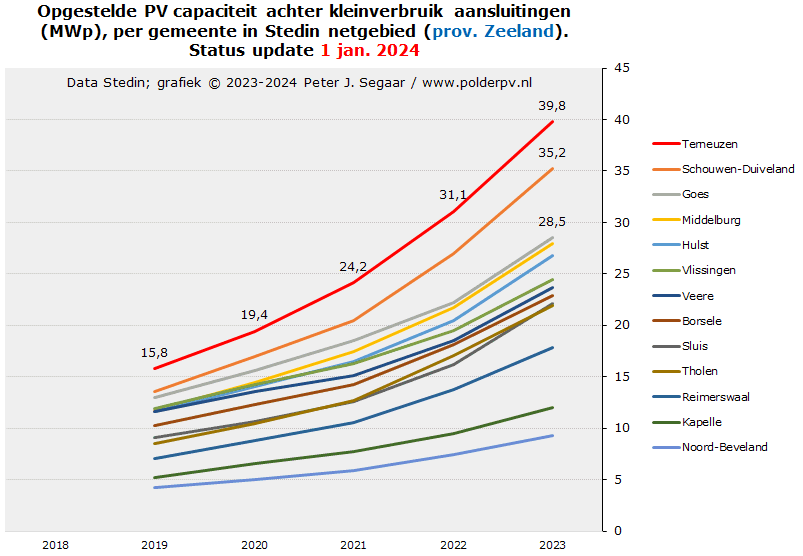
Dat moet voormalig @Stedin medewerker @HenriBontenbal toch goed doen, eindelijk eens harde data Zeelandse gemeentes in de #solarstats van de netbeheerder. Kleinverbruik, evolutie capaciteit, bekend vanaf 2019 polderpv.nl/nieuws_PV189.h… Onderdeel van draadje 🧵

☀️ Solar = 69% of new U.S. electricity capacity in Q1 2025. Only one segment grew: commercial solar (+4%), thanks in part to California’s NEM 2.0 projects coming online. #SolarStats #CleanEnergy #Soleeva
1st adjustment of #solarstats NL 🇳🇱 in 2022 by national @statistiekcbs bureau, published today. New marks EOY 19143 MWp, and new record year growth, YOY 4232 MWp. Data will be further adjusted in later updates polderpv.nl/nieuws_PV184.h… @PHOTON_Magazine @pvmagazine @SolarPowerEU
Our export shows an almost inverse picture of our #SolarStats In total we generated 507kWh, used 216kWh, and exported 291kWh back to the grid. This is a fantastic amount but given that the weather was so-so, I know we haven't hit our peak yet.
The sun shines for everyone… but these countries are turning it into serious power: China is dominating The US is catching up India is charging forward Japan & Germany are solar veterans Solar isn’t a trend — it’s a transformation. #SolarEnergy #TopSolarCountries #SolarStats
So, some more fun #SolarStats for Apr. First, our usage. For Apr, our total electricity consumption was 216kWh (7.2kWh per day), of which 27kWh was from the grid (13% of our total consumption). We had roughtly half the month on less than 0.5kWh grid energy per day. Not bad.
Our #SolarStats for May. Below data is about 98% accurate to our energy provider, so small discrepancies but well within acceptable limits. Summary to follow.
Something went wrong.
Something went wrong.
United States Trends
- 1. Artemis II N/A
- 2. Swalwell N/A
- 3. #NASA N/A
- 4. Rory N/A
- 5. #DragRace N/A
- 6. Luis Gil N/A
- 7. Pacific Ocean N/A
- 8. #BINI_CoachellaWk1 N/A
- 9. THEY MADE IT N/A
- 10. Wicks N/A
- 11. Katie Porter N/A
- 12. Lindsey Graham N/A
- 13. Steyer N/A
- 14. Luzardo N/A
- 15. San Diego N/A
- 16. THEY'RE HOME N/A
- 17. #OPLive N/A
- 18. Al Franken N/A
- 19. THEY DID IT N/A
- 20. Astronauts N/A