#asyncprofiler search results


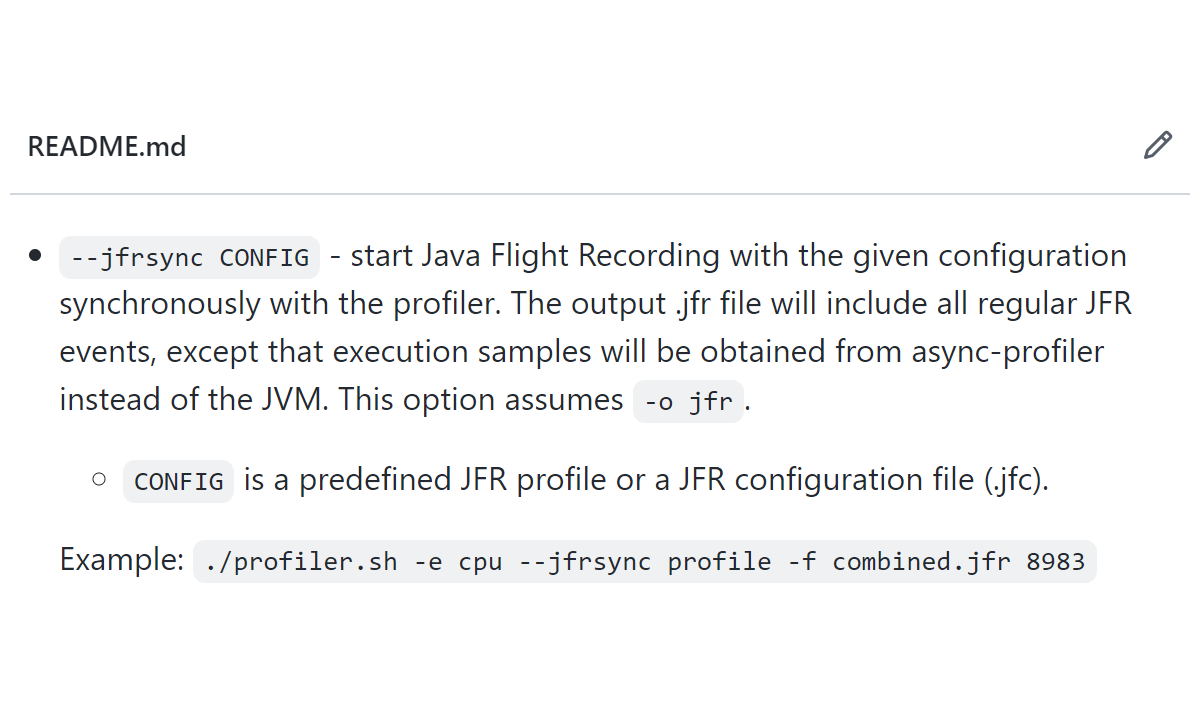
#JFR or #AsyncProfiler? No need to choose - they can work together to produce a single integrated recording.


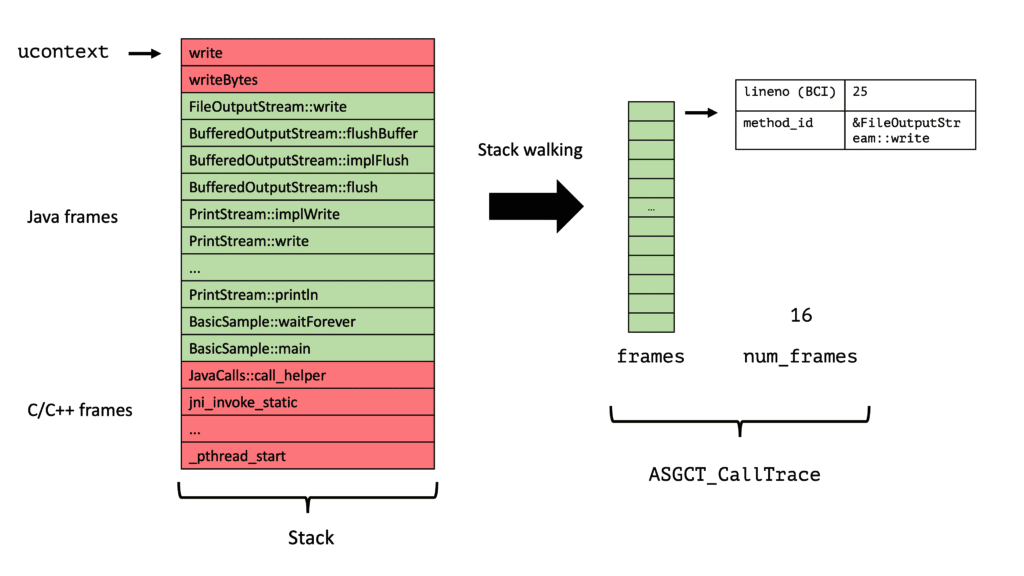
How do profilers like #asyncprofiler work? How to write your own? Get your intense coding hat on because this brand new series by @parttimen3rd @SweetSapMachine tries to write a tiny sampling-based #profiler from scratch! foojay.io/today/writing-… #foojaytip
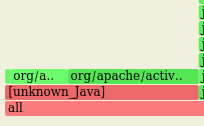
inlining/interpreted/compiled/native frames are landing on @AndreiPangin #asyncprofiler github.com/jvm-profiling-… Bye bye perf map...we've been good friends for many years...

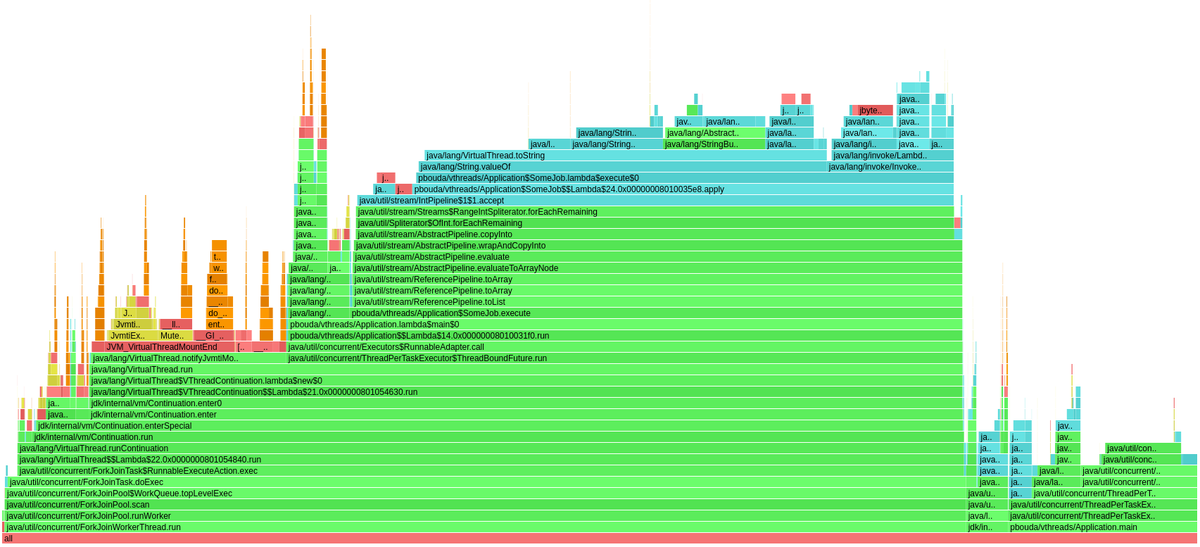
#AsyncProfiler's flamegraph of Virtual Threads - check it out and zoom in! github.com/petrbouda/virt…

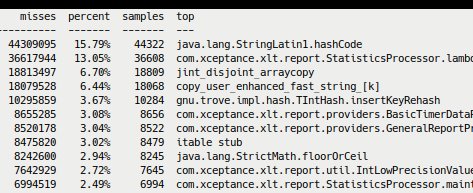
Async-Profiler is great. Hope that the data provided is correct. Will see and check what can be done to avoid the expensive cache misses. We already squeezed the CPU lemon a lot... #xlt #asyncprofiler


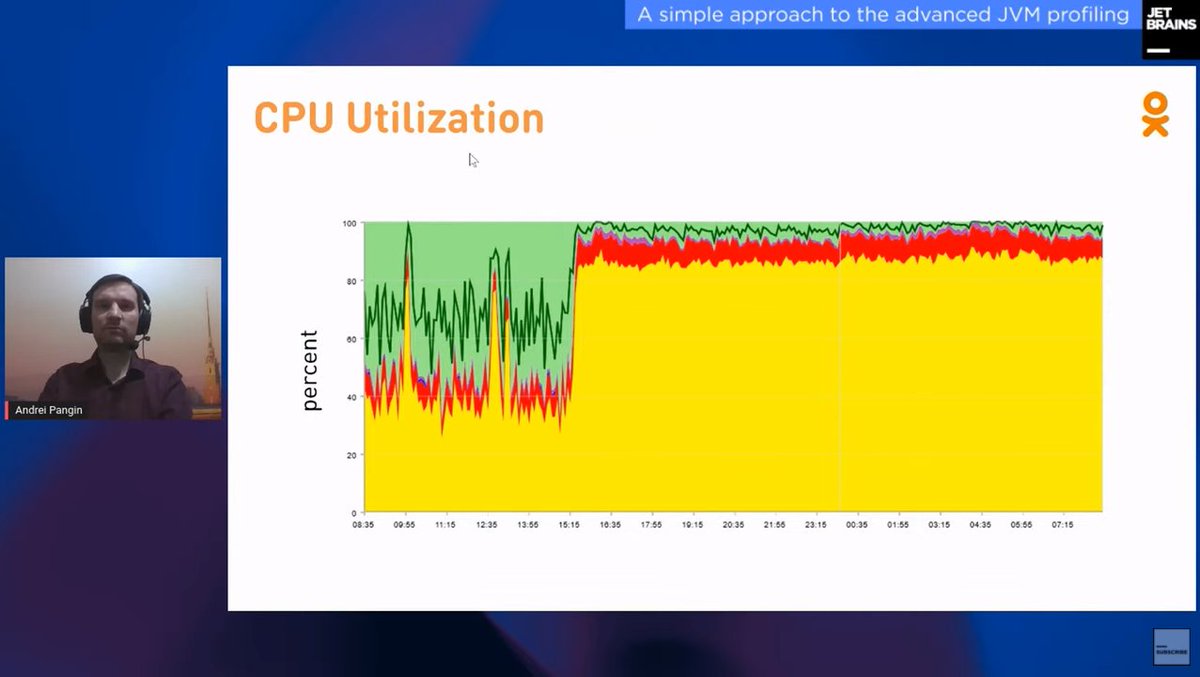
We just started :-) Use this link to view the live stream and participate: youtube.com/watch?v=TDpbt4… #Profilers #AsyncProfiler
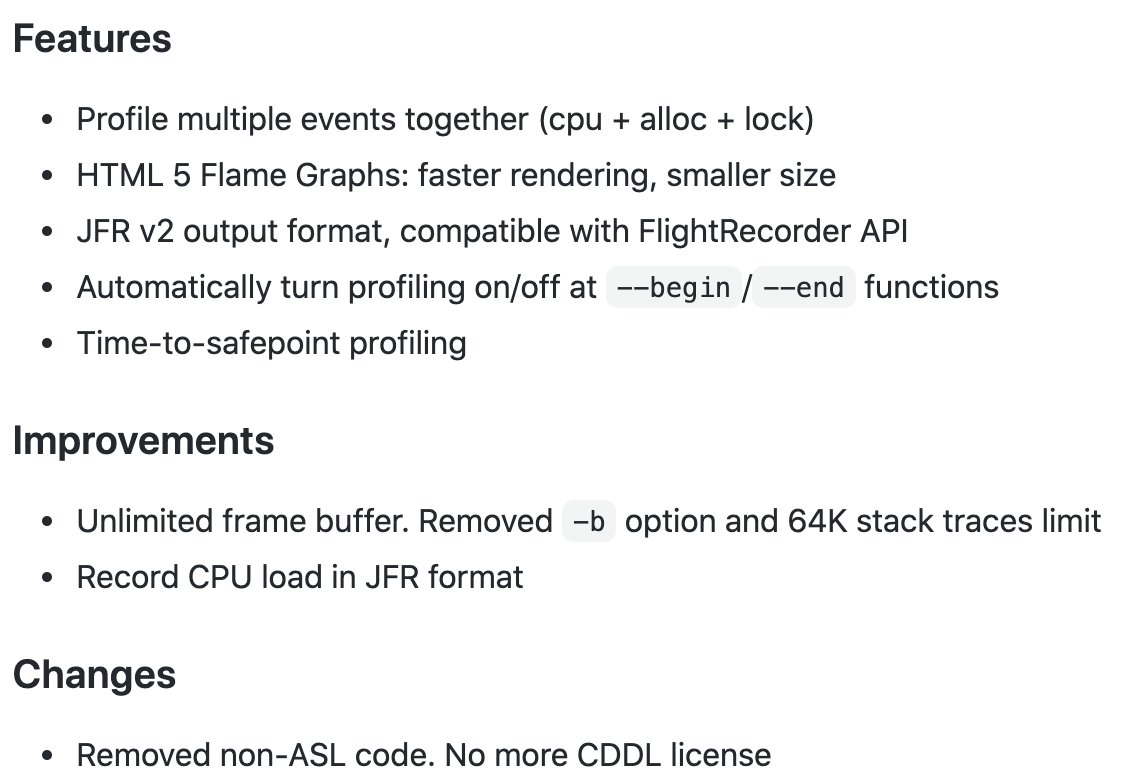
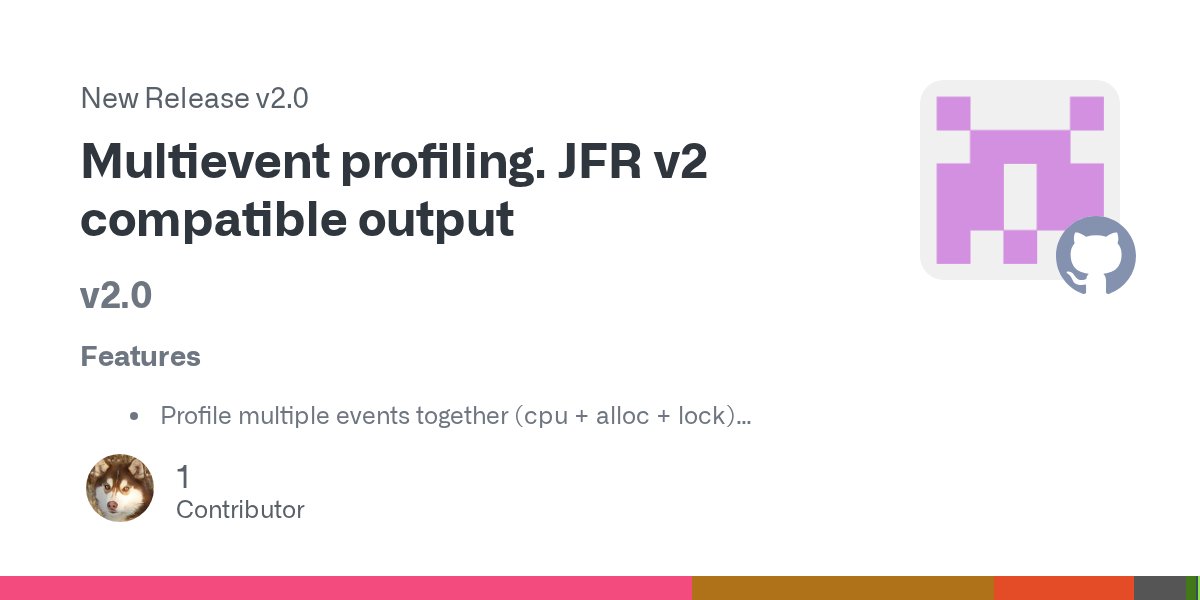
#AsyncProfiler 2.0 has been finally released! Enjoy new fast Flame Graphs, JFR v2 compatible output, and ability to profile cpu+allocations+locks at the same time. github.com/jvm-profiling-…
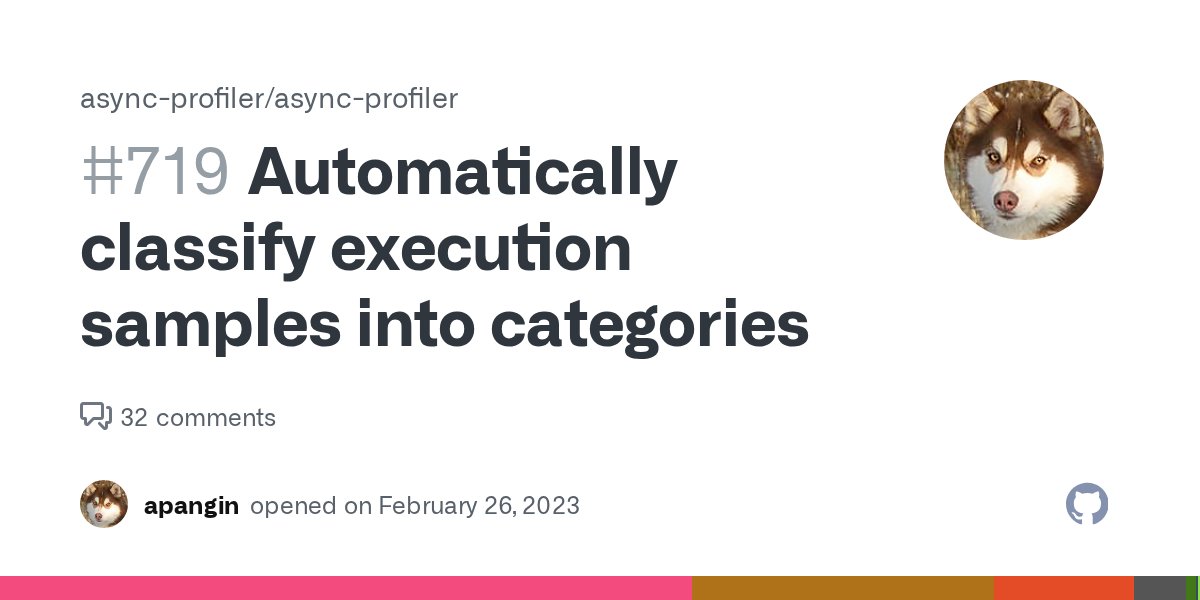
github.com/async-profiler… Classify option for #asyncprofiler nice one :)
Where's String::indexOf on #asyncprofiler flames? There is nothing AP can do here to help (BCI is just wrong) and Arrays::fill has the same "issue", but is nice to see such honesty, kudos to @AndreiPangin (again). Same feelings for @RichardWarburto #honestprofiler ;)
Interesting #asyncprofiler addition github.com/jvm-profiling-…
github.com/async-profiler… Nice change on wall clock profiling for #asyncprofiler
github.com
#1007: Optimize wall clock profiling by apangin · Pull Request #1008 · async-profiler/async-profiler
Description Optimize wall clock profiling by skipping redundant samples when we know thread CPU time has not changed since the last sample. Related issues Resolves #1007. Motivation and context Mak...
Interesting changes on #asyncprofiler to make possible profile in containers github.com/jvm-profiling-…

Let me second Java release with a new release of #AsyncProfiler. And yes, it supports JDK 14! github.com/jvm-profiling-…

With out-of-the-box support for multiple profilers like #JavaFlightRecorder and #AsyncProfiler, #IntelliJIDEA makes it easier for you to profile your applications without leaving your IDE. View this screencast to find out more: youtu.be/OQcyAtukps4 #GettingToKnowIntelliJ

youtube.com
YouTube
Profiling Tools and IntelliJ IDEA Ultimate
I cannot really thanks enough @AndreiPangin for #asyncprofiler candies he put into it, for example github.com/async-profiler…

Another day another time when #asyncprofiler discovered allocations that can be removed: github.com/netty/netty-in… #netty #quic
github.com/async-profiler… Nice change on wall clock profiling for #asyncprofiler
github.com
#1007: Optimize wall clock profiling by apangin · Pull Request #1008 · async-profiler/async-profiler
Description Optimize wall clock profiling by skipping redundant samples when we know thread CPU time has not changed since the last sample. Related issues Resolves #1007. Motivation and context Mak...
To be fair, the @AndreiPangin #asyncprofiler profiler has been key to help troubleshooting this: - modifying the malloc branch to capture "live" set in malloc - with -e mprotect to check RSS increase on C2 arenas - with Java method profiling
Yep, it was part of an investigation we performed on @QuarkusIO due to an increased RSS usage reported at github.com/quarkusio/quar… Without that new tool, knowing what's going on would have been a mess (forcing me to add logs to the arena allocation on C2 :/)
github.com
Malloc Arena RSS increase between 2.16.11.Final and 3.x/main · Issue #36204 · quarkusio/quarkus
Description Environment: java version "17.0.7" 2023-04-18 LTS Java(TM) SE Runtime Environment (build 17.0.7+8-LTS-224) Java HotSpot(TM) 64-Bit Server VM (build 17.0.7+8-LTS-224, mixed mod...
That would be nice to report it on @AndreiPangin #asyncprofiler (unless it does it already) - I had no xp of getting it full, but in prod is where horrible things usually happen...
One note re #asyncprofiler : first get the number of total events and real time duration to find the appropriate interval to be used in the profiler, or it risk to receive Billions (many!) of events (2/2)
Which means that the primary bottleneck is elsewhere or is there, but something in ByteBuffer::getLong isn't good enough (in Netty we use Unsafe without bound checks, under the hood); profiling with #asyncprofiler with line of code granularity is the way to go ;P
I cannot really thanks enough @AndreiPangin for #asyncprofiler candies he put into it, for example github.com/async-profiler…

[TR] #java #docker #asyncprofiler ile ilgili random bir yayin. Ilgilenen uykusuzlar gelebilir :) twitch.tv/huseyinbabal
Ideas for #netty , someone want give it a shot? github.com/netty/netty/is… This can make it an easy integration with any JFR to flamegraphs tool (#asyncprofiler converter too)
github.com
JFR pooled allocation events · Issue #13423 · netty/netty
Similarly to JDK allocation events it would be nice to emit within and out of TLAB allocation events (which cause new arena creation), which include stack trace, size d TLAB and/or allocation size ...
github.com/async-profiler… Classify option for #asyncprofiler nice one :)
I am staring at #asyncprofiler and @javamissionctrl here :)
How do profilers like #asyncprofiler work? How to write your own? Get your intense coding hat on because this brand new series by @parttimen3rd @SweetSapMachine tries to write a tiny sampling-based #profiler from scratch! foojay.io/today/writing-… #foojaytip
"Journey to a N-fold improvement due to a stealthy scalability issue" by @forked_franz buff.ly/3BdweQH #java #jvm #asyncprofiler

A profiler that can help in detecting memory heap leaks - #AsyncProfiler #PerformanceEngineering #CloudCostOptimization lnkd.in/d2zFDfq9

Tired of dealing with #AsyncProfiler binaries just to embed the profiler into your library: Try github.com/parttimenerd/a… which does nothing more than that, built from the official binaries. AsyncProfiler is just an "AsyncProfilerLoader.load()" away.
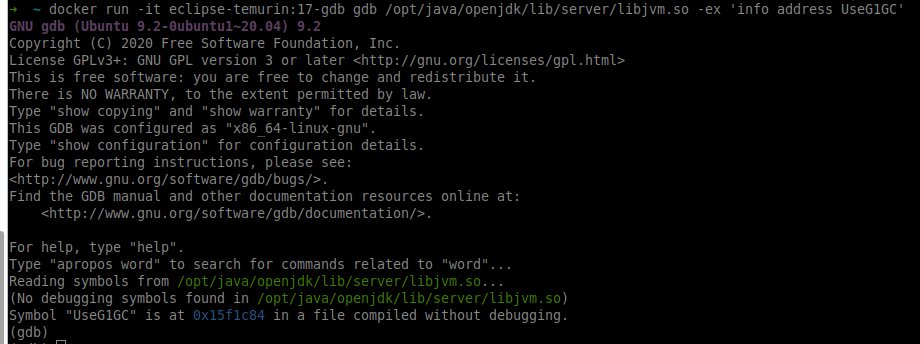
#asyncprofiler combines the same events with JVM stacktraces to profile Java applications, so you're able to see which Java method had all those cache misses.
AsyncGrtCallTrace, last time I have checked, reports vthreads stack traces starting from who resume them (in case they were previously parked) - at least according to #asyncprofiler and TBH I like it (1/2)
#AsyncProfiler's flamegraph of Virtual Threads - check it out and zoom in! github.com/petrbouda/virt…
How #Hazelcast optimized its #SQL engine by using #AsyncProfiler & #FlameGraphs. #PerformanceEngineering lnkd.in/dy-EwpHW

My journey to understand different #java profilers and how the lie continues 🚀 🤯 Important checkpoints to understand - safepoint bias, #asyncprofiler (AsyncGetCallTrace API), performance counters, now digging into "skid". 📚 Links that I found most useful so far 🧵
That's why I love the honesty of #asyncprofiler that allow to disable its stack recovery techniques and just report what's been collected, broken too
#JFR or #AsyncProfiler? No need to choose - they can work together to produce a single integrated recording.
inlining/interpreted/compiled/native frames are landing on @AndreiPangin #asyncprofiler github.com/jvm-profiling-… Bye bye perf map...we've been good friends for many years...
How do profilers like #asyncprofiler work? How to write your own? Get your intense coding hat on because this brand new series by @parttimen3rd @SweetSapMachine tries to write a tiny sampling-based #profiler from scratch! foojay.io/today/writing-… #foojaytip
#AsyncProfiler's flamegraph of Virtual Threads - check it out and zoom in! github.com/petrbouda/virt…
Where's String::indexOf on #asyncprofiler flames? There is nothing AP can do here to help (BCI is just wrong) and Arrays::fill has the same "issue", but is nice to see such honesty, kudos to @AndreiPangin (again). Same feelings for @RichardWarburto #honestprofiler ;)
Async-Profiler is great. Hope that the data provided is correct. Will see and check what can be done to avoid the expensive cache misses. We already squeezed the CPU lemon a lot... #xlt #asyncprofiler
We just started :-) Use this link to view the live stream and participate: youtube.com/watch?v=TDpbt4… #Profilers #AsyncProfiler
Something went wrong.
Something went wrong.
United States Trends
- 1. Thanksgiving 392K posts
- 2. Golesh 2,580 posts
- 3. Fani Willis 16K posts
- 4. Camp Haven 7,297 posts
- 5. Trumplican 3,296 posts
- 6. #WipersDayGiveaway N/A
- 7. Hong Kong 16.7K posts
- 8. NextNRG 1,087 posts
- 9. Khabib 8,190 posts
- 10. Tom Hardy 1,694 posts
- 11. Mendy 4,654 posts
- 12. Denzel 3,218 posts
- 13. Stranger Things 166K posts
- 14. Africans 26.8K posts
- 15. Wine 39.3K posts
- 16. Riker N/A
- 17. Idris 7,767 posts
- 18. #PuebloEnBatallaYVictoria 4,706 posts
- 19. #TejRan 4,155 posts
- 20. Fassbender 1,095 posts