#chartanalysis نتائج البحث

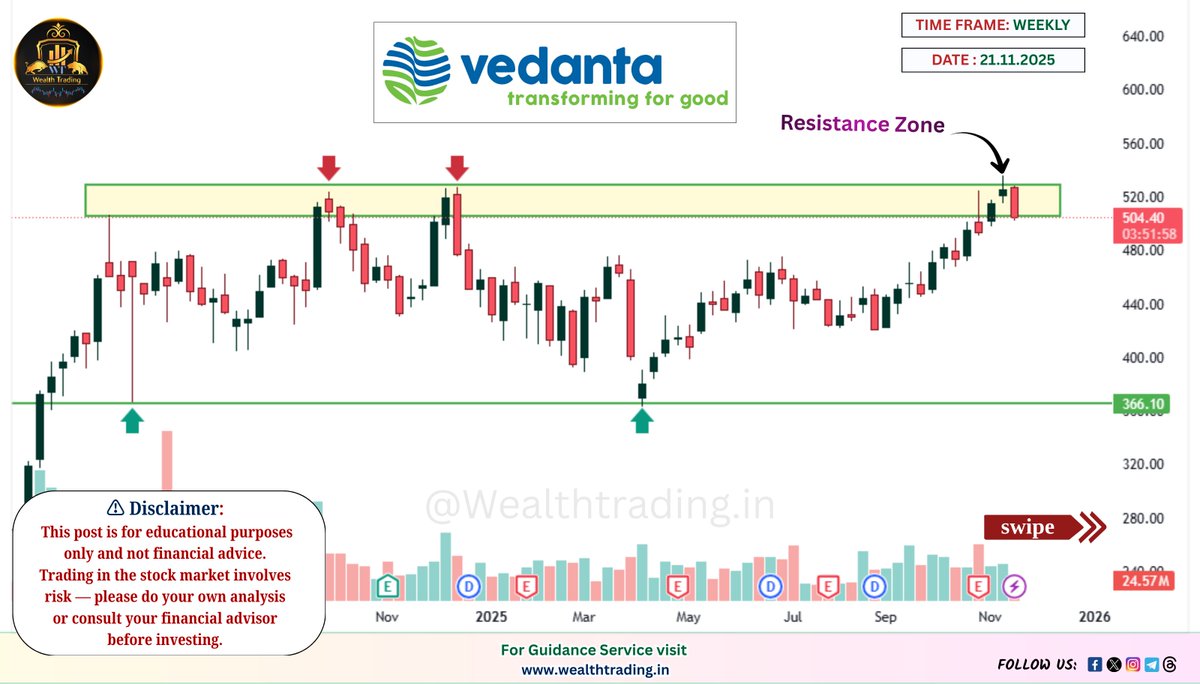
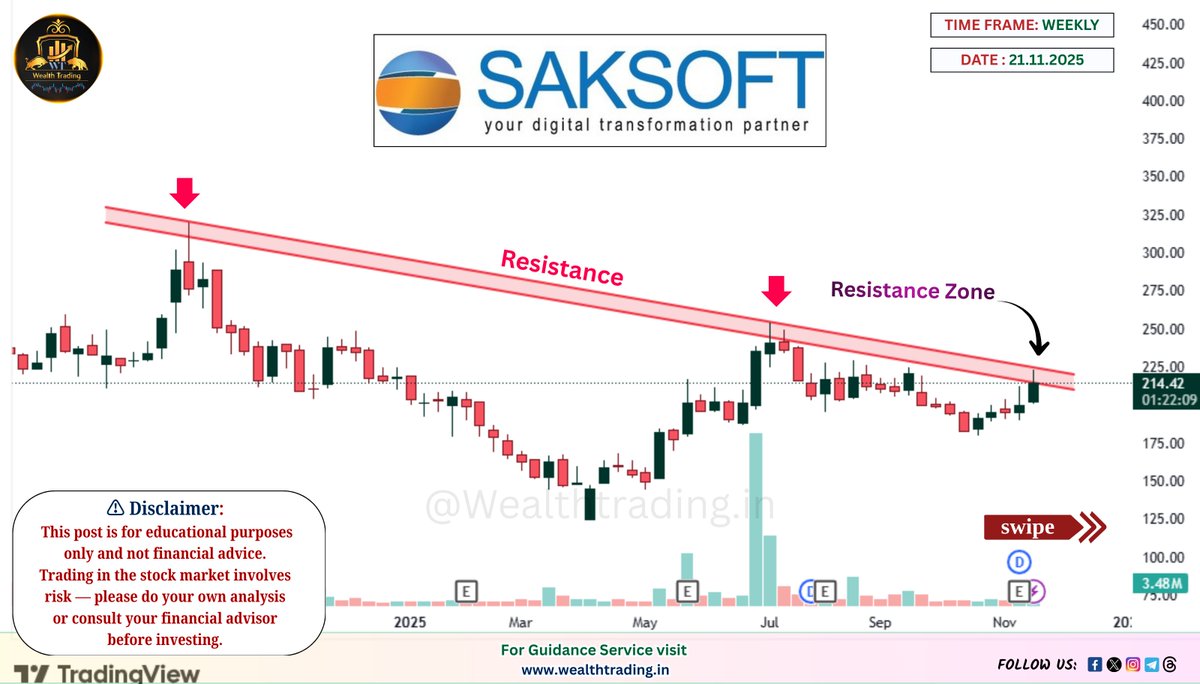
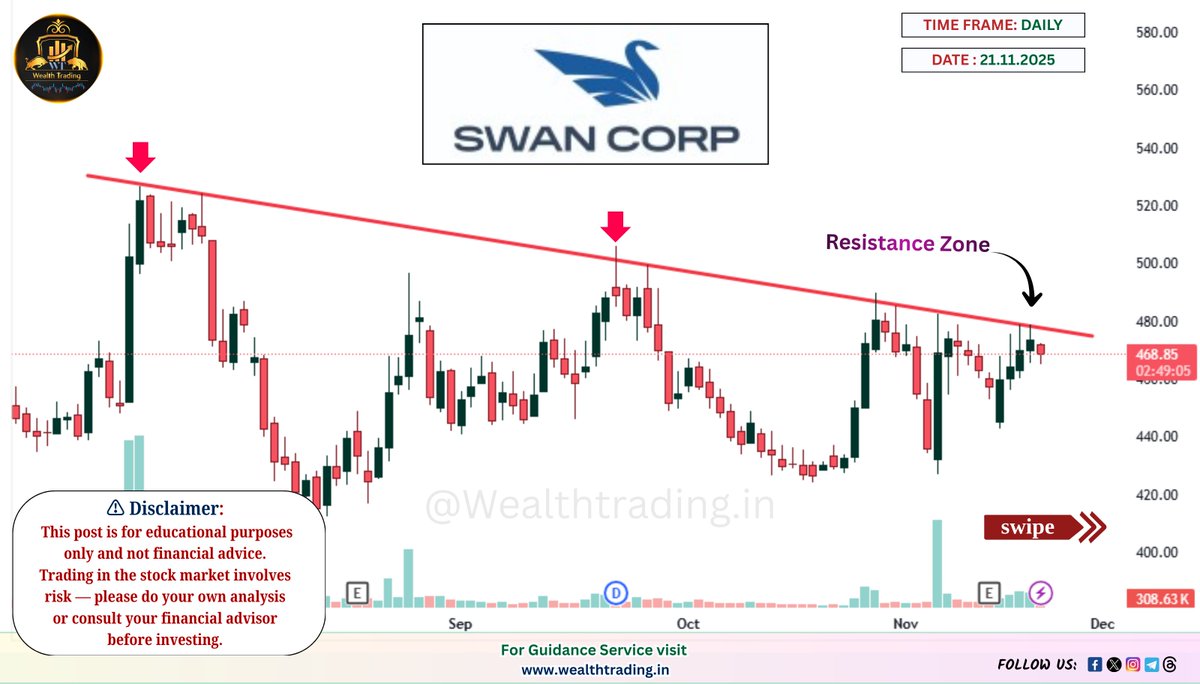
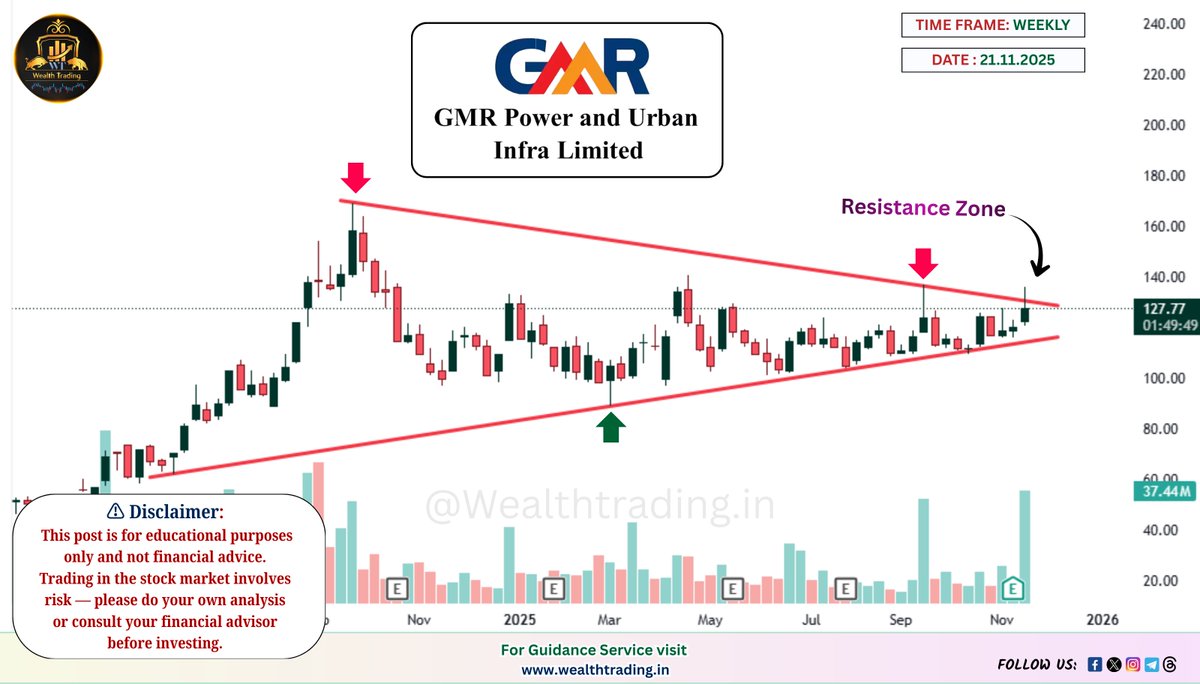
🔥 𝗕𝗥𝗘𝗔𝗞𝗢𝗨𝗧 / 𝗥𝗘𝗦𝗜𝗦𝗧𝗔𝗡𝗖𝗘 𝗦𝗧𝗢𝗖𝗞𝗦 🚀 🔸 GMR Power & Urban Infra Ltd 🔸 Swan Corp Limited 🔸 Saksoft Limited 🔸 Vedanta Limited #BreakoutStocks #ResistanceZone #ChartAnalysis #Investing

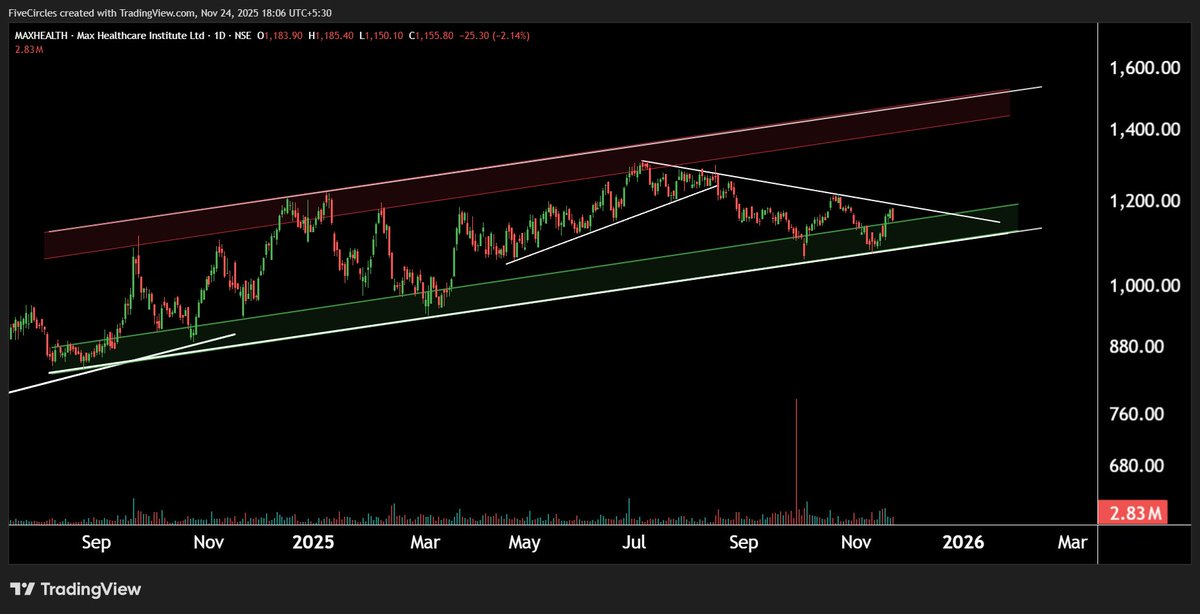
Max Healthcare Showing Strength Near Support Zone #MaxHealth #ChartAnalysis #TechnicalAnalysis #SupportZone #ChannelPattern #PriceAction #TrendlineResistance #BreakoutWatch #BullishSetup

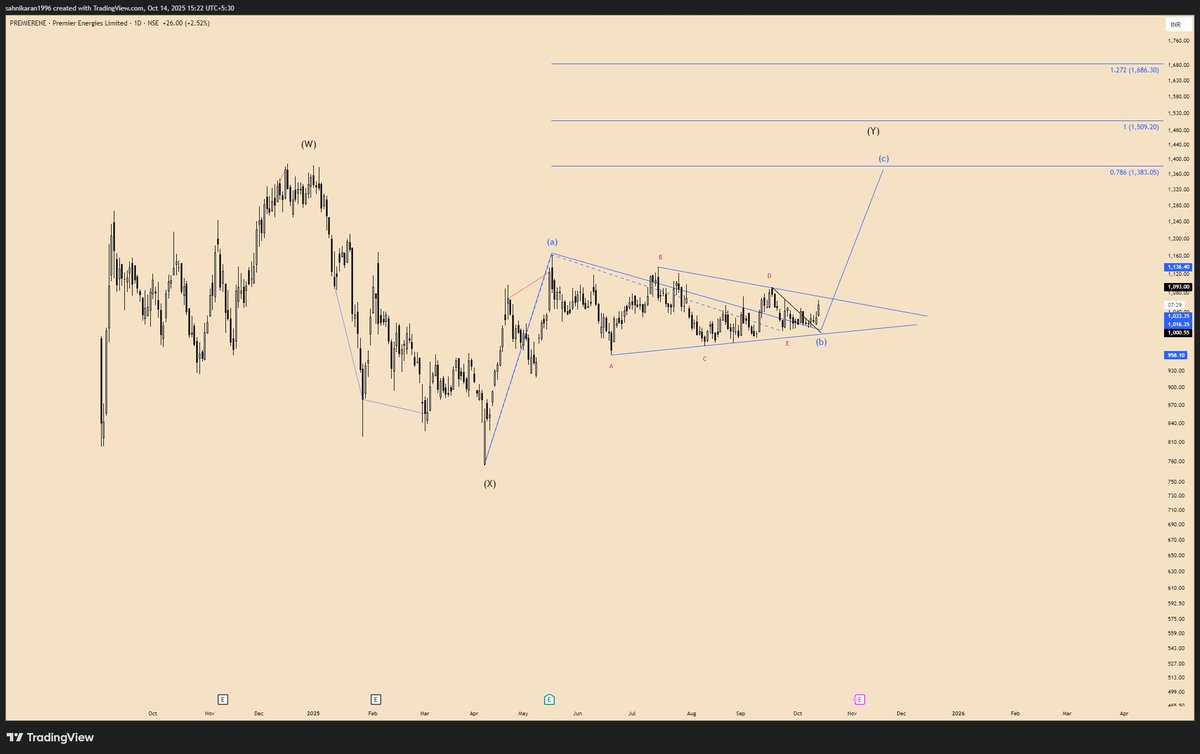
Premier Energies is showing a bullish breakout setup with a clean triangle pattern forming. Watching closely for the next move! #StockMarket #ChartAnalysis

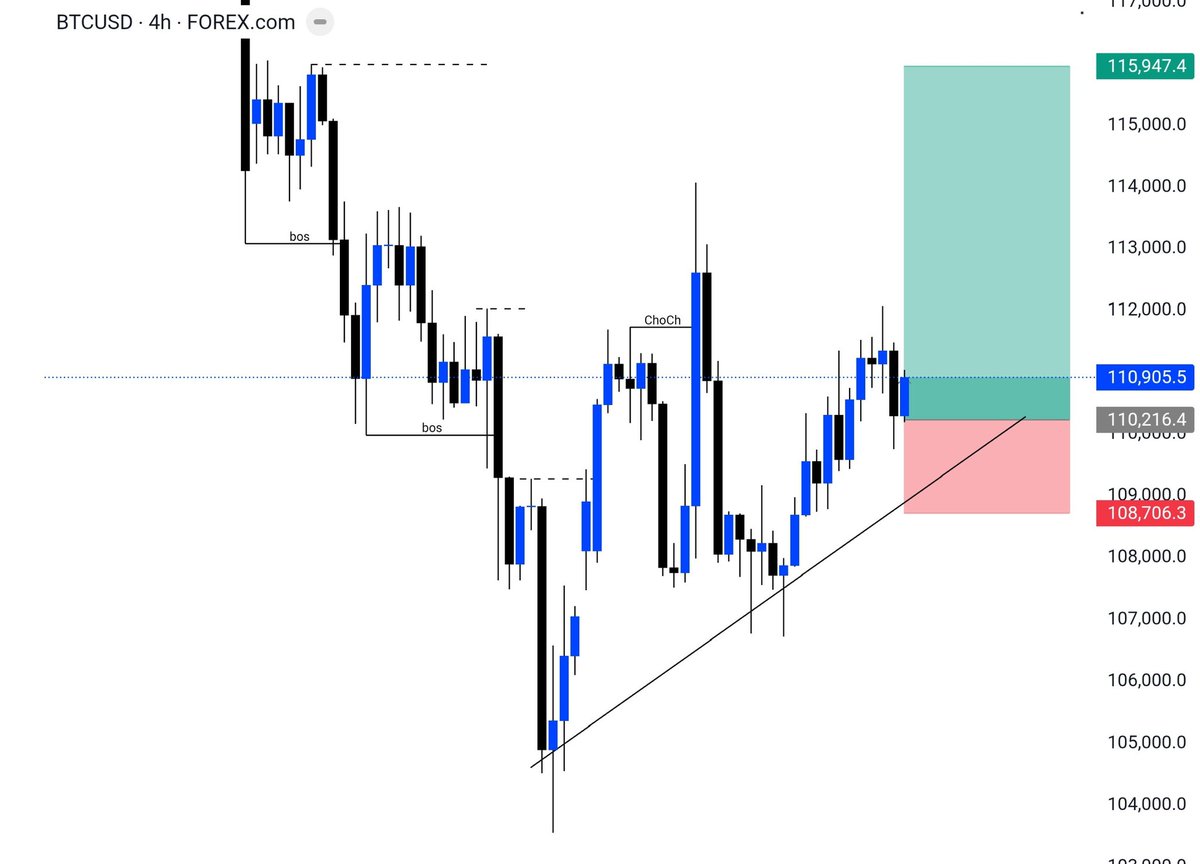
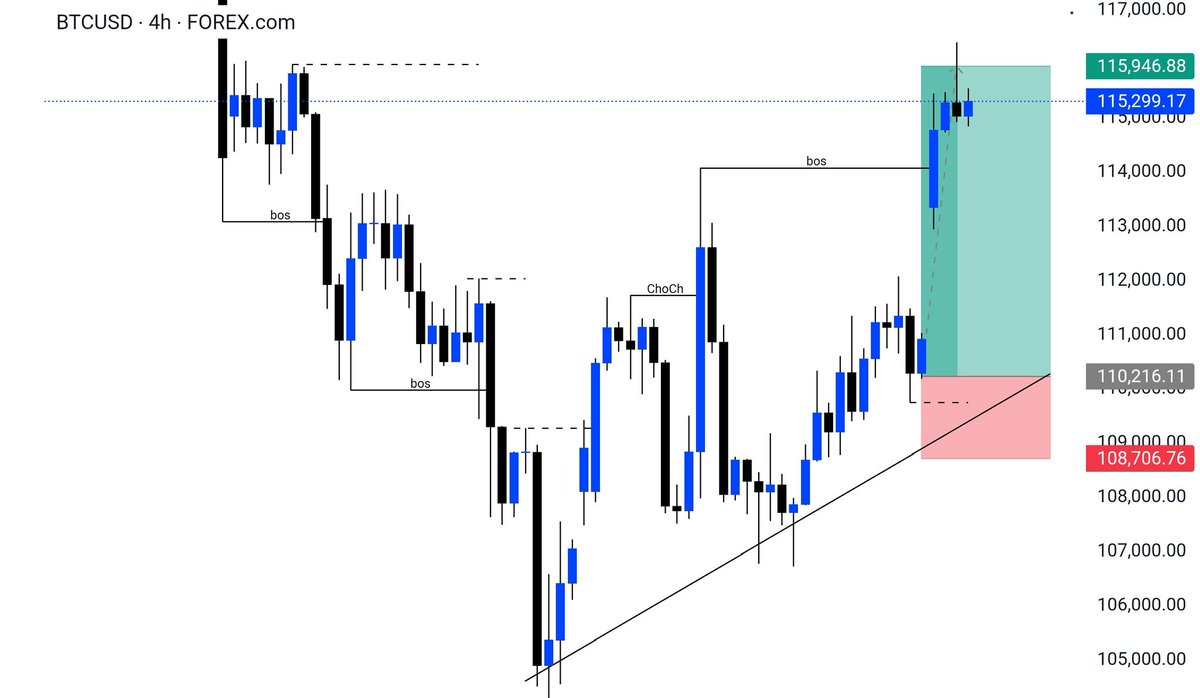
#BTCUSD Before And After results Target SMASHED 🔥📈✅ #Crypto #ChartAnalysis #BTC #TechnicalAnalysis #BTCUSDT #Bitcoin
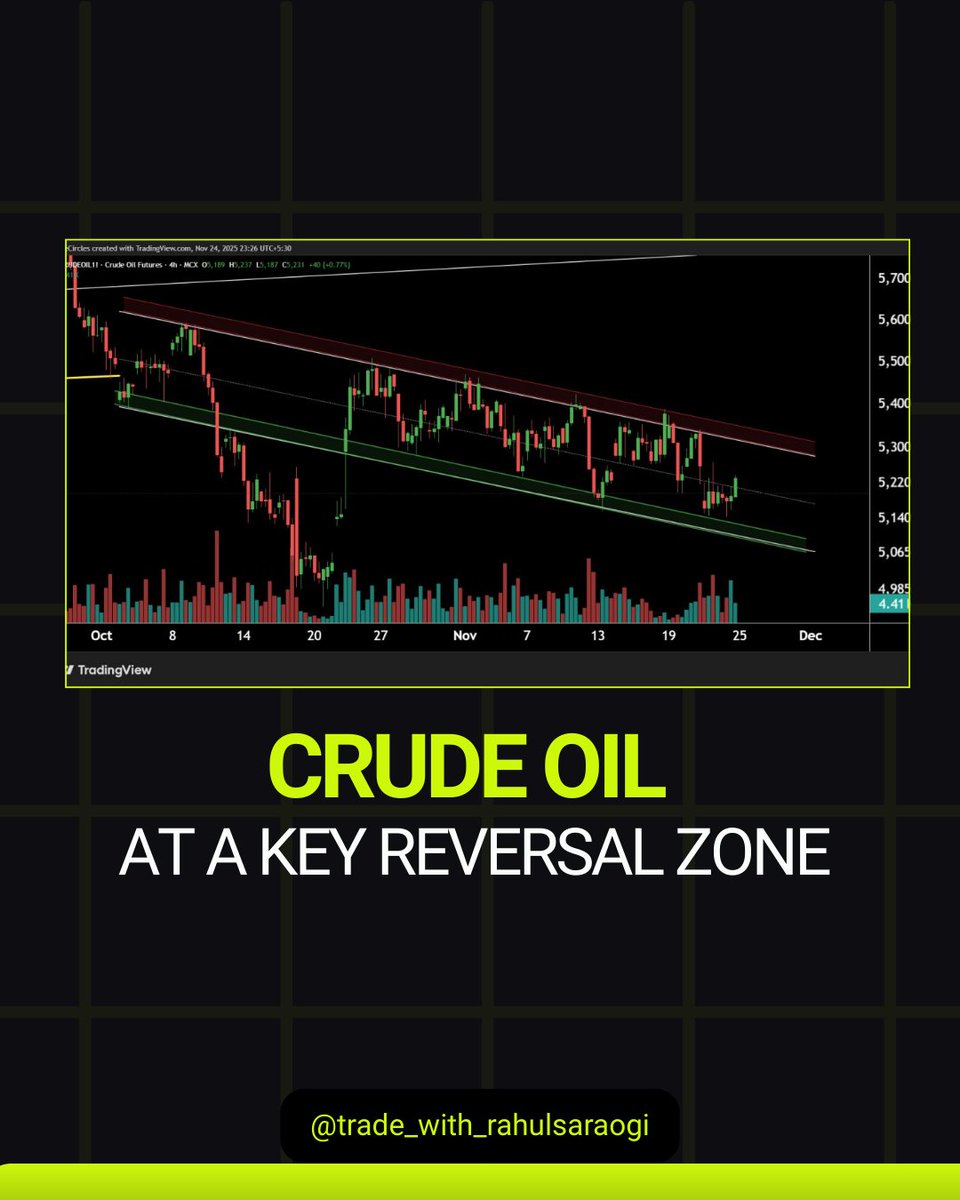
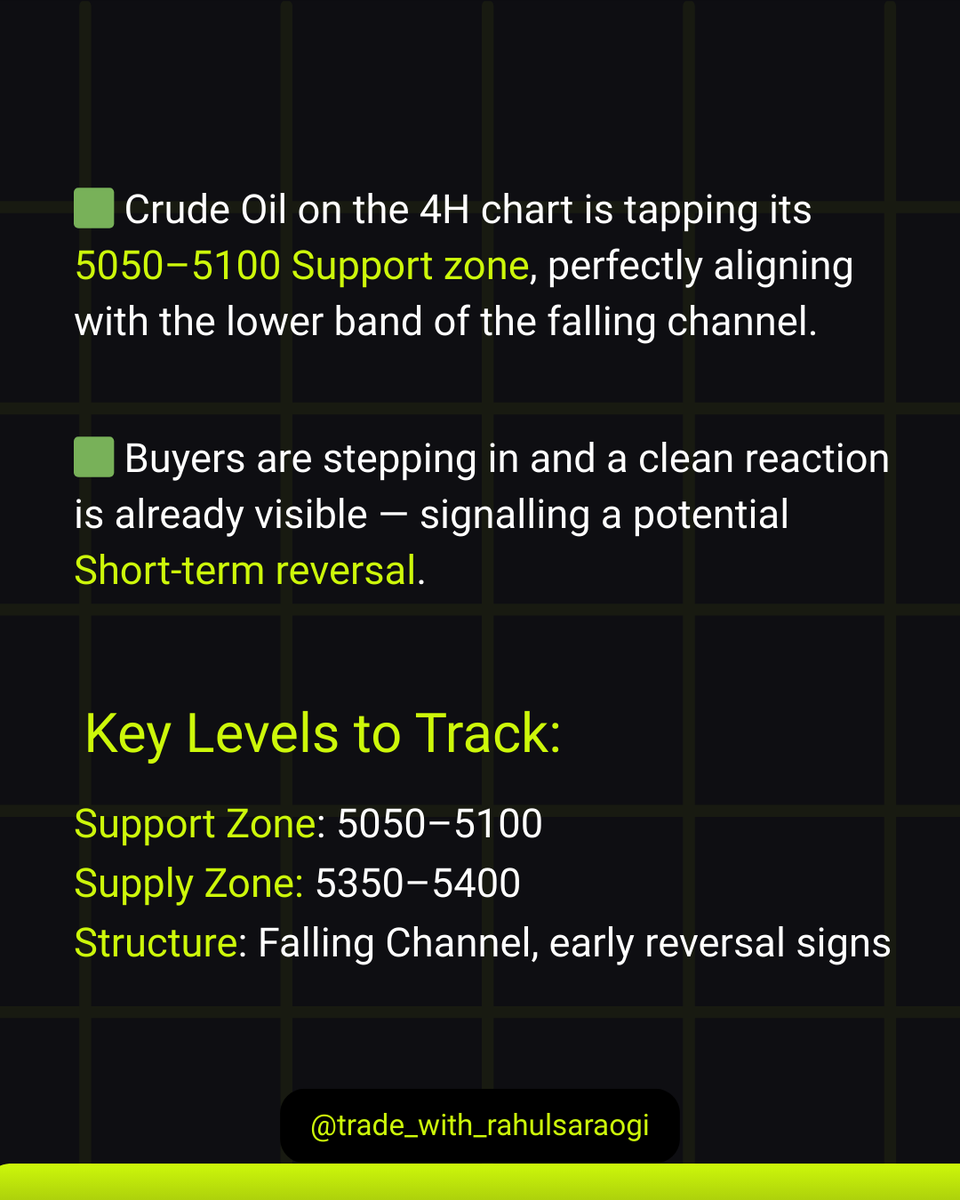
Crude Oil at a Critical Technical Zone Fresh chart analysis shows key support–resistance levels tightening, with momentum hinting at a potential decisive move Smart trading starts with smart analysis. #CrudeOil #ChartAnalysis #CommodityTrading


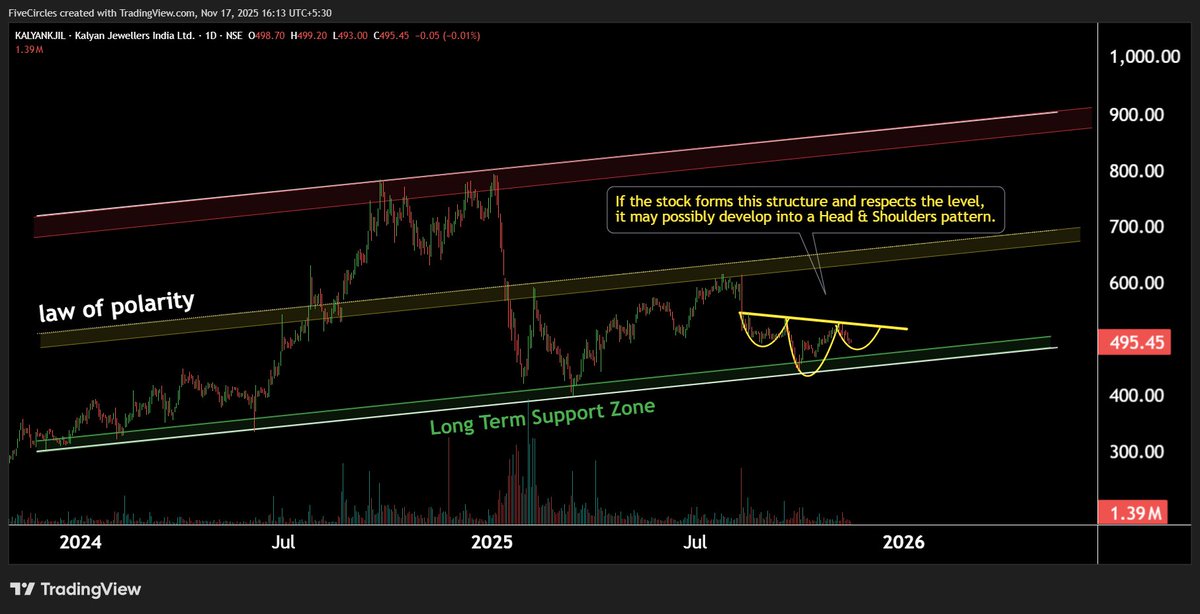
Kalyan Jewellers : Possible Head & Shoulders Pattern ? #KalyanJewellers #ChartAnalysis #TechnicalAnalysis #HeadAndShoulders #PriceAction #ParallelChannel #SupportZone #BreakoutWatch #BullishSetup #StockMarketIndia #MarketUpdate #SwingTrading #TrendTrader #TradingCommunity

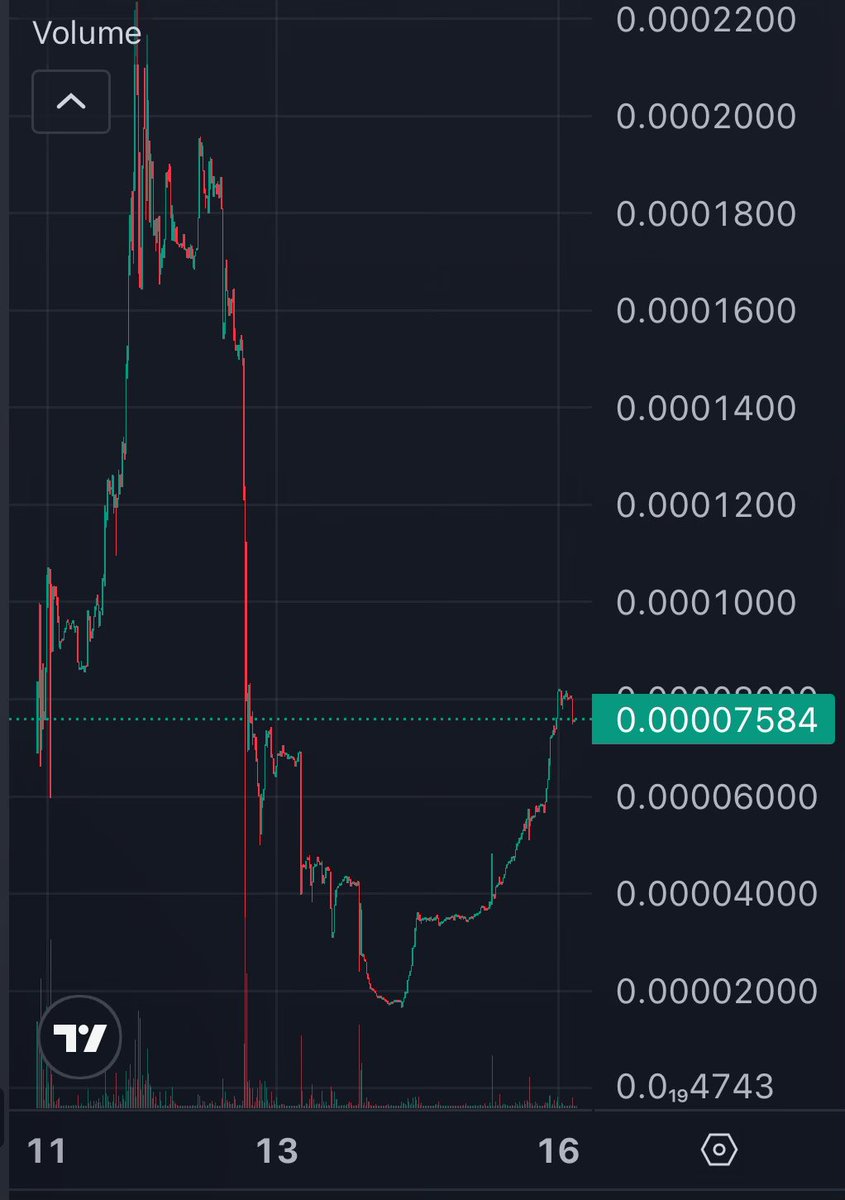
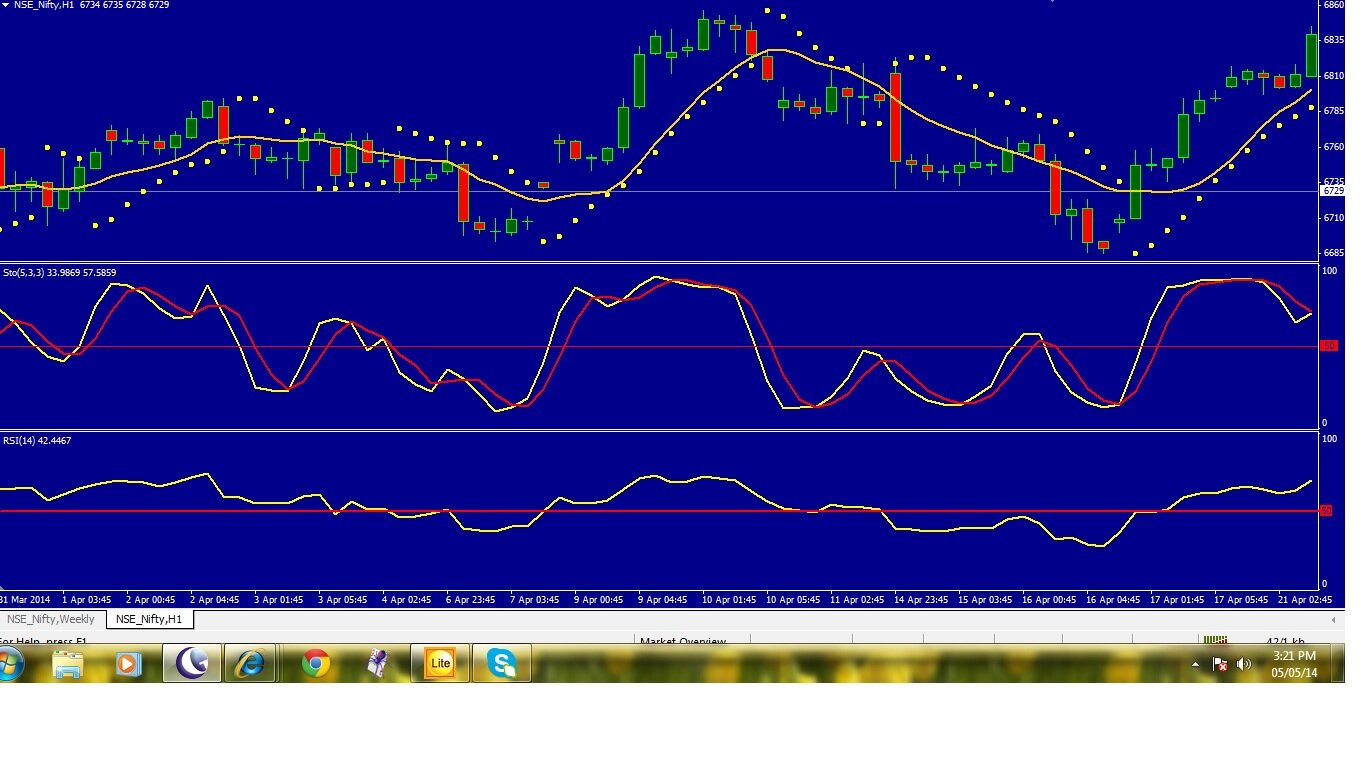
Can any technical analysts interpret this chart for me? #TechnicalAnalysis #ChartAnalysis #TradingView #Trading
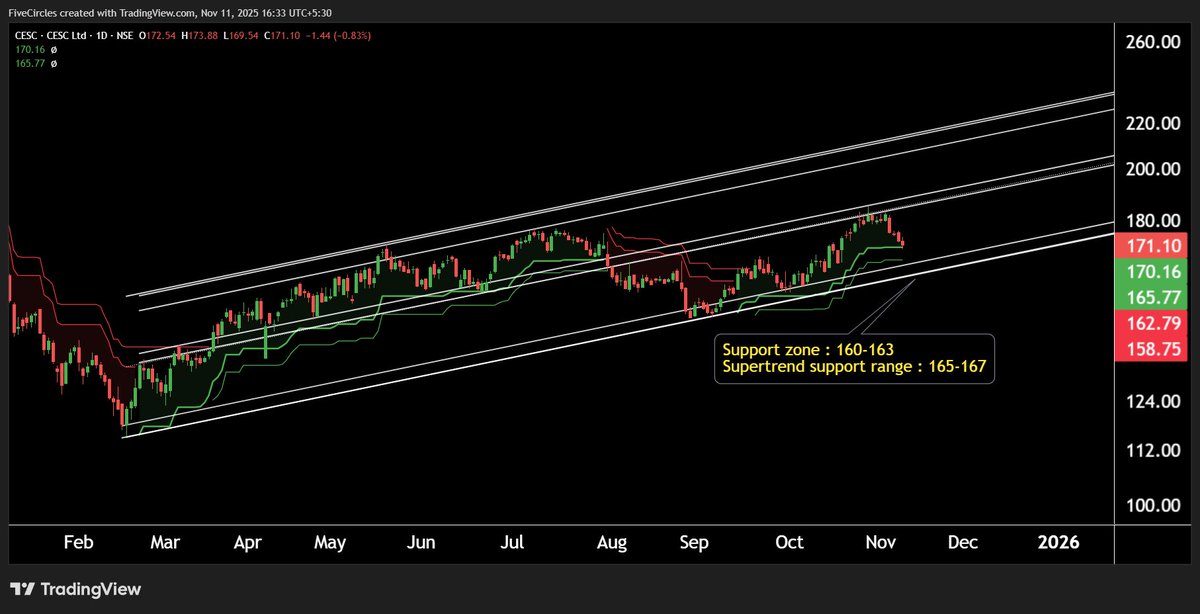
CESC Set to Ignite: Key Levels Triggering a Bull Move #BullishSetup #ChartAnalysis #PriceActionTrading #RisingWedgeRetest #MarketMomentum #KeyLevelsMatter #StockMarketIndia #TradersOnAlert #WatchlistAlert #TrendlineRespect #BullRunLoading #CESCStock


Send in ♾️ Unlimited Images 📸 of your charts to ai 🤖 and receive different trading ideas based on their perspective! #DayTrading #Chartpatterns #chartanalysis

#MARUTI 15374 Bulls have to wait for some time. Hourly chart oversold which provide some bounce but structure is not promising for bulls. Disclaimer: No buying /selling recommended #ChartAnalysis #NIFTYAUTO
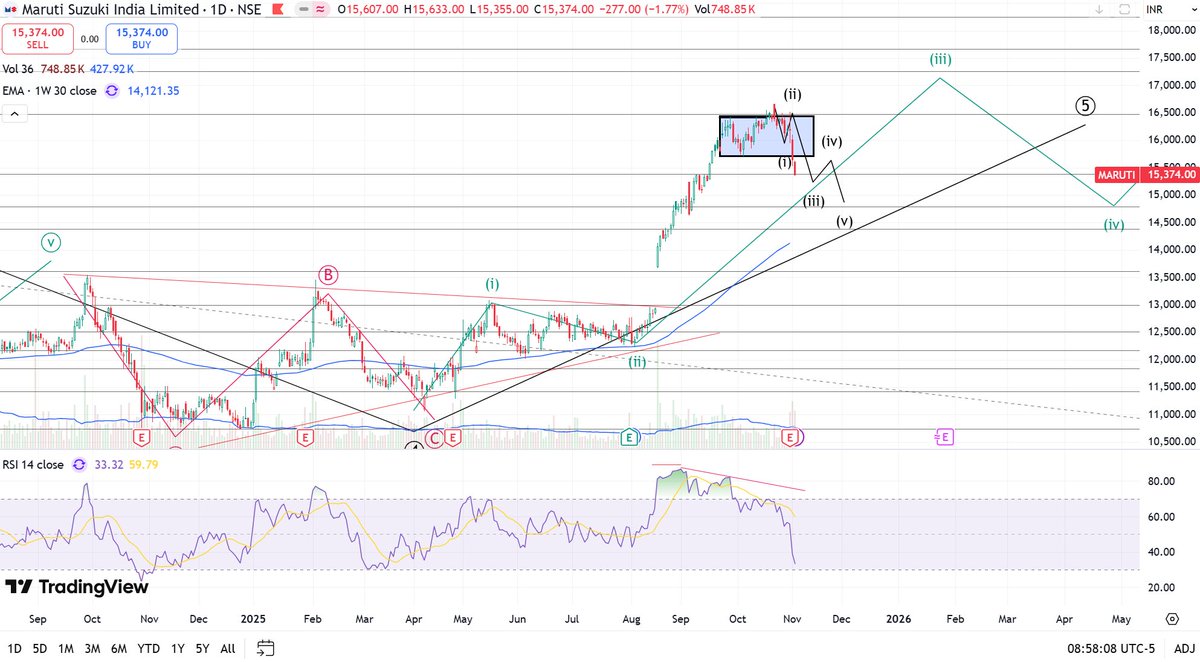
#MARUTI 16150 Consolidating in rectangle pattern, RSI cooling off coming result may shift the sentiment. Closing below 15500 may trigger some pain Disclaimer: No buying /selling recommended #ChartAnalysis #NIFTYAUTO

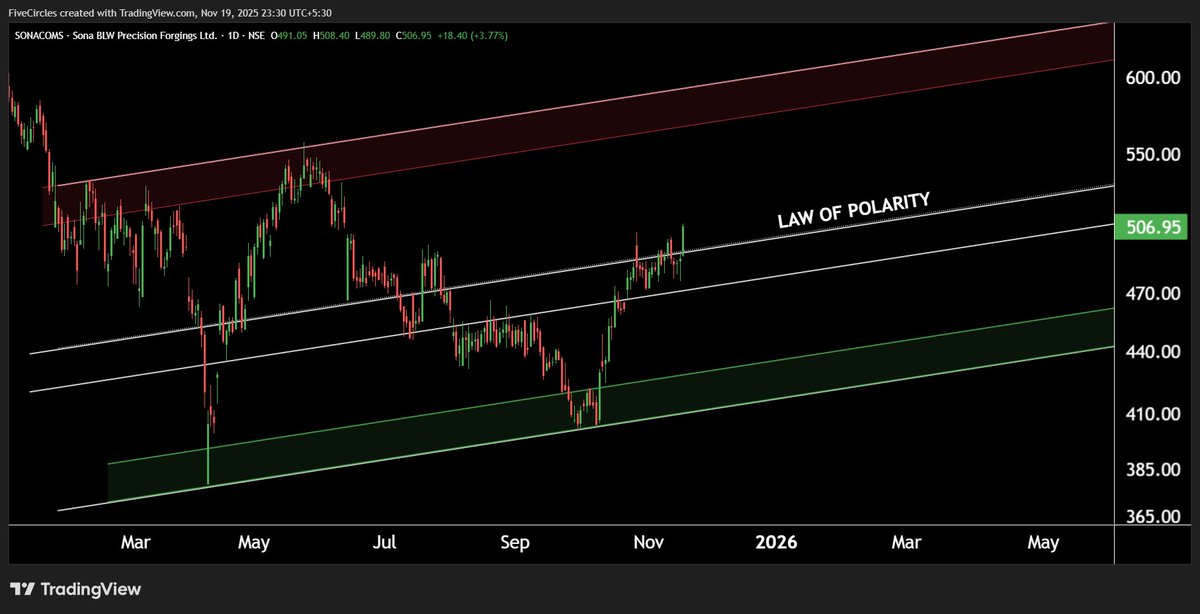
SONACOMS: Bullish Momentum Activated #StockMarketIndia #ChartAnalysis #TechnicalAnalysis #PriceAction #BreakoutWatch #TrendTrader #SwingTrading #MarketUpdate #BullishSetup #TradingCommunity
Biocon Under Heavy Selling Pressure — Momentum Turning Weak #Biocon #SharpDecline #ChartAnalysis #TechnicalAnalysis #SupportZone #PriceAction #DowntrendAlert #MarketUpdate #StockMarketIndia #TradingCommunity #TrendAnalysis #BearishMove


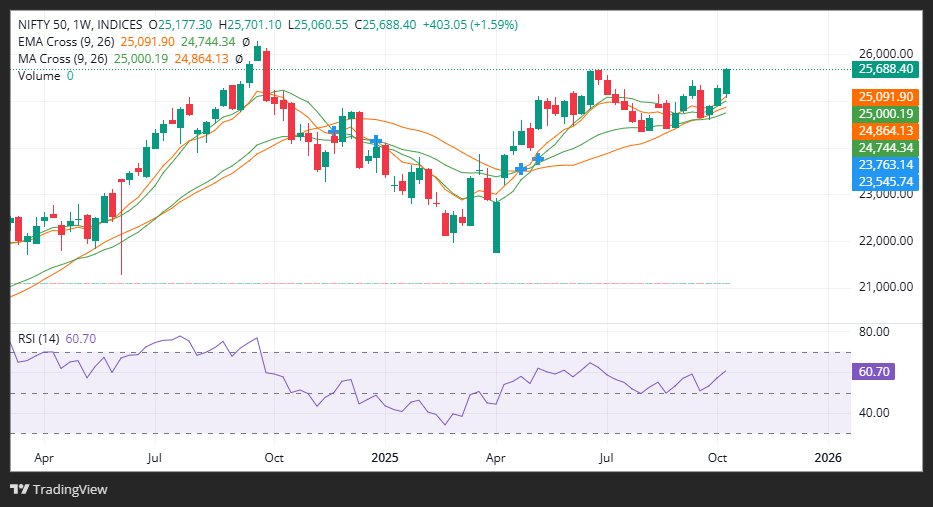
Nifty 50 retesting previous highs 🔥 Double top @Rishabhh005 Sir Nifty All Time High Wale😂? #Nifty #ChartAnalysis #Traders

Micro balances on stock charts reveal possible breakout & breakdown zones. Learn to spot these key areas and improve your trading strategy. #StockTrading #ChartAnalysis
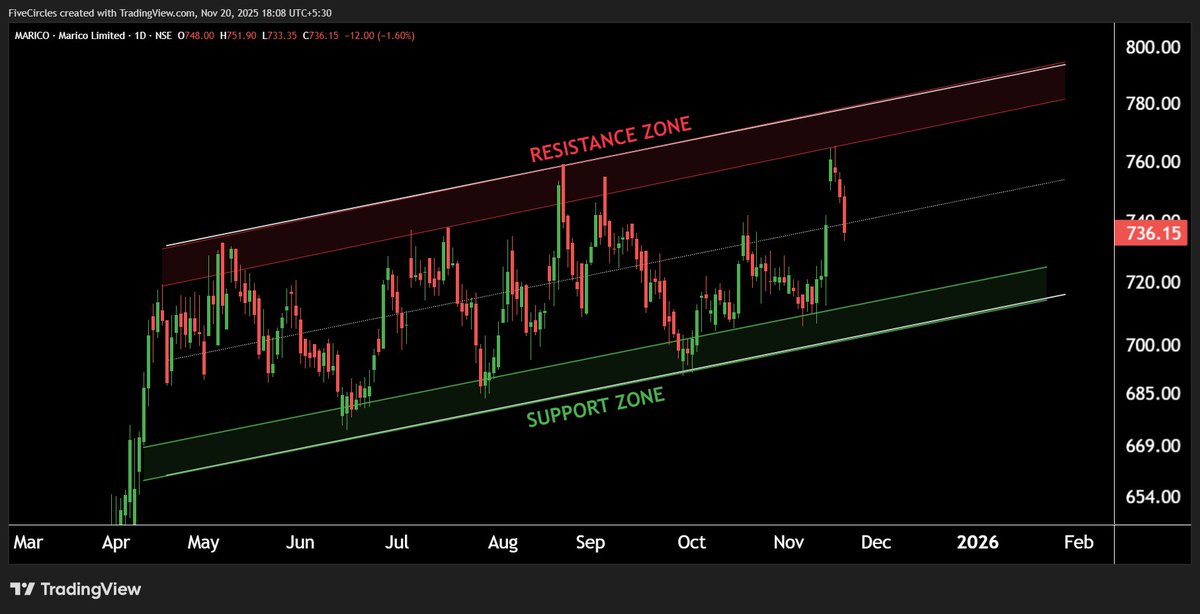
MARICO Under Pressure — Sharp Fall on the Charts! #Marico #ChannelBreakdown #ChartAnalysis #BearishMove #TechnicalAnalysis 📌 #SupportZone #PriceAction #DowntrendAlert #ParallelChannel #MarketUpdate #SellingPressure #TrendAnalysis #StockMarketIndia

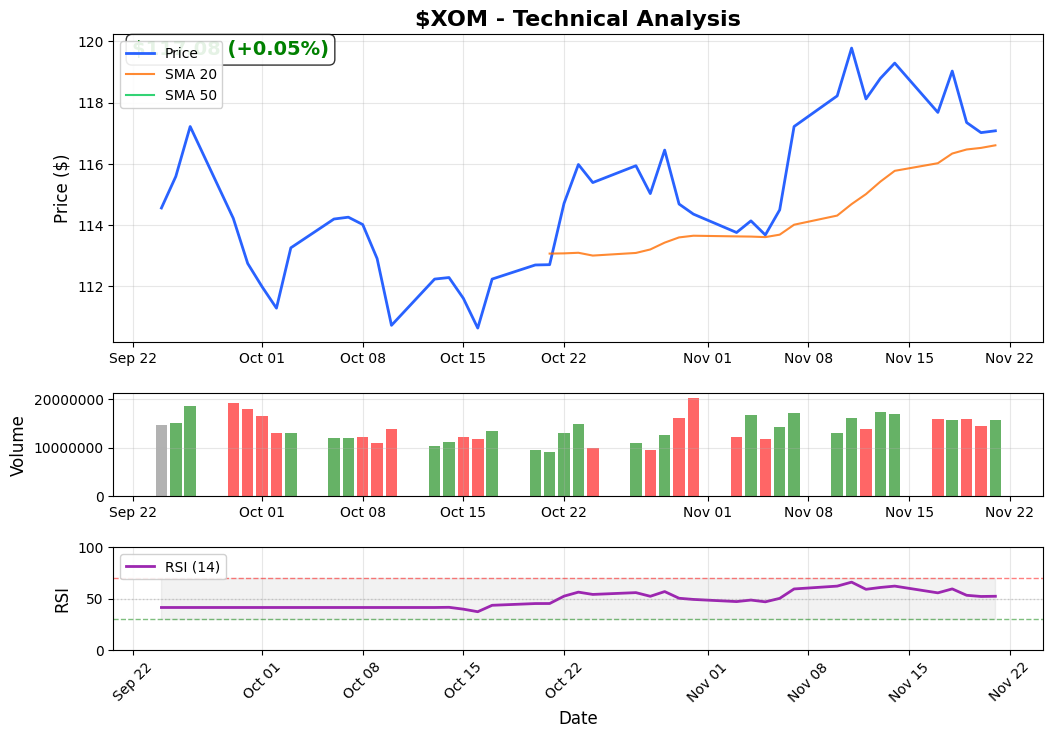
$XOM closed at $117.08 (+0.05% today). Moving in line with sector peers. RSI at 52.4 showing neutral momentum. Watching for volume confirmation on the next move. Chart attached. #SwingTrading #ChartAnalysis #Stocks
📊 Snap your chart, let AI 🤖 analyze, and find the top trade with high probability! 🚀 Stack multi-timeframe analysis for a killer AI consensus! 💡 #Trading #AI #ChartAnalysis #StockMarket


📈 Trend reversal spotted! Who’s ready to ride this move? 🔥 #Trading #ChartAnalysis #TechnicalAnalysis #Stocks #Crypto #Forex #DayTrading #PriceAction #Bullish #Bearish #TraderLife #ChartPatterns #MarketTrends #Finance

GBP/USD and USD/CAD trade updates and chart analysis. Stay informed on currency trends and make smarter trading decisions. #CurrencyTrading #ChartAnalysis


Premier Energies is showing a bullish breakout setup with a clean triangle pattern forming. Watching closely for the next move! #StockMarket #ChartAnalysis
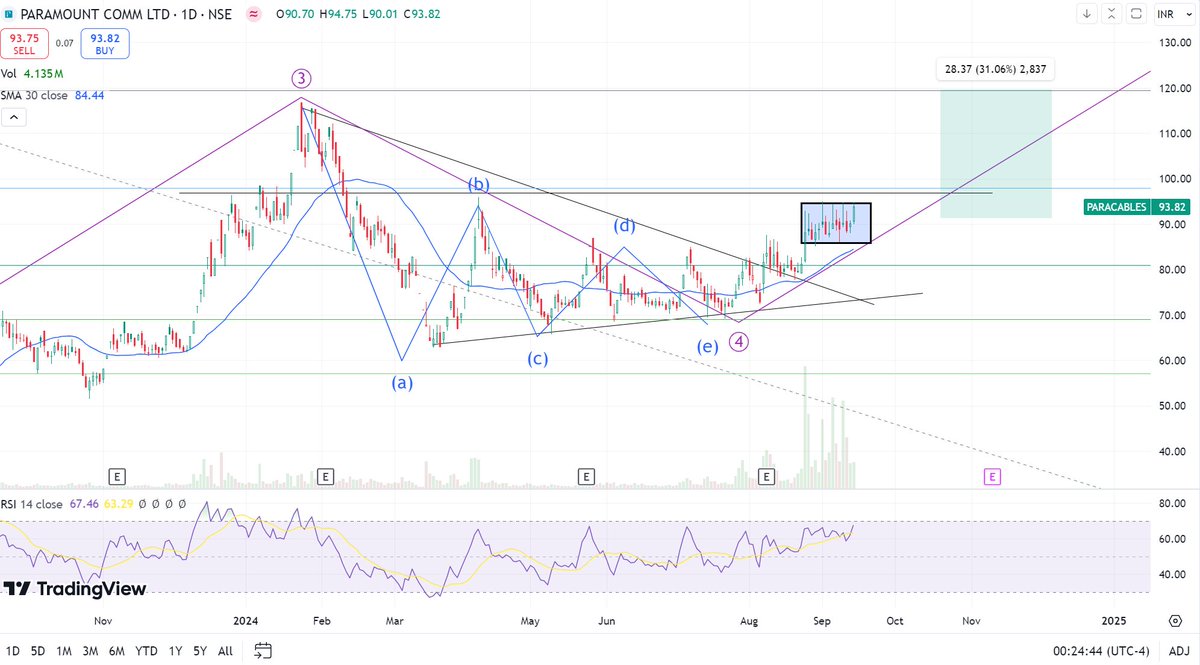
#PARACABLES 42 Till 66 it was very much in control, but as you can see it change the trend and went towards south. Stop loss are more important then anything else. Disc : No buy/sell recommendation. DYOR before buying or selling. #PSUBanks #ChartAnalysis
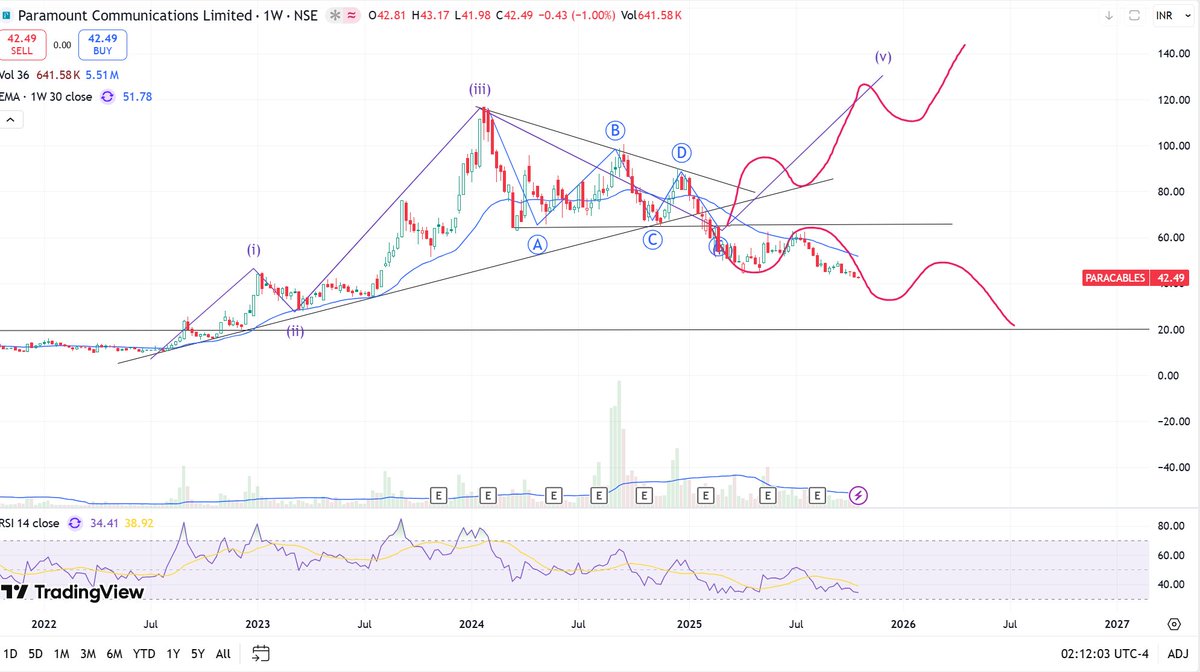
#PARACABLES 93 Once again reaching resistance zone Consolidating from last two weeks Disc : No buy/sell recommendation. Do your own analyses below buying or selling.
🔥 𝗕𝗥𝗘𝗔𝗞𝗢𝗨𝗧 / 𝗥𝗘𝗦𝗜𝗦𝗧𝗔𝗡𝗖𝗘 𝗦𝗧𝗢𝗖𝗞𝗦 🚀 🔸 GMR Power & Urban Infra Ltd 🔸 Swan Corp Limited 🔸 Saksoft Limited 🔸 Vedanta Limited #BreakoutStocks #ResistanceZone #ChartAnalysis #Investing
#BTCUSD Before And After results Target SMASHED 🔥📈✅ #Crypto #ChartAnalysis #BTC #TechnicalAnalysis #BTCUSDT #Bitcoin
Max Healthcare Showing Strength Near Support Zone #MaxHealth #ChartAnalysis #TechnicalAnalysis #SupportZone #ChannelPattern #PriceAction #TrendlineResistance #BreakoutWatch #BullishSetup

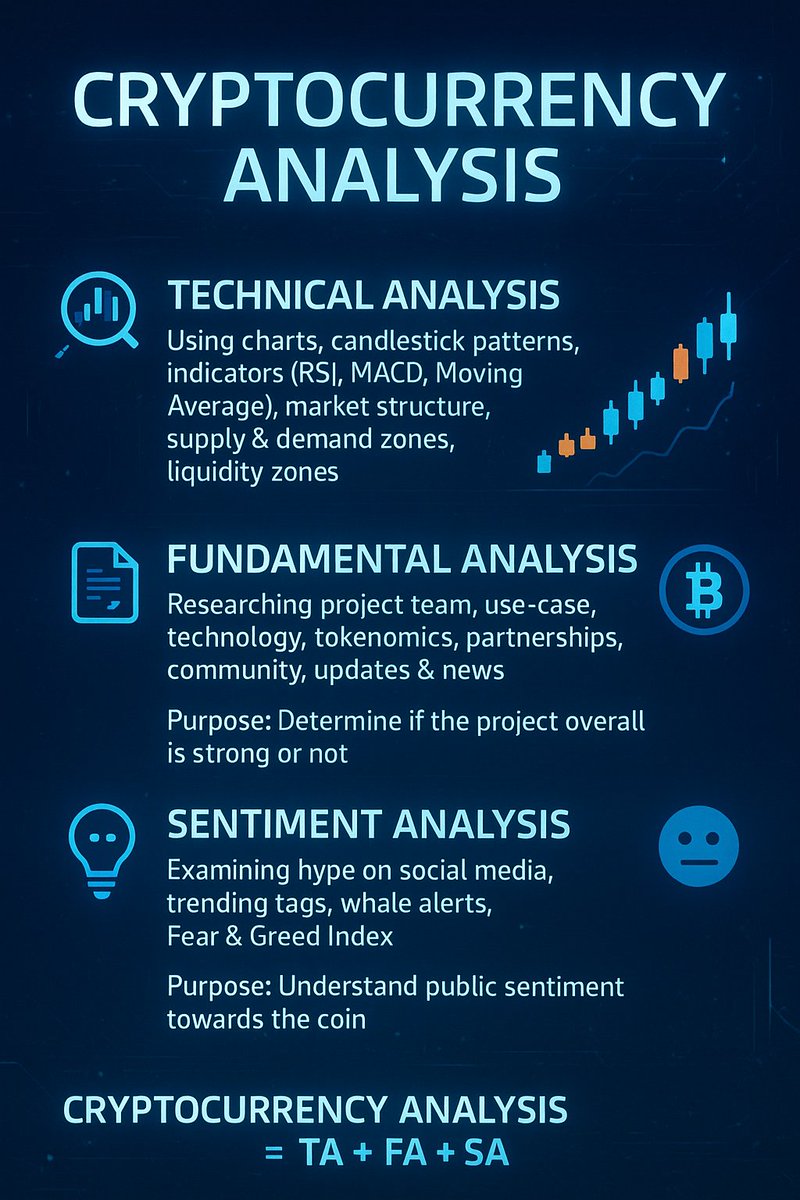
Understanding Cryptocurrency Analysis is the key to make the right decisions in crypto trading, For any type of trader analysis make your trading less risk and high probability of profit. #TechnicalAnalysis #PriceAction #ChartAnalysis #sentimentalAnalyssis #Market #analysis
Crude Oil at a Critical Technical Zone Fresh chart analysis shows key support–resistance levels tightening, with momentum hinting at a potential decisive move Smart trading starts with smart analysis. #CrudeOil #ChartAnalysis #CommodityTrading

Messy charts = messy trades. 🧹📉 Here are 3 quick wins to clean up your charts and trade with clarity this September. Save this post 🔖 for your daily prep. #PropNimbus #ChartAnalysis #ForexTips #TradingLikeAPro

CESC Set to Ignite: Key Levels Triggering a Bull Move #BullishSetup #ChartAnalysis #PriceActionTrading #RisingWedgeRetest #MarketMomentum #KeyLevelsMatter #StockMarketIndia #TradersOnAlert #WatchlistAlert #TrendlineRespect #BullRunLoading #CESCStock
Can any technical analysts interpret this chart for me? #TechnicalAnalysis #ChartAnalysis #TradingView #Trading
Something went wrong.
Something went wrong.
United States Trends
- 1. #socideveloper_com N/A
- 2. #lip_bomb_RESCENE N/A
- 3. #River 3,954 posts
- 4. #heatedrivalry 18K posts
- 5. Ravens 59.3K posts
- 6. ilya 18.4K posts
- 7. Lamar 46.9K posts
- 8. #DaesangForJin 20.4K posts
- 9. Shane 22.1K posts
- 10. Black Friday 272K posts
- 11. Bengals 52.8K posts
- 12. Joe Burrow 21.4K posts
- 13. Connor 15.5K posts
- 14. BNB Chain 8,413 posts
- 15. Zay Flowers 4,254 posts
- 16. hudson 12.2K posts
- 17. Sarah Beckstrom 229K posts
- 18. Third World Countries 30.2K posts
- 19. scott hunter N/A
- 20. Derrick Henry 4,503 posts