#forestplot نتائج البحث

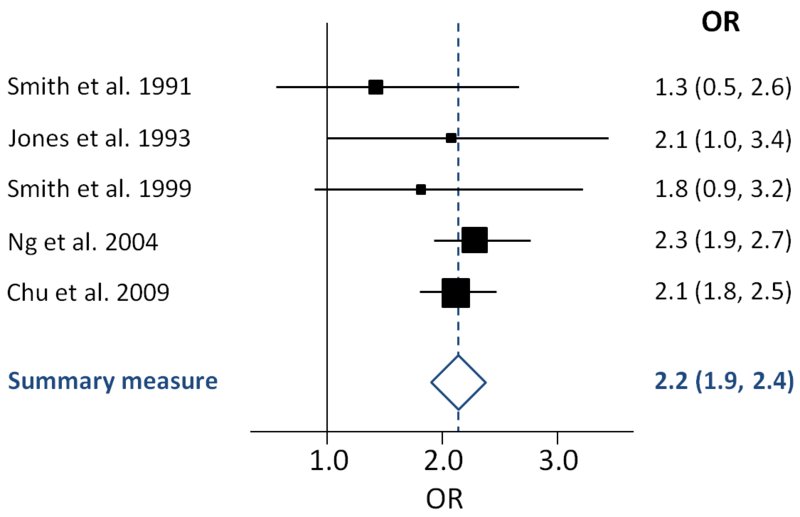
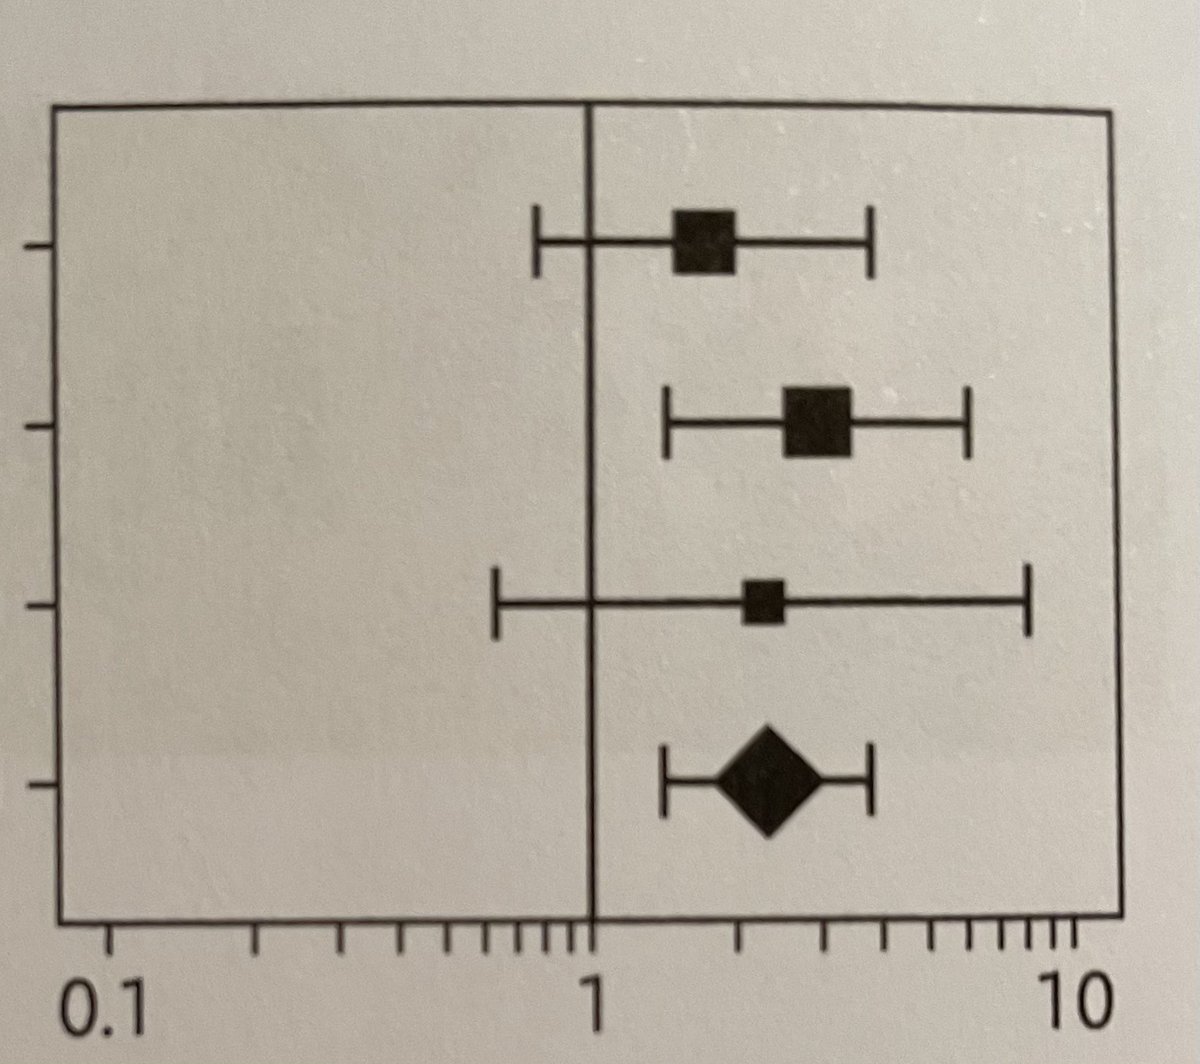
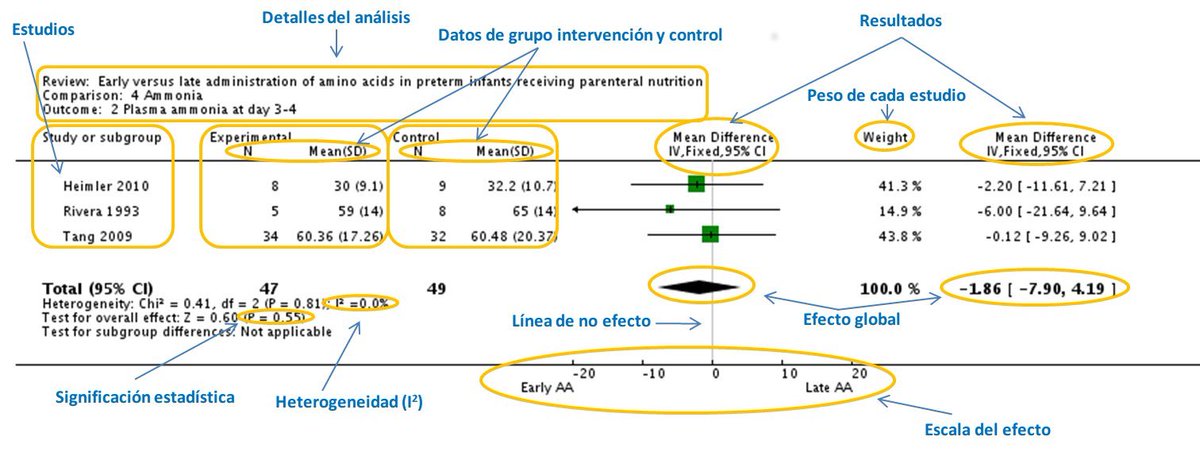
¿Cómo leer un metaanálisis? Los resultados de un metaanálisis se organizan a través de un gráfico llamado Forest Plot (diagrama de bosque) Un #ForestPlot se divide en seis columnas y los resultados individuales de cada estudio se disponen en filas sucesivas #Hilo 🧵 Enjoy


Python-Is there any package to create a forest plot? stackoverflow.com/questions/6519… #python3x #forestplot
how to order variables in plot_coeffs forestplot in R stackoverflow.com/questions/7180… #forestplot #r


How to adjust the width of the CI column in forestplot in R? stackoverflow.com/questions/7580… #forestplot #r

#ForestPlot #blobbogram, graph display of estimtd results of no of sci stud on same qstn, along with overall results
meta-analysis using metagen, overall argument not working stackoverflow.com/questions/6105… #forestplot #meta #randomeffects #r

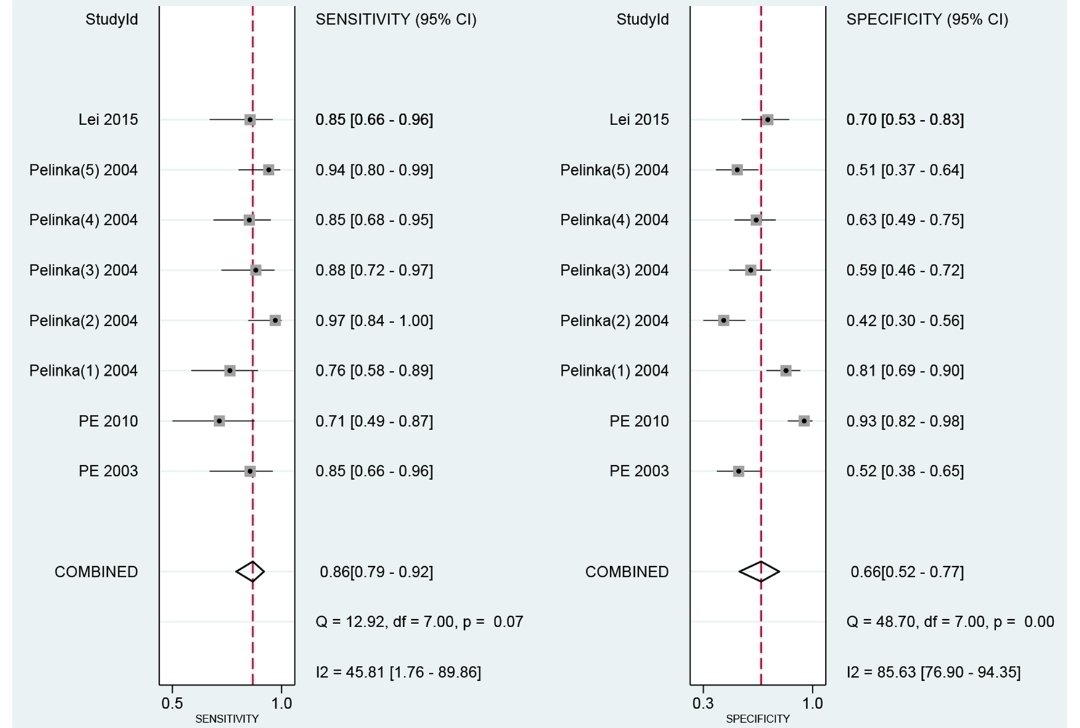
2/ Sensitivity/specificity were 0.86/0.66 for predicting mortality (see #ForestPlot) and 0.66/0.82 for assessing unfavorable outcome, with AUC being 0.82. Overall serum #GFAP seem to be able to function as a useful clinical #biomarker for #TBI.


I think his #forestplot or #blobogram means something, but what? @CochraneLibrary Holiday hotel maybe?


🌲PyMC3でベイズ推定を行った後、複数の変数の事後分布を視覚化したいときはforestplot関数が便利✨! combined=Trueに設定すると、全てのチェーンをまとめて表示🔄 事後分布を一目で把握できるので、解析の助けになります🧠💡! #PyMC3 #forestplot #combined #ベイズ推定


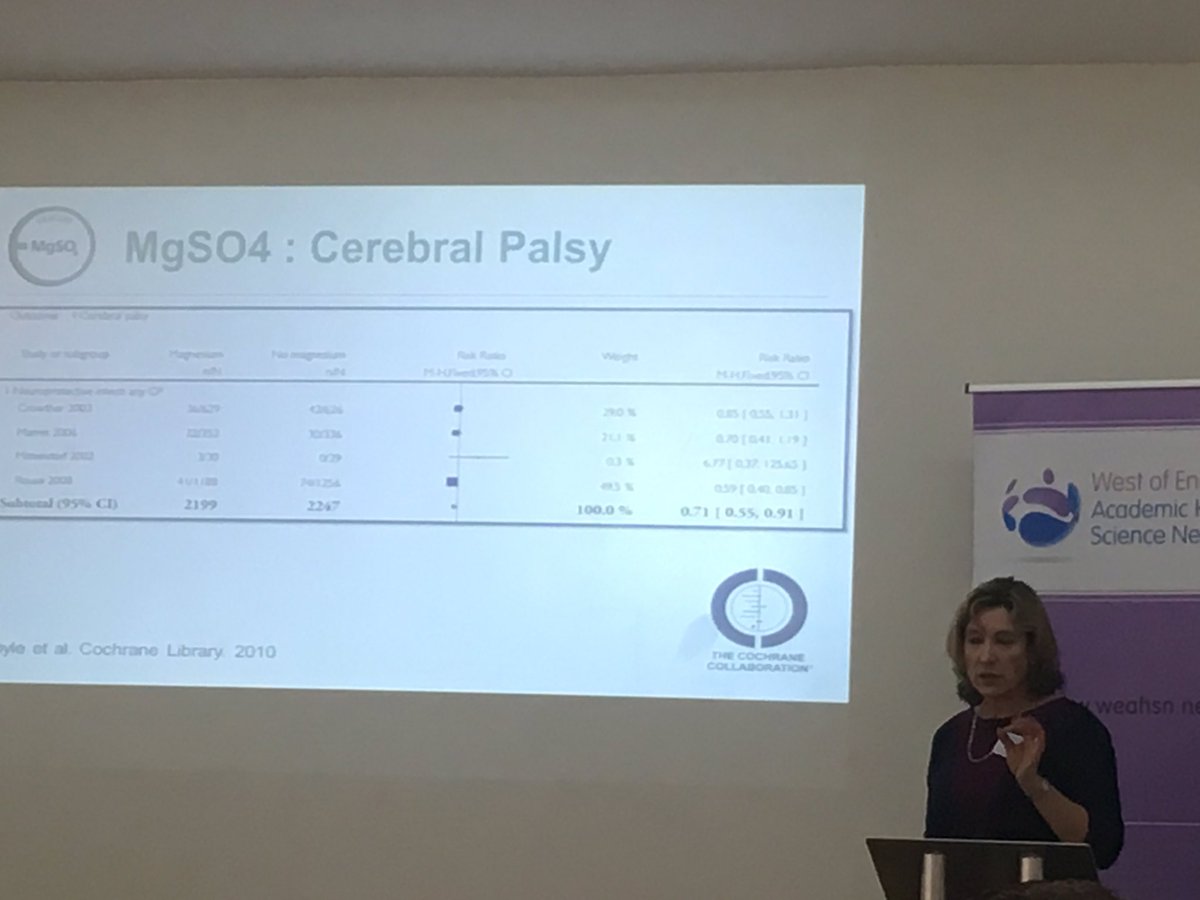
@EM_AHSN are getting ready for #PReCePT -Great example of #ForestPlot to show impact of MgSO4 @CochraneUK -Excited for the future

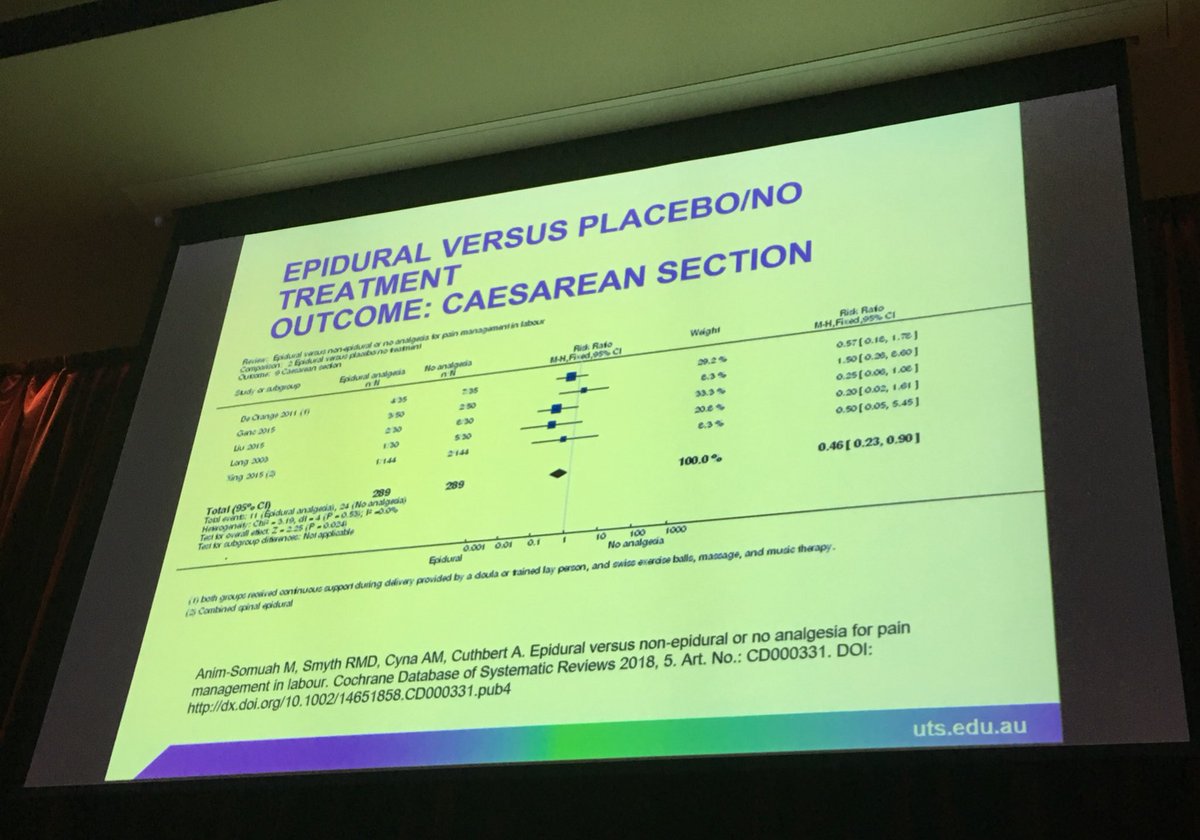
@debjfox #forestplot women are routinely counselled on the #safety of epidurals and the dangers of other pain relief modes such as #waterimmersion #dontdrownmother 🙄🌊 #OFNW2019


Když se při čtení statistické knihy od Martina Blanda dozvíte co viděl Luke Skywalker ve zpětném zrcadle 👍🏻😂 #StarWars #forestplot

Meta-Analiz okurken şekillere takılıp kalıyorum musun ? Forest-plot'ı öğrenciyken ben de ilk gördüğüm anlamamıştım. Benim anlamam biraz sürdü. Seninki sürmesin. medium.com/@samedakifvaro… #DijitalSağlık #MetaAnaliz #ForestPlot #MedicalResarch
medium.com
Meta-Analiz okurken şekillere takılıp kalıyor musun ?
Forest-plot’ı bir kez çöz. tüm sistematik derlemeler sana diz çöksün !

🧠 Reading a meta-analysis? Forest plots are KEY to understanding the results. 📊 This short video primer will help you decode them, step by step. 🎥 Watch here: youtu.be/JF8jpEi-_tE #ForestPlot #MetaAnalysis #EBM #MedTwitter #MedEd #StatTwitter #ResearchSimplified
youtube.com
YouTube
Forest plot Interpretation made easy

The size of the square shows how much weight each study carries. The wider the horizontal line, the less precise the study’s results. #forestplot @edusurg_clinics @ResidentsMed

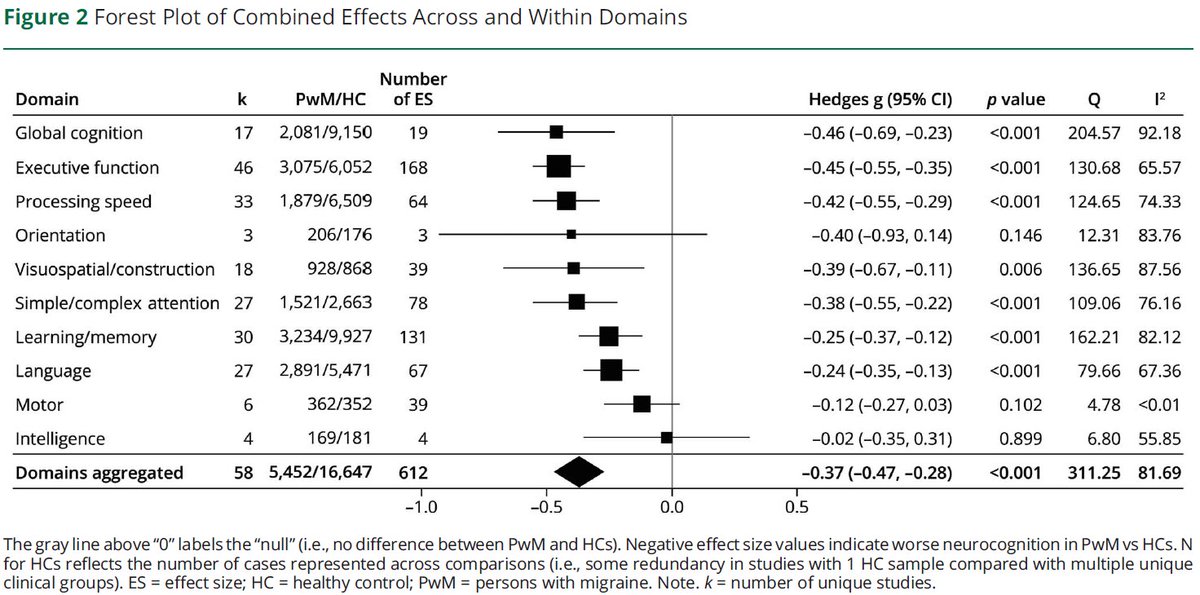
I'll cap off this #metaanalysis thread with a nice #forestplot for our #migraine study, showing overall- and within-#cognitive domain pooled effect estimates. Cheers! Shoutout to: Shout out to: @jasmin_pizer @neuronanako @vasilios_ikon for their great work! 5/5

Direct #Forestplot in #Network #MetaAnalysis 💻📊 youtu.be/TNpOXOwh9p8

Fun fact of the day: the #Cochrane logo represents a forest plot from an iconic #sytematicreview on antenatal corticosteroids in women at risk of preterm birth🤰. Wondering how to read a #forestplot? As usual, @Students4BE has got you covered: bit.ly/3C5fUlc

🌳📊🔍 Surprise! 🤯 Did you know that the Cochrane logo is an actual forest plot? ➡️Check out this short video that explains the symbolism behind it! 🤓👇
🌲PyMC3でベイズ推定を行った後、複数の変数の事後分布を視覚化したいときはforestplot関数が便利✨! combined=Trueに設定すると、全てのチェーンをまとめて表示🔄 事後分布を一目で把握できるので、解析の助けになります🧠💡! #PyMC3 #forestplot #combined #ベイズ推定
How to adjust the width of the CI column in forestplot in R? stackoverflow.com/questions/7580… #forestplot #r


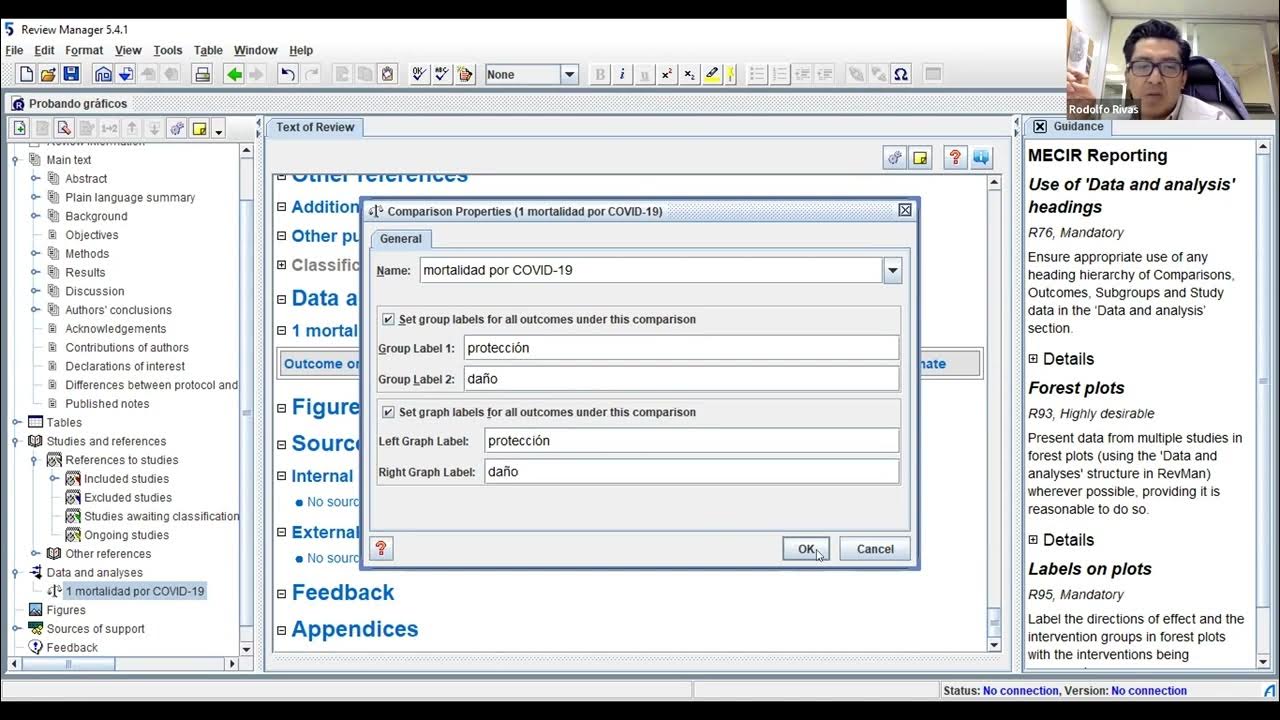
Punto para @mnmoises aquí te paso un video de como hacer un #forestplot en Revman 5 , el software de la #cochrane youtu.be/6-O-c6bk8VU
youtube.com
YouTube
Taller de pertinencia del gráfico: Forest plots

¿Cómo leer un metaanálisis? Los resultados de un metaanálisis se organizan a través de un gráfico llamado Forest Plot (diagrama de bosque) Un #ForestPlot se divide en seis columnas y los resultados individuales de cada estudio se disponen en filas sucesivas
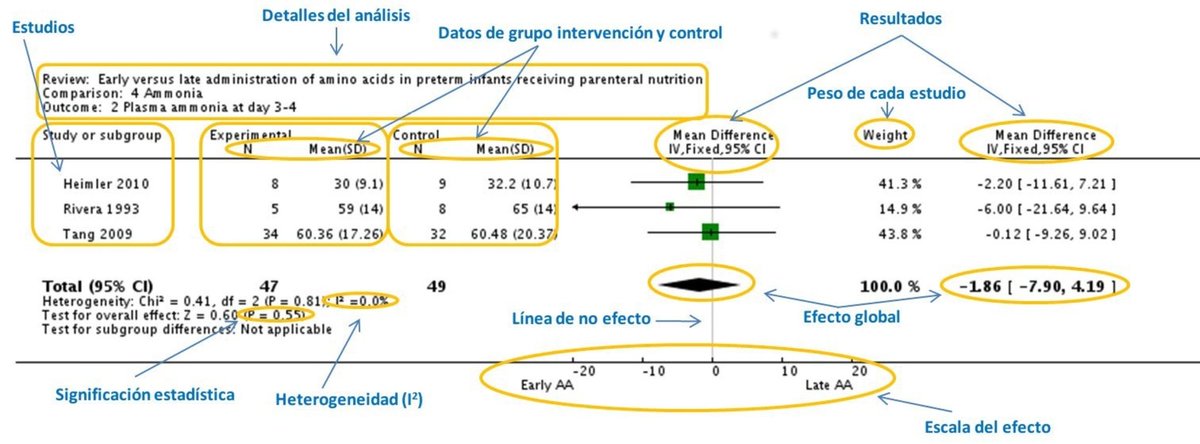

¿Cómo leer un metaanálisis? Los resultados de un metaanálisis se organizan a través de un gráfico llamado Forest Plot (diagrama de bosque) Generalmente, un Forest Plot se divide en seis columnas y los resultados individuales de cada estudio se disponen en filas sucesivas #hilo
2/ Sensitivity/specificity were 0.86/0.66 for predicting mortality (see #ForestPlot) and 0.66/0.82 for assessing unfavorable outcome, with AUC being 0.82. Overall serum #GFAP seem to be able to function as a useful clinical #biomarker for #TBI.
Python-Is there any package to create a forest plot? stackoverflow.com/questions/6519… #python3x #forestplot
how to order variables in plot_coeffs forestplot in R stackoverflow.com/questions/7180… #forestplot #r
¿Cómo leer un metaanálisis? Los resultados de un metaanálisis se organizan a través de un gráfico llamado Forest Plot (diagrama de bosque) Un #ForestPlot se divide en seis columnas y los resultados individuales de cada estudio se disponen en filas sucesivas #Hilo 🧵 Enjoy
🌲PyMC3でベイズ推定を行った後、複数の変数の事後分布を視覚化したいときはforestplot関数が便利✨! combined=Trueに設定すると、全てのチェーンをまとめて表示🔄 事後分布を一目で把握できるので、解析の助けになります🧠💡! #PyMC3 #forestplot #combined #ベイズ推定
#ForestPlot #blobbogram, graph display of estimtd results of no of sci stud on same qstn, along with overall results
I think his #forestplot or #blobogram means something, but what? @CochraneLibrary Holiday hotel maybe?
how to order variables in plot_coeffs forestplot in R stackoverflow.com/questions/7180… #forestplot #r
Python-Is there any package to create a forest plot? stackoverflow.com/questions/6519… #python3x #forestplot
How to adjust the width of the CI column in forestplot in R? stackoverflow.com/questions/7580… #forestplot #r
@EM_AHSN are getting ready for #PReCePT -Great example of #ForestPlot to show impact of MgSO4 @CochraneUK -Excited for the future
2/ Sensitivity/specificity were 0.86/0.66 for predicting mortality (see #ForestPlot) and 0.66/0.82 for assessing unfavorable outcome, with AUC being 0.82. Overall serum #GFAP seem to be able to function as a useful clinical #biomarker for #TBI.
meta-analysis using metagen, overall argument not working stackoverflow.com/questions/6105… #forestplot #meta #randomeffects #r
@debjfox #forestplot women are routinely counselled on the #safety of epidurals and the dangers of other pain relief modes such as #waterimmersion #dontdrownmother 🙄🌊 #OFNW2019

Need a #forestplot? #systematicreviews #evidencebased #medlibs #HEOR #healtheconomics ow.ly/IsZc30bOD0g

Science, music 🎶 and arts #ke_ecofor. Thank you for your support #forestplot, #htmf, #ECOFOR, #nerc, #fapesp

Když se při čtení statistické knihy od Martina Blanda dozvíte co viděl Luke Skywalker ve zpětném zrcadle 👍🏻😂 #StarWars #forestplot
Something went wrong.
Something went wrong.
United States Trends
- 1. Chauncey Billups 64.3K posts
- 2. Damon Jones 16.6K posts
- 3. Mafia 101K posts
- 4. #7_years_with_ATEEZ 61.2K posts
- 5. #FalloutDay 3,446 posts
- 6. #에이티즈_7주년_항해는_계속된다 48.1K posts
- 7. #A_TO_Z 47.6K posts
- 8. Kash Patel 40.1K posts
- 9. Tiago Splitter 1,341 posts
- 10. Changpeng Zhao 11.8K posts
- 11. The FBI 151K posts
- 12. 5sos 32.7K posts
- 13. Gilbert Arenas 6,103 posts
- 14. Gambling 131K posts
- 15. Toronto Rangers 2,647 posts
- 16. The NBA 200K posts
- 17. Kirby Air Riders 8,394 posts
- 18. Adam Silver 4,768 posts
- 19. La Cosa Nostra 6,523 posts
- 20. #UGGxOlandria 2,681 posts