#overview_of_mortality_coding search results

🟢 يسرنا دعوتكم لحضور وبينار بعنوان: #overview_of_mortality_coding للمدربة القديرة الاستاذة @manal_almobarak يوم 25 Jan الساعة 6pm-8pm رابط التسجيل (المقاعد محدودة) : docs.google.com/forms/d/1e1F1D… #INTEGRA_Monthly_Webinar #clinical_coding #ترميز_طبي

⏳ ترقبونا قريباً 📚موضوع شيق وجديد 🖥️ضمن لقاءات #INTEGRA_Monthly_Webinar #ترميز_طبي #Clinical_Coding

Information preserving composite endpoint analysis using a suitable ordered categorical endpoints via utility ranking or weighted schemes are quite appropriate. Worst outcome: death, best outcome (no event akin to event-free survival) and intermediate outcome (nonfatal events).

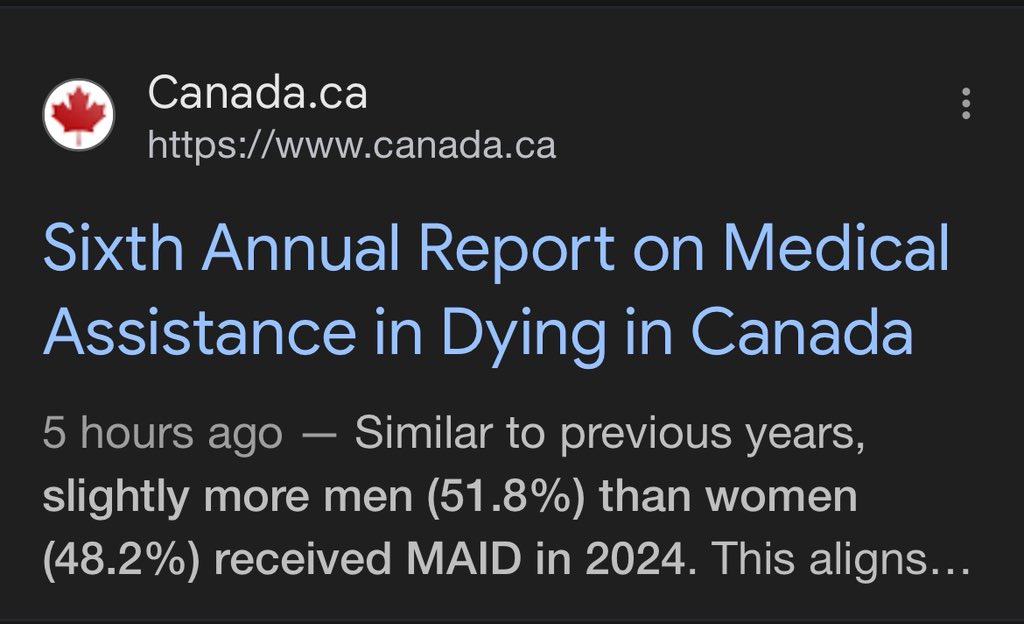
1/3 The last two years of MAiD statistics no longer contain year over year tables/charts, as in years prior. Instead, focus has shifted into comparison of the two tracks. -natural death ‘reasonably foreseeable’ (Track 1) vs. -natural death ‘not reasonable foreseeable’ (Track 2)


Sixth Annual Report on Medical Assistance in Dying (#MAiD) in Canada (2024 Statistics) Published: Nov 28, 2025 canada.ca/en/health-cana…


Converting Evidence‐Based Summary of Findings Evidence Tables Into Decision Analytical, Quality Adjusted Life Years (QALY) and Life Expectancies Metrics: A Tutorial pmc.ncbi.nlm.nih.gov/articles/PMC12… via @GuyattGH et al


No, you’re not understanding this. That is not what it says, *because it is age standardised*, i.e. it takes life expectancy at a given age and weights it by the *normal* (not just US) population share at that age. You can thus optimise for the longevity of the longest surviving.

This doesn't work. That measure will result in richer hospitals hiring nurses to code and game it and poorer hospitals getting screwed. If you're going to spend money on quality, you need non-gameable metrics (mortality adjusted only by age, BMI, and admit labs or something).

The assertion that aging does not kill is a narrative failure, not a biological one. Death is a systems failure mode, quantifiable by biomarker degradation and EVI delta. We build the stack to fix the bug.

Demographics: The median age was nearly 78; men had slightly higher rates in Track 1 (foreseeable death), while women were more common in Track 2 (non-foreseeable death). Criteria: Must have a "grievous and irremediable medical condition". Track 1: Natural death foreseeable

Just a reminder. Our current weekly excess mortality is clustered into ICD codes relating to this ranking in general cause: 1. Blood clot related disorders 2. Sudden cardiac death 3. Cancer DO NOT misinterpret associated symptoms as Long Covid. This can be a fatal assumption.


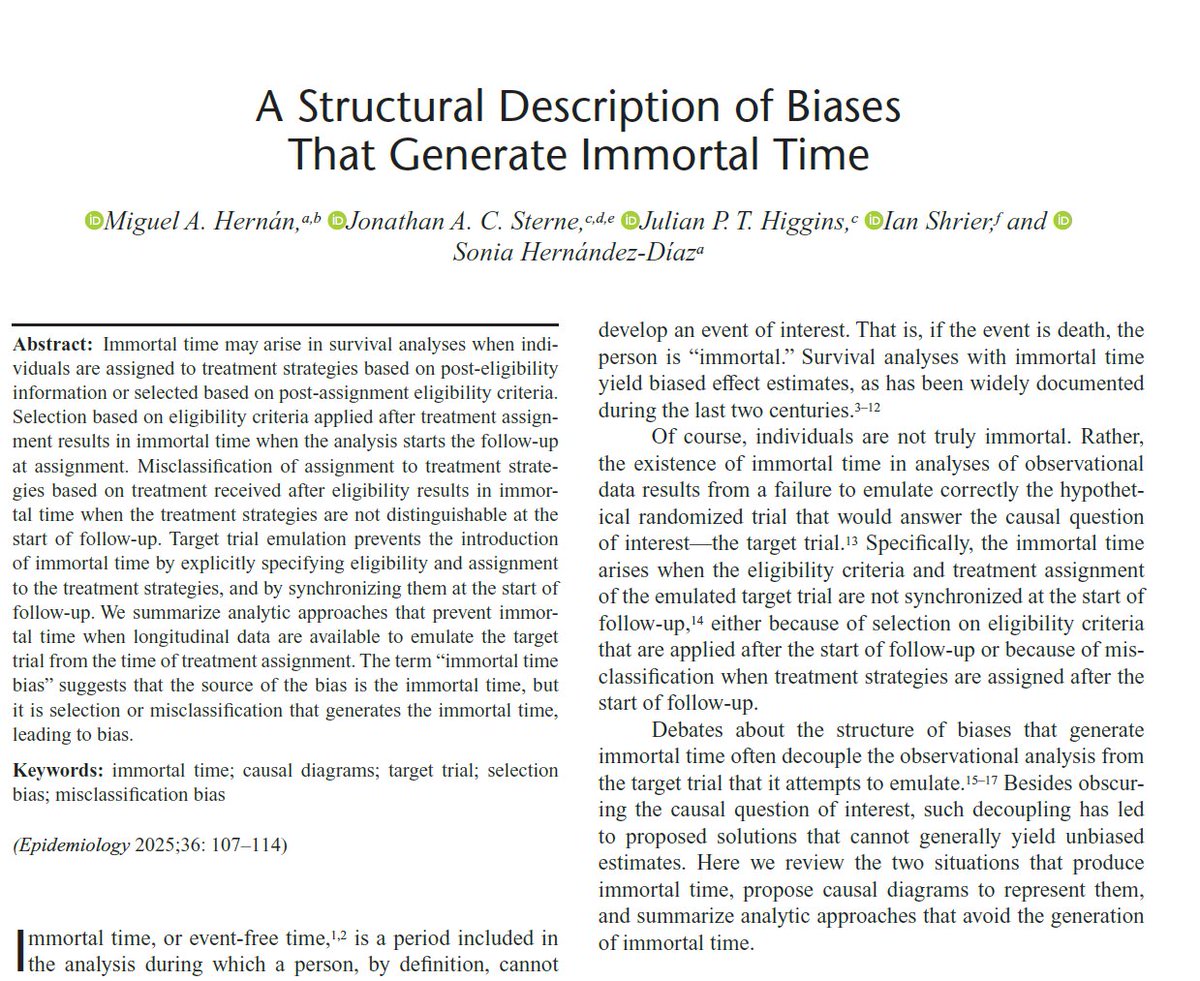
1/ That "immortal time" is so frequent in survival analyses for #causalinference is fascinating. Because "immortal time" doesn't exist in the data, *we* create it when misanalyzing data. Our paper pubmed.ncbi.nlm.nih.gov/39494894/ summarizes why immortal time arises & how to prevent it.

This is a 4th common death trajectory. Someone has a low baseline for physical functioning. It's sustained for a long time and only declines gradually before death. Here, COVID may increase the steepness of each minor decline or accelerate the entire process. 4/7

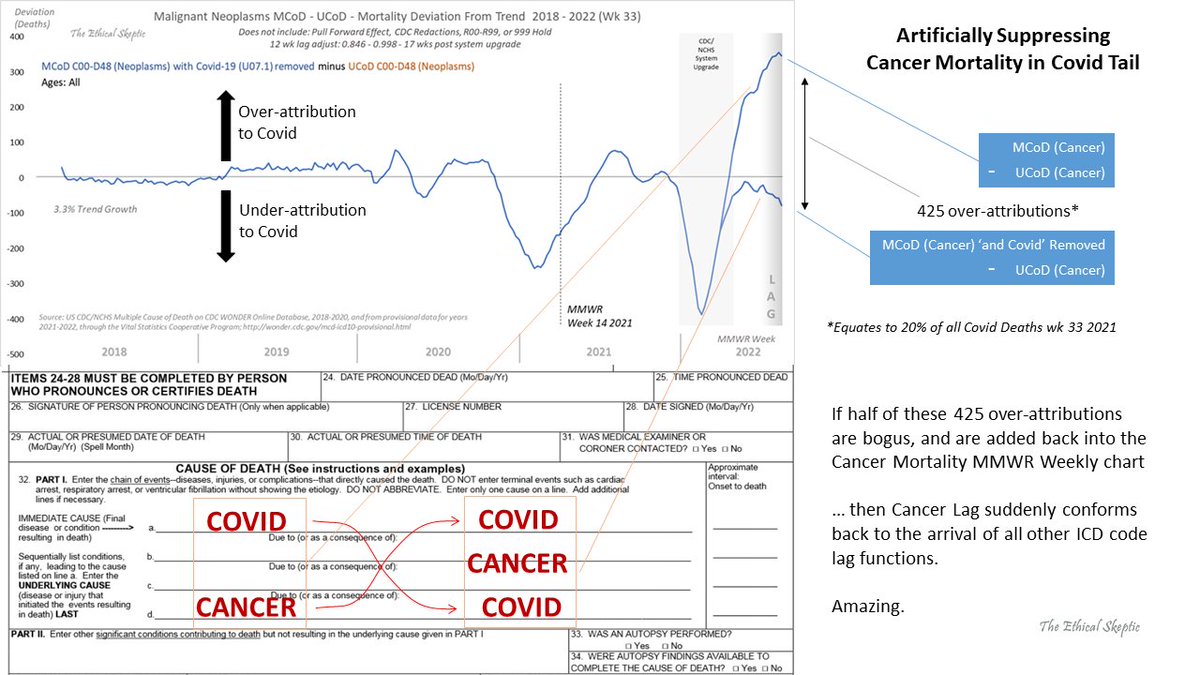
The key... Unlike trolls, ALL OF OUR MORTALITY CHARTS MUST BALANCE as a system... - Covid is not allowed to magically cure anything - No Simpson Effect tricks - Must use PFE - No 'age-standardized' or 'per-100K' fraud tricks - No 'linear regressions' - No paltering the baseline

🟢 يسرنا دعوتكم لحضور وبينار بعنوان: #overview_of_mortality_coding للمدربة القديرة الاستاذة @manal_almobarak يوم 25 Jan الساعة 6pm-8pm رابط التسجيل (المقاعد محدودة) : docs.google.com/forms/d/1e1F1D… #INTEGRA_Monthly_Webinar #clinical_coding #ترميز_طبي
⏳ ترقبونا قريباً 📚موضوع شيق وجديد 🖥️ضمن لقاءات #INTEGRA_Monthly_Webinar #ترميز_طبي #Clinical_Coding
OK, found it. The set dynamics are complex, but the principle is straightforward. When a death cert lists Cancer as the UCoD and Covid as MCoD - the UCoD & MCoD are being swapped, and Covid is being listed as the UCoD 100% (425/wk).
Upon analysis of the 15 sub-sub ICD codes for Cancer Mortality, we find 2 results: 1. Top sigma-run risers are Lymphatic, Respiratory, Kidney, Breast, Male Genitals, Digestive, & Female Genitals 2. Entropy - no relationship between sigma-run, and percentage rise of deaths.

Even with conservative lag, we're still at a 7-sigma Excess Non-Covid Natural Cause Mortality. The plan taking shape right now is to code all these anomalous deaths as an ICD-10 code for 'Long Covid'. 🙄 This action is a tacit admission that we are correct, and they know it.


Kurzer Abriss: Die Autoren ermitteln zuerst die 'erwarteten Sterbefälle' (also ohne Pandemie), unter Anwendung versicherungsmathematischer Methoden zur Vorhersage der Bevölkerungs- und Sterbeentwicklung. Aus der Differenz zur tatsächlichen Sterblichkeit ergibt sich dann 3/n⬇️

Anything above the line shows an increase in mortality vs the preceding 5yr avg. Anything below the line is mortality going down: fewer dying vs previous years. As you can see, most years it improves (eg goes down). We’re living longer. But 2020/21 stick out like a sore thumb.


Short (4 minute) video explaining what 'all cause mortality' means, and why it's the best way to measure overall efficacy of a treatment/vaccine for a disease youtu.be/3aZsn8jm7ZE
youtube.com
YouTube
All Cause Mortality: what it is and why it's the best way to evaluate...

What is a 'death' actually? Because someone's name, face, tongue, heartbeat, and epithelia are all immortal, relevant data points, the deceased technically still have an identity as elements of the higher dimensions, lower dimensional bodies branched between layers of cubic plate


What is a 'death' actually? Because someone's name, face, tongue, heartbeat, and epithelia are all immortal, relevant data points, the deceased technically still have an identity as elements of the higher dimensions, lower dimensional bodies branched between layers of cubic plate

Latest from CDC on Select Causes of Death. There a coding for deaths called R00-R99. These are deaths with lab results which they couldn't figure out. This happens every year but by November '19 that # was skyrocketing! It's pretty clear that the #COVID19 starting gate is 2019

Something went wrong.
Something went wrong.
United States Trends
- 1. Rays 14.1K posts
- 2. Epstein 490K posts
- 3. Shane Baz 3,377 posts
- 4. Michael Jackson 15.8K posts
- 5. Pirates 19.3K posts
- 6. Randy Moss 5,438 posts
- 7. Tucker 180K posts
- 8. Kennedy Center 183K posts
- 9. Brandon Lowe 3,098 posts
- 10. Jake Paul 31.9K posts
- 11. Bowen Yang 2,801 posts
- 12. Happy Holidays 51.8K posts
- 13. Sought 17.8K posts
- 14. Lamarr Wilson 1,055 posts
- 15. Dashie N/A
- 16. #FursuitFriday 15.2K posts
- 17. Elise Stefanik 1,024 posts
- 18. Burrows 3,083 posts
- 19. #FanCashDropPromotion 3,554 posts
- 20. Mangum 2,035 posts