
ConceptDraw
@CSO_ConceptDraw
Since 1993 ConceptDraw apps have been used worldwide for creating flowcharts, mindmaps, diagrams and projects http://www.conceptdraw.com/ 📊📈📉⏳
You might like


New Internet of Things Content is Available in ConceptDraw Solutions: conceptdraw.com/news/internet-… via @CSOdessa
conceptdraw.com
New Internet of Things Content is Available in ConceptDraw Solutions
Internet of Things solution for ConceptDraw DIAGRAM provides new vector libraries and sample drawings inspired by IoT technology.
Update ConceptDraw MINDMAP 14 and PROJECT 13 to the Latest Versions: conceptdraw.com/news/mindmap-p… via @CSOdessa
conceptdraw.com
Update ConceptDraw MINDMAP 14 and PROJECT 13 to the Latest Versions
Update ConceptDraw MINDMAP 14 and PROJECT 13 to the Latest Versions
ConceptDraw OFFICE v9 for macOS and Windows released: conceptdraw.com/news/office_9_… via @CSOdessa
conceptdraw.com
ConceptDraw OFFICE v9 for macOS and Windows released
CS Odessa Brings Business Diagramming to the Next Level with ConceptDraw OFFICE v9
Power Circuits solution for ConceptDraw DIAGRAM: conceptdraw.com/news/power-cir… via @CSOdessa
conceptdraw.com
Power Circuits solution for ConceptDraw DIAGRAM
The free Power Circuits solution for ConceptDraw DIAGRAM is designed to assist engineers, electricians, and other specialists when blueprinting the configuration of the power systems.
One-Line Diagrams solution for ConceptDraw DIAGRAM: conceptdraw.com/news/one-line-… via @CSOdessa
conceptdraw.com
One-Line Diagrams solution for ConceptDraw DIAGRAM
The free one-line diagrams solution for ConceptDraw DIAGRAM is designed to assist engineers, electricians, and other specialists when blueprinting the configuration of the electrical systems.
Valuable Addition to Engineering Area in ConceptDraw Solutions: conceptdraw.com/news/basic-cir… via @CSOdessa
conceptdraw.com
Valuable Addition to Engineering Area in ConceptDraw Solutions
The free solution for ConceptDraw DIAGRAM is designed to assist professionals who need to create various kinds of electrical circuit diagrams and their components.
CS Odessa Brings Business Diagramming to the Next Level with ConceptDraw OFFICE v8 CS Odessa Brings Business Diagramming to the Next Level with ConceptDraw OFFICE v8 conceptdraw.com/news/office_8_… via @CSOdessa
conceptdraw.com
ConceptDraw OFFICE v8 for macOS and Windows released
CS Odessa Brings Business Diagramming to the Next Level with ConceptDraw OFFICE v8
New Energy Industry Infographics Plugin Added to ConceptDraw Solutions: conceptdraw.com/news/energy-in… via @CSOdessa
conceptdraw.com
New Energy Industry Infographics Plugin Added to ConceptDraw Solutions
The latest supplement to the ConceptDraw Solutions Business Infographics Area is the Energy Industry content. Our new solution is designed to assist business professionals who need to visualize...

Example 10: Three-Dimensional Axis of Politics The visual organization in #political groups, organizations, and parties in accordance with certain conceptual axes is accepted in the political sphere.

Example 9: Separation of Powers This political infographic is dedicated to the separation of powers between authorities in France. The governance power is divided into three main branches — executive, legislative, and judicial. #ConceptDraw #PoliticsInfographics
Example 8: Public Sphere The use of ConceptDraw #clipart allows you to make this #diagram interesting and understandable, to reflect the unification of individuals with the same goal or problem that needs to be solved.

Example 7: Politics of Japan This sample illustrates the structure of the #political system in #Japan, which constitutes the multi-party bicameral parliamentary representative #democratic constitutional monarchy.

Example 6: Nolan Chart This sample presents the Nolan Chart in its traditional form. It is a chart designed by American libertarian activist David Nolan in 1969 that expands political view analysis and allows you to take a broad look at libertarianism.

Example 5: E-Government Dimensions This sample illustrates the dimensions of E-government that uses communication technologies and Internet to provide public services and information to the citizens of a certain country or region.

Example 4: Cleavages in Society The listed conflicts appeared as the result of modernization processes and revolutions that have taken place in the countries of Western Europe. #ConceptDraw

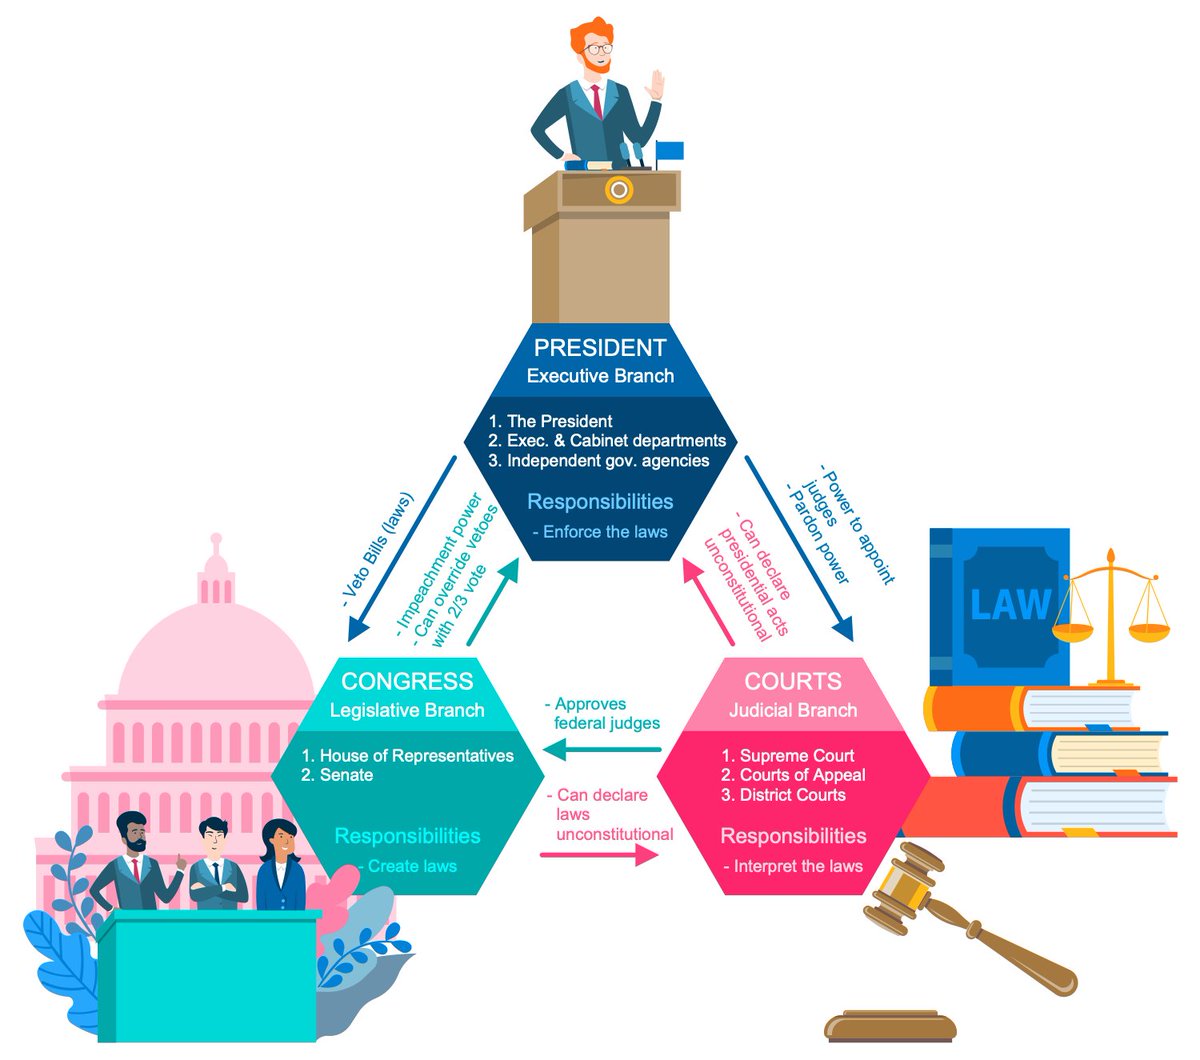
Example 3: Branches of US Government This sample depicts the branches of the federal government of the United States according to the U.S. Constitution. #government #ConceptDraw #DIAGRAM #Politics #Infographics

Example 2: Anacyclosis The diagram counts six components and is constructed in a form of a Circular Arrow diagram. #government #monarchy #aristocracy #democracy #ConceptDraw #PoliticsInfographicsSolution

Example 1: Two Party Preferred Counting Flowchart This sample depicts a preferred voting form in Australia. #ConceptDraw #politics #diagram

Business Process Framework eTOM created in ConceptDraw DIAGRAM using the combination of libraries from #EconomyInfographics Solution. An experienced user spent 10 minutes creating this sample. ow.ly/QodZ50AqCiW


United States Trends
- 1. $PUFF N/A
- 2. #FanCashDropPromotion N/A
- 3. Good Friday 47.4K posts
- 4. #FridayVibes 3,588 posts
- 5. $apdn $0.20 applied dna N/A
- 6. $SENS $0.70 Senseonics CGM N/A
- 7. $LMT $450.50 Lockheed F-35 N/A
- 8. Publix 1,331 posts
- 9. Happy Friyay 1,000 posts
- 10. #FridayFeeling 2,246 posts
- 11. #fridaymorning 1,408 posts
- 12. #PitchYaGame 1,073 posts
- 13. RED Friday 3,036 posts
- 14. Finally Friday 3,787 posts
- 15. Elise Stefanik 3,205 posts
- 16. John Wayne 1,401 posts
- 17. yeonjun 307K posts
- 18. Sydney Sweeney 106K posts
- 19. Kehlani 14.7K posts
- 20. Out The Window 11.3K posts


Something went wrong.
Something went wrong.