
ExcelDemy
@ExcelDemy
Microsoft Excel • Excel VBA & Macros • Pivot Table • Power BI • Excel Training
You might like


In this tutorial, we show five ways to conduct hypothesis testing in Excel using built-in formulas and the Data Analysis ToolPak. f.mtr.cool/qhdwonhahr
This tutorial shows how to turn Excel into a Kanban board for agile project tracking. f.mtr.cool/hqwxqluxno
In this tutorial, we’ll explore why it’s actually easier to build complex filters in Power BI than in Excel. f.mtr.cool/thgscljxmc

In this tutorial, you’ll learn three ways to use Flash Fill and Text to Columns like a pro. f.mtr.cool/tumslpbxsx
In this tutorial, we’ll show how to build a Power BI report and let users explore in Excel. f.mtr.cool/bwskcjrfzq
In this tutorial, we show 7 Power Query tricks to automate your data cleaning forever. f.mtr.cool/lzvirxqbtp
In this tutorial, we discuss when to start in Excel vs. when to start in Power BI by building a hybrid report. f.mtr.cool/phprcboinz
In Excel, you can build regression models easily without any complex coding. In this tutorial, we will show 7 steps to building a regression model in Excel. f.mtr.cool/mqztvbfvqj

In this tutorial, we will show 5 ways to make Power BI reports load faster. These techniques can dramatically improve any Power BI report’s performance. f.mtr.cool/kgxyvmgsin

In this tutorial, we will show how to connect Excel to your Power BI datasets where Power BI meets PivotTables. f.mtr.cool/jjysmqihfh
In this tutorial, we'll learn 3 data validation techniques for building error-proof spreadsheets. f.mtr.cool/mfvpaqzegp

In this tutorial, we will explore probability distributions in Excel. f.mtr.cool/oppvuailca

In this tutorial, we will show seven statistical tools you might not know are in Excel and how to use them. f.mtr.cool/atplusndry
In this article, we discuss seven must-try Excel add-ins for the creative data enthusiast. f.mtr.cool/dccppqmhwy

In this tutorial, we show how to use Power BI DAX measures to enhance Excel reports. f.mtr.cool/rzlrgaypdl
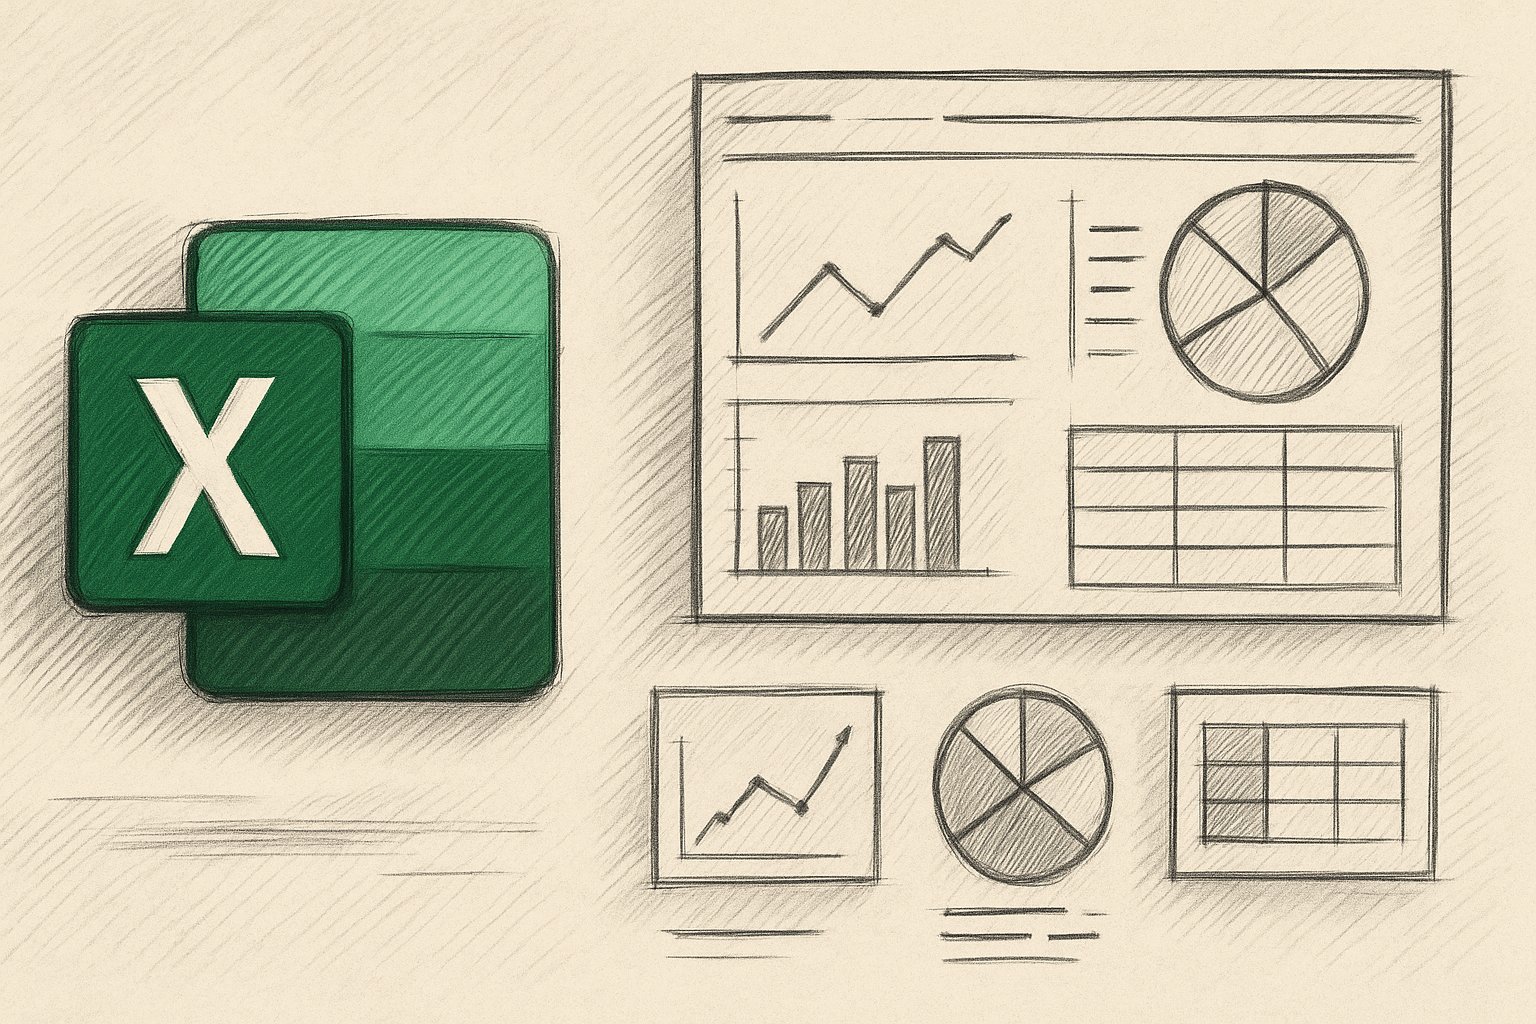
In this tutorial, we show 7 ways to make Excel dashboards that don’t look like Excel dashboards — dashboards that feel like apps or professional BI tools, all inside Excel. f.mtr.cool/xdzwdrmxxx
In this tutorial, we will show when to use Excel and when to use Power BI, and how to combine them effectively. f.mtr.cool/zbenlrwrhx
In this article, we will show how to rotate cell content indicators based on formula output using custom fonts or symbols. f.mtr.cool/qubijweswf
In this tutorial, we show how to automate Excel file refreshes based on Power BI data updates. f.mtr.cool/futdykcspd

Excel’s VLOOKUP function has been a go-to for many Excel users. But it comes with significant limitations: it can’t look left, it breaks when columns are moved, and it only returns the first match. Excel has several p... f.mtr.cool/tyaowvzikk


United States Trends
- 1. Black Friday 446K posts
- 2. Nebraska 10.1K posts
- 3. Iowa 11.8K posts
- 4. Jalon Daniels N/A
- 5. Rhule 1,884 posts
- 6. Black Ops 7 Blueprint 8,820 posts
- 7. Go Birds 11K posts
- 8. Sumrall 2,956 posts
- 9. Lane Kiffin 7,547 posts
- 10. Egg Bowl 7,163 posts
- 11. #Huskers 1,127 posts
- 12. Kamario Taylor N/A
- 13. Mississippi State 4,710 posts
- 14. #kufball N/A
- 15. UConn 5,267 posts
- 16. Sydney Brown N/A
- 17. Black Ops 7 XP 6,412 posts
- 18. Kansas 16K posts
- 19. Swift 54K posts
- 20. Stribling N/A


Something went wrong.
Something went wrong.