
Gitonga Cosmas
@GitongaCosmas
Agnostic; Avid reader; Bibliophile; Researcher; Technologist; Technical Writer; Lover of Humanity. #Dataism
You might like


I am deeply honoured by the Jubilee Party National Executive Committee’s unanimous acceptance of my formal application to be the Party’s presidential nominee. I am profoundly grateful for the opportunity to serve as Deputy Party Leader, and I graciously accept the Party’s…


Calculus is a powerful tool for understanding change, motion, and growth - and it's good to know as a dev. In this new College Calculus course, Ed teaches you the key concepts through the lens of Python. You'll learn about limits, derivative rules, slope interpretation, various…


AI tool to convert PDFs and images into clean, readable text while preserving natural reading order. 100% Opensource.


If you’re serious about understanding AI models - not just running them - mastering the math is non-negotiable. This book gives you that mastery: it builds the mental model of how learning actually happens - from vector spaces and eigenvalues to gradients, loss landscapes, and…


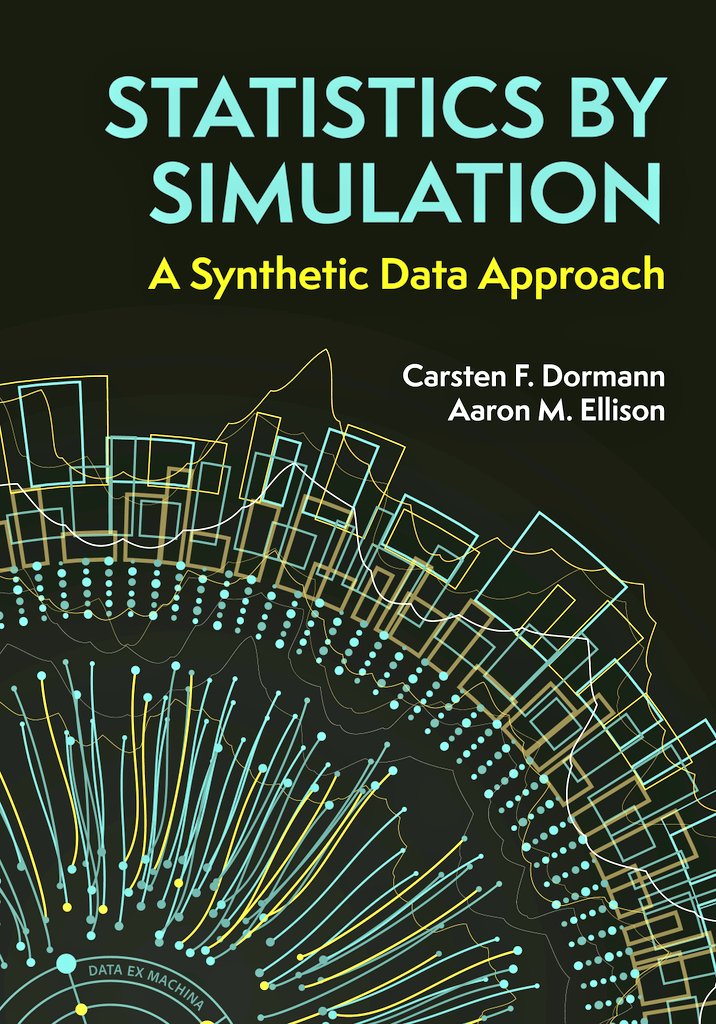
Statistics by simulation, or Monte Carlo methods, uses computational power to solve problems that are too hard for traditional math. Instead of solving complex equations, we program a computer to mimic a random process (like rolling dice or modeling stock prices) millions of…

Here are 7 Top playlists for Data Engineers 1. Python for Data Engineers - lnkd.in/gwsTQRgR 2. SQL - lnkd.in/gdnhRk8b 3. SQL Advanced - lnkd.in/g8tyEKbU 4. SQL Leetcode - lnkd.in/gKeSMPmW 5. Git & Git Hub for Data Engineers -…


Master Data Visualisation with Python Pandas. Get for free in the thread:

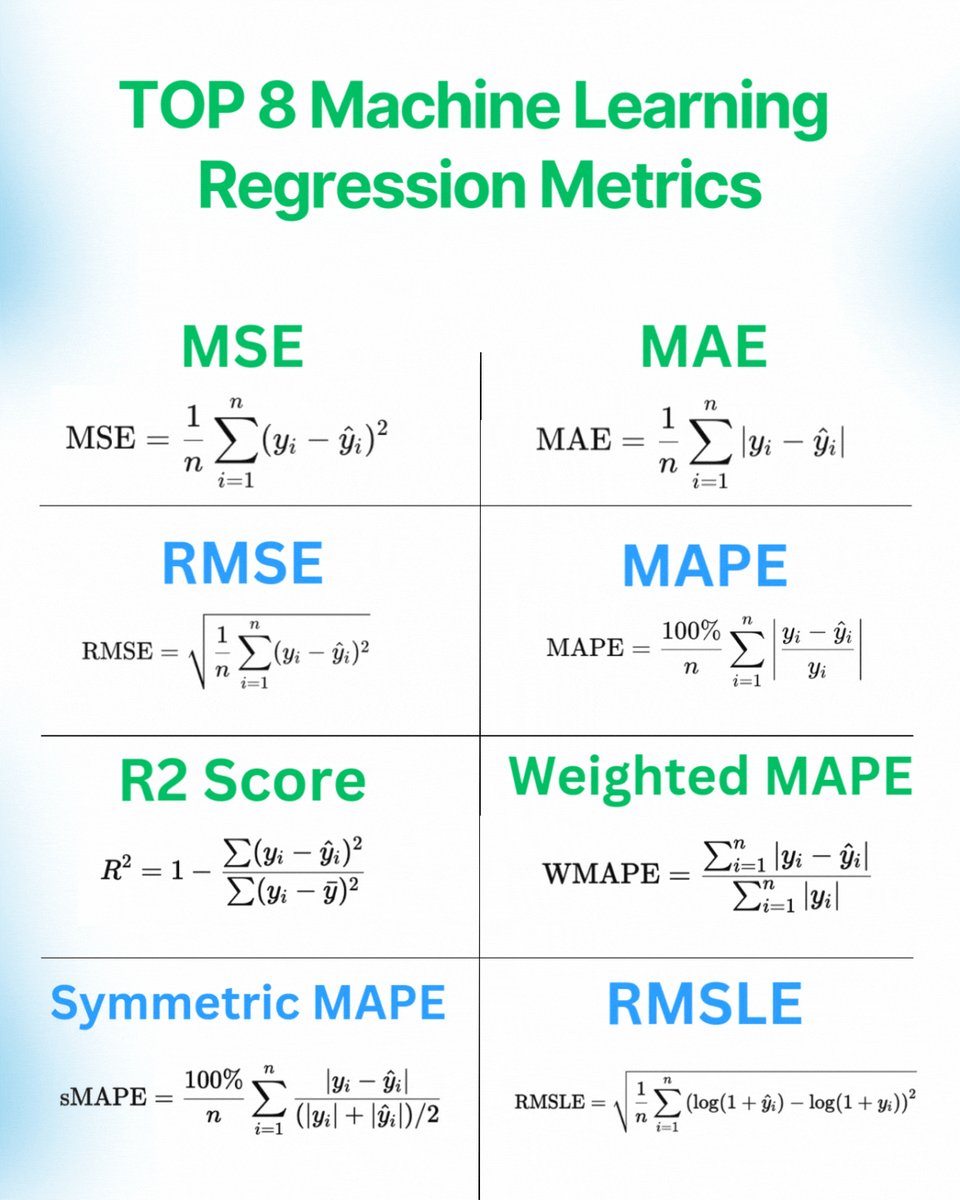
Use MAE for average error, MSE to penalize large errors, RMSE for error in original units, MAPE for % errors, R² for model fit, Weighted MAPE when errors matter unequally, and RMSLE when penalizing under-predictions less.

- MSE you use when you don’t have outliers - RMSE you use when you want to interpret the above better - MAE you use when you have positive/zero/negative values and outliers - MAPE you use when you only have positive values and emphasize interpretability - RMSLE you use for…


Matplotlib is a Python library that is used to create static, animated, and interactive visualizations in Python. pyoflife.com/data-visualiza… #DataScience #Pythonprogramming #datavisualizations #machinelearning #DataScientist #ArtificialIntelligence

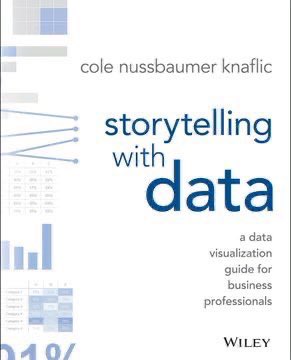
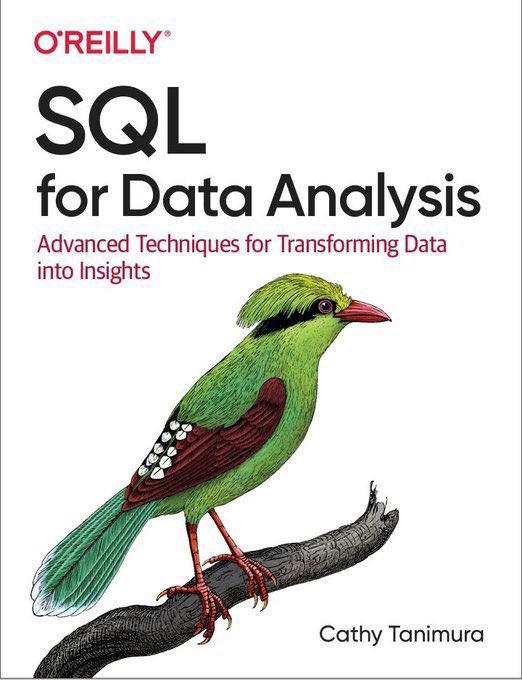
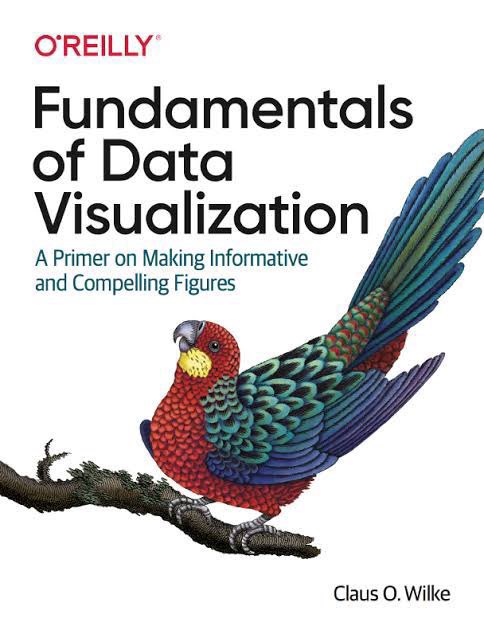
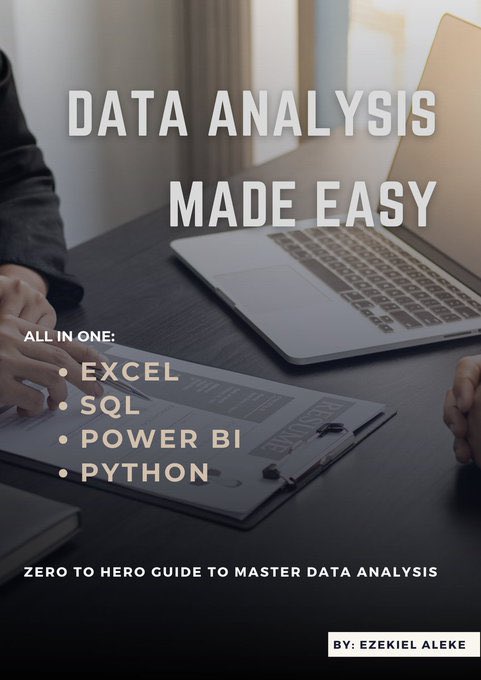
Dear Data Analyst/Scientist. Read these books and you'll be miles ahead in your Data journey. To get it: 1. Follow me (so I can DM you) 2. Like and retweet 3. Reply with "Data"

If you want to learn Python for data analysis prioritise: - NumPy (maths) - Pandas/Polars (data wrangling) - Matplotlib (Data visualisation) - Seaborn (built on top of matplotlib, has higher level interface capabilities) - OS (Operating System Interaction for working with files…

KRA has announced that employees will pay 8% tax on fringe benefits and interest from October to December 2025. Here’s what it means:

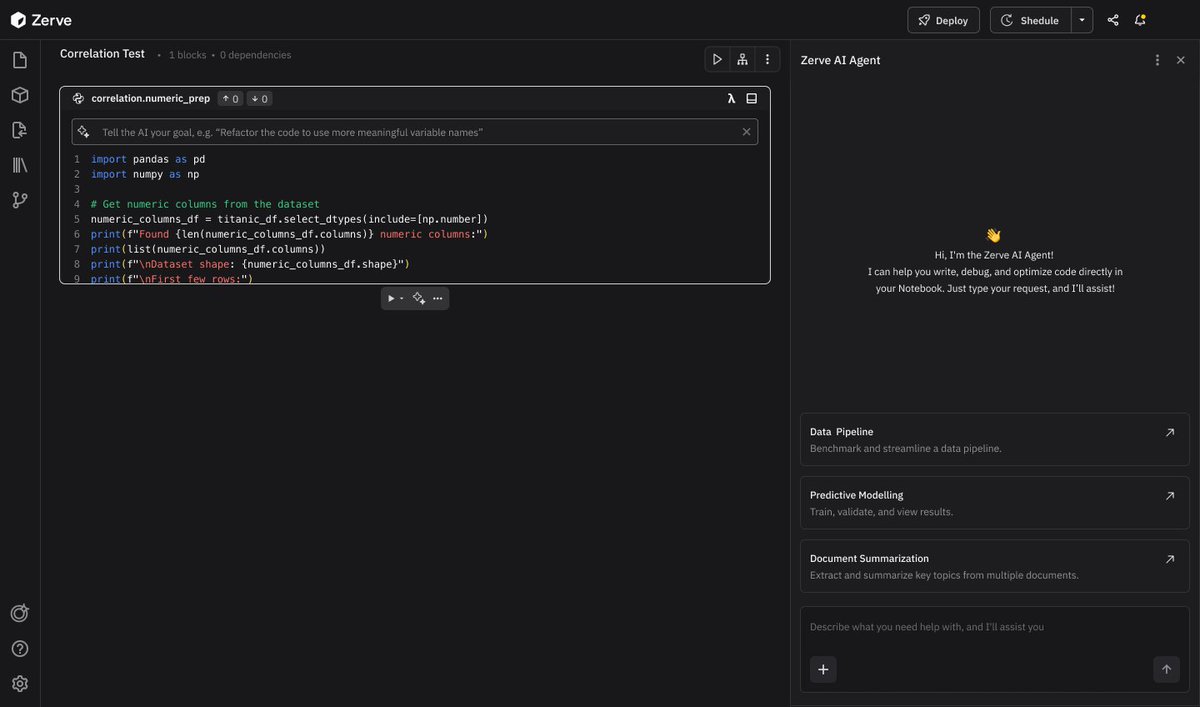
Jupyter notebooks are outdated. They just can't compete with modern notebooks that offer much more functionality, including AI. I've been using Zerve, and they fix everything that's wrong with notebooks. This is a notebook with a completely different philosophy and…

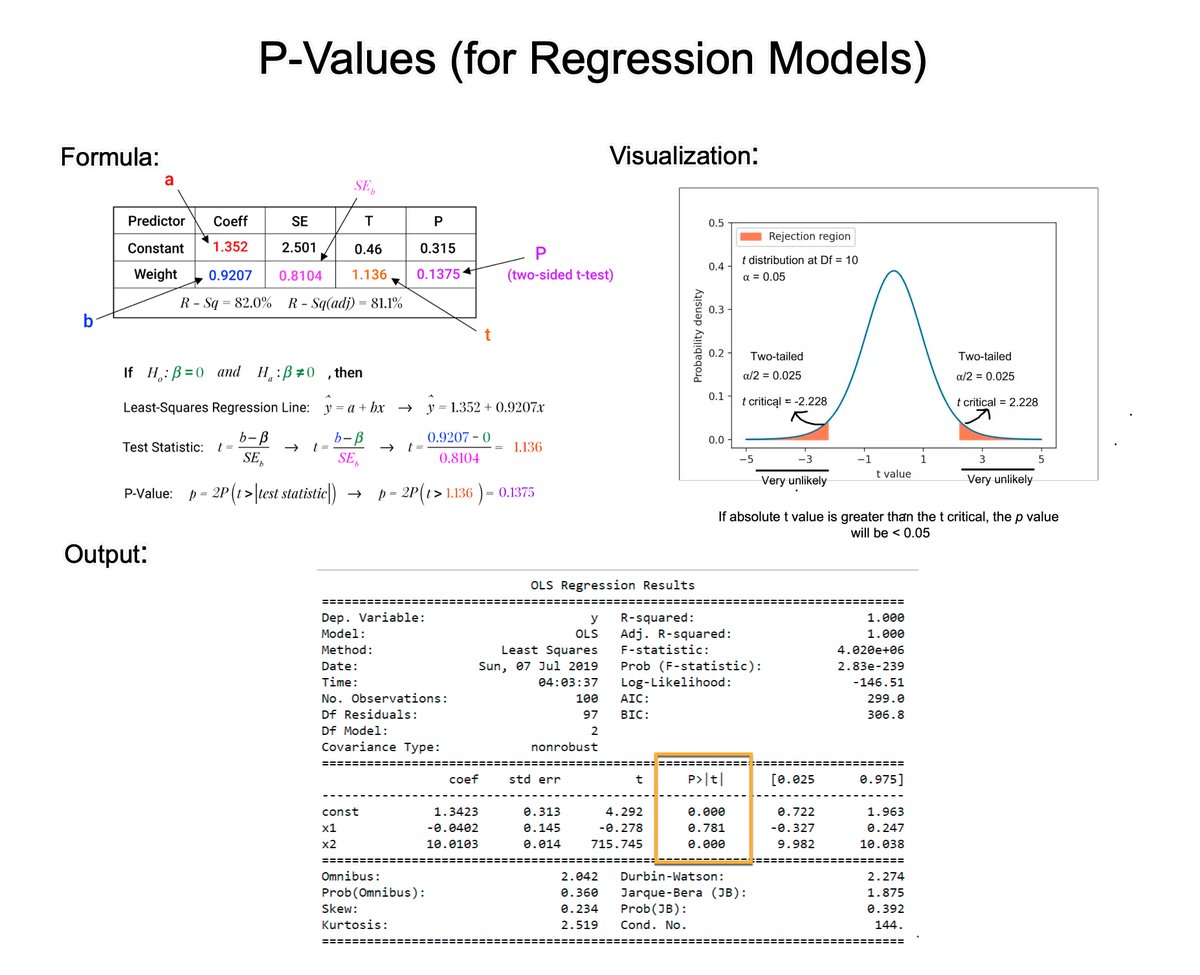
Understanding P-Values is essential for improving regression models. In 2 minutes, I'll crush your confusion.
This is still the way I recommend most people start with machine learning: 1. Start with Python 2. Learn to use Google Colab 3. Take a Pandas tutorial 4. Then a Seaborn tutorial 5. Learn how to use Decision Trees 6. Finish Kaggle's "Intro to Machine Learning" 7. Solve the…

Math you ACTUALLY need for ML (and when): Linear Algebra (Week 1-2): Vectors, matrices, matrix multiplication Use when: You're understanding data transformations, neural networks Calculus (Week 3-4): Derivatives, gradients, chain rule Use when: You're understanding…


Python Developer: From Basics to Case Studies Specialization. Python Fundamentals & Core Concepts ├── Python Basics │ ├── Syntax & Data Types │ ├── Variables & Operators │ ├── Control Structures │ └── Functions & Scope ├── Data Structures │…


United States Trends
- 1. Colts 38.5K posts
- 2. Jets 57.1K posts
- 3. Sauce 61.6K posts
- 4. Cheney 177K posts
- 5. AD Mitchell 4,460 posts
- 6. Shaheed 12.3K posts
- 7. Garrett Wilson 1,230 posts
- 8. Election Day 153K posts
- 9. Ballard 3,307 posts
- 10. Joe Tryon 1,414 posts
- 11. Daniel Jones 3,161 posts
- 12. #ForTheShoe 1,169 posts
- 13. Meyers 14.4K posts
- 14. Quinnen Williams 2,285 posts
- 15. Seahawks 20.5K posts
- 16. Ryan Poles 1,077 posts
- 17. Jamal Adams N/A
- 18. Waddle 7,457 posts
- 19. Two 1st 4,275 posts
- 20. #JetUp N/A
You might like
-
 Teddy Obonyo
@ObonyoTeddy -
 gichaba
@M_Vane63 -
 Simon Mwangi
@SapBerried -
 Mu Kami 🇰🇪
@mu_kami_ -
 Njoki Waigwa
@njokiwaigwa -
 Anne Wanyeki
@WanyekiAnne -
 Camilla Dhahabu
@CamillaDhahabu -
 Norwich Union Properties. Ltd
@norwichunion1 -
 That girl
@fayee_n -
 Emmanuel Mwangi
@mwangiemmanuel -
 Tony Mambo
@tony_mambo -
 Radical Lefty
@tobbyosore -
 Mwiti
Mwiti
@mwiti_b
Something went wrong.
Something went wrong.