
Anthony Hammond
@HydroStats
BHS member, #Rstats, #QGIS, JBA employee (account not affiliated); flood hydrology and associated statistical methods. Check out the website
You might like


My new years resolution done😊🍾. I've created an R package which is now on CRAN. It's called UKFE and has functions to implement the FEH methods, as well as numerous other functions useful to hydrologists. Here is a quick guide for the FEH functions: floodhydrostats.com/ukfe-package-f…
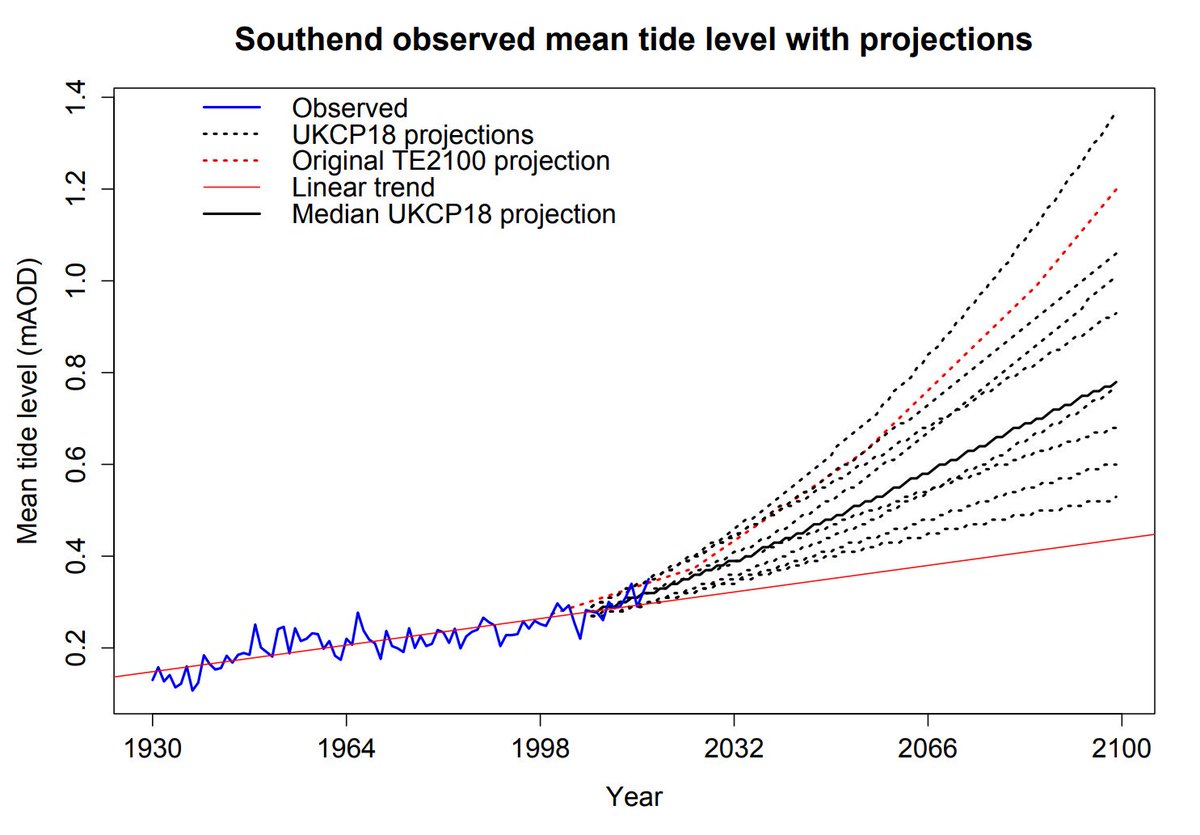
The observed annual mean tide levels at Southend (Thames Estuary 1930 - 2017) with various projections of sea level rise.
It's all statistics 😁: Machine learning = automated statistical modeling Artificial intelligence = automated decisions as a function of machine learning.
Why does everyone talk about the issue of p values? Surely it's the alpha levels that are an issue. Get rid of alpha levels & allow the reader to determine whether they think the p value is significant. Problem solved.

Great news that Brad Efron has won the 2019 International Statistics Prize for the 1977 bootstrap idea - so simple and yet so powerful statslife.org.uk/news/3982-2018…


Looking forward to the @britishhydrosoc national symposium today & tomorrow. Lots of hydro heroes on the agenda with a host of interesting presentations.

Hydrology is at the heart of flood risk & catchment management (I’m one!). We’re supporting a new bursary towards the costs of MSc studies in the field - spread the word - you have until 16th July to apply! bhs-studentships.jbatrust.org
DYK that between 01/01/1883 and 30/08/2016 just over 277 billion cubic metres of water have been discharged across Teddington weir on the Thames.
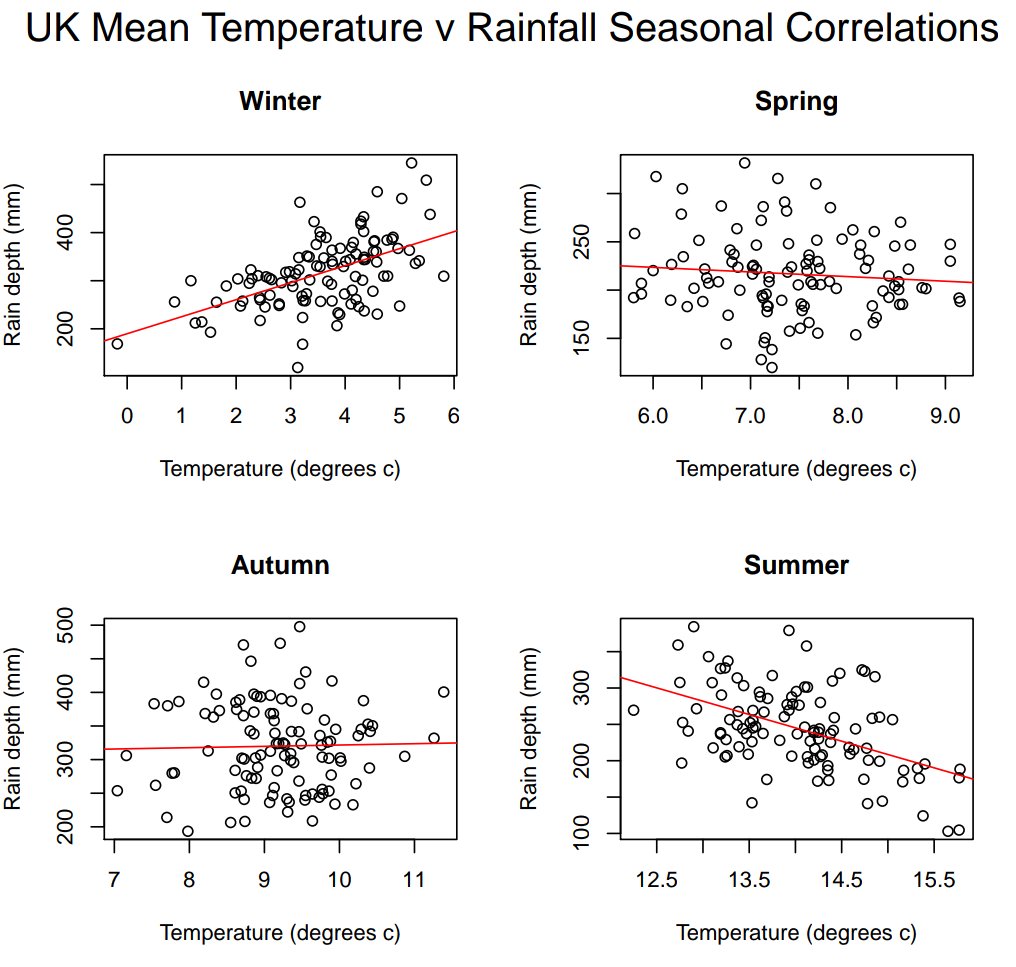
I did some seasonal temperature v rainfall plots. Met office data from 1910-2017. 😀
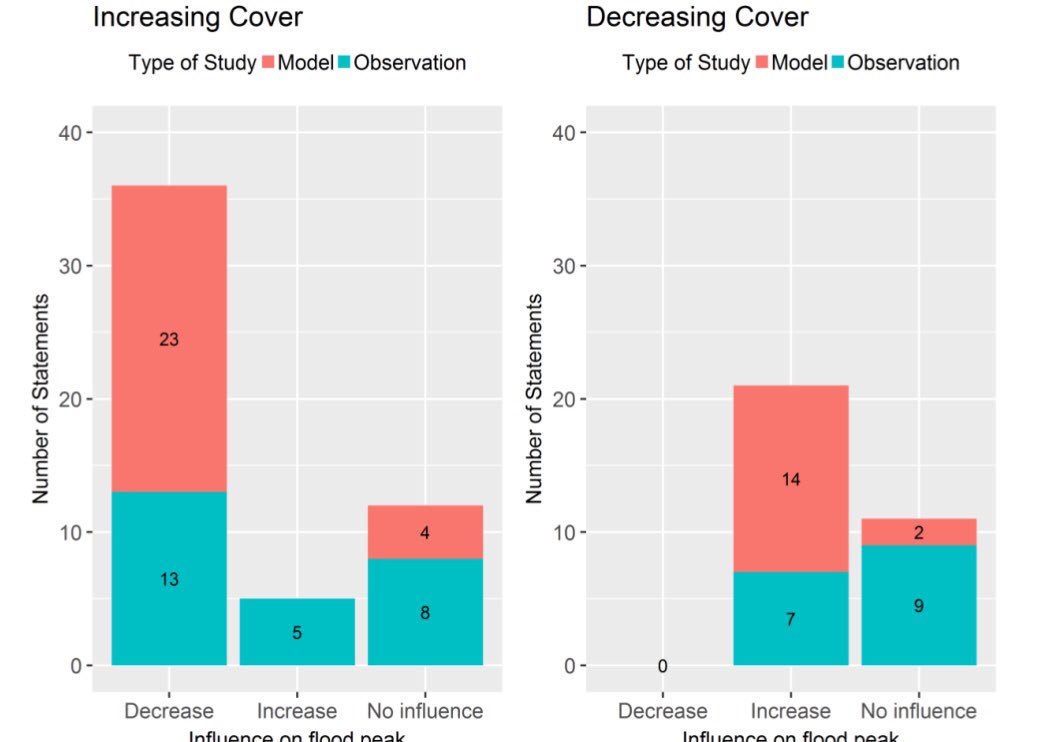
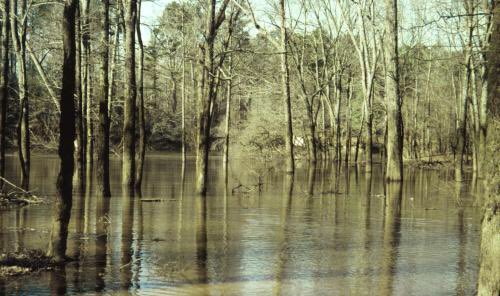
The role woodlands can play in reducing flood risk has had a lot of air time recently - get beneath the headlines by revisiting @CEHScienceNews comprehensive global evidence review if you want to know more nora.nerc.ac.uk/id/eprint/5178… #floodaware


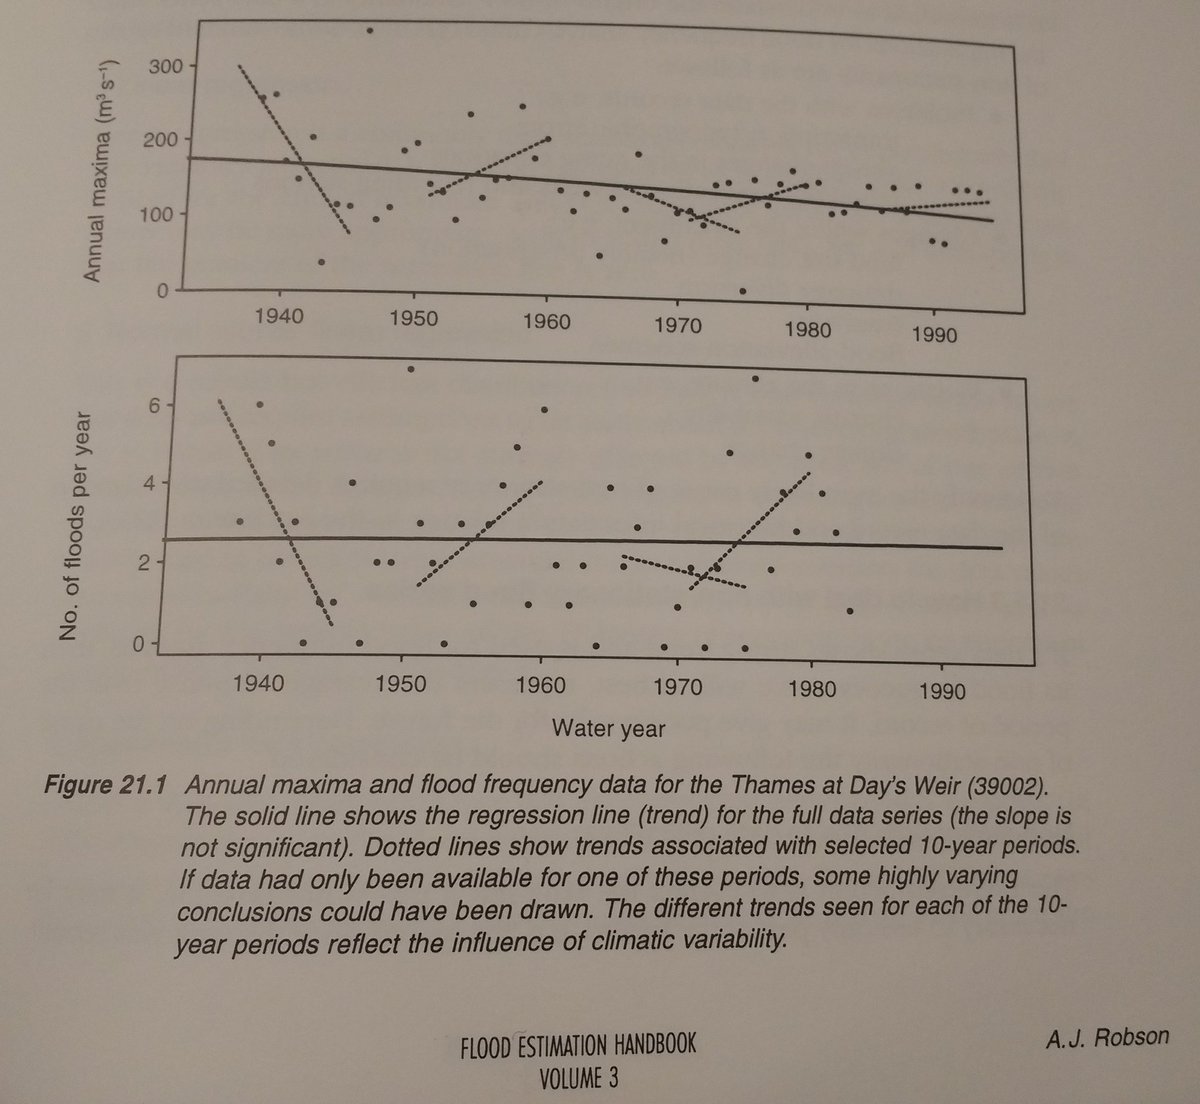
A nice concise illustration of the pitfalls of flow trend analysis. From FEH volume 3.

Recent @EnvAgency tweets rightly laud engineers, contractors & communities where #flood schemes built, but praise also due to modellers/hydrologists etc whose expertise demonstrates where/how to target £ best #unsungheroes

Want to see 168 years of climate change in two minutes? Here is our movie, updated through 2017.
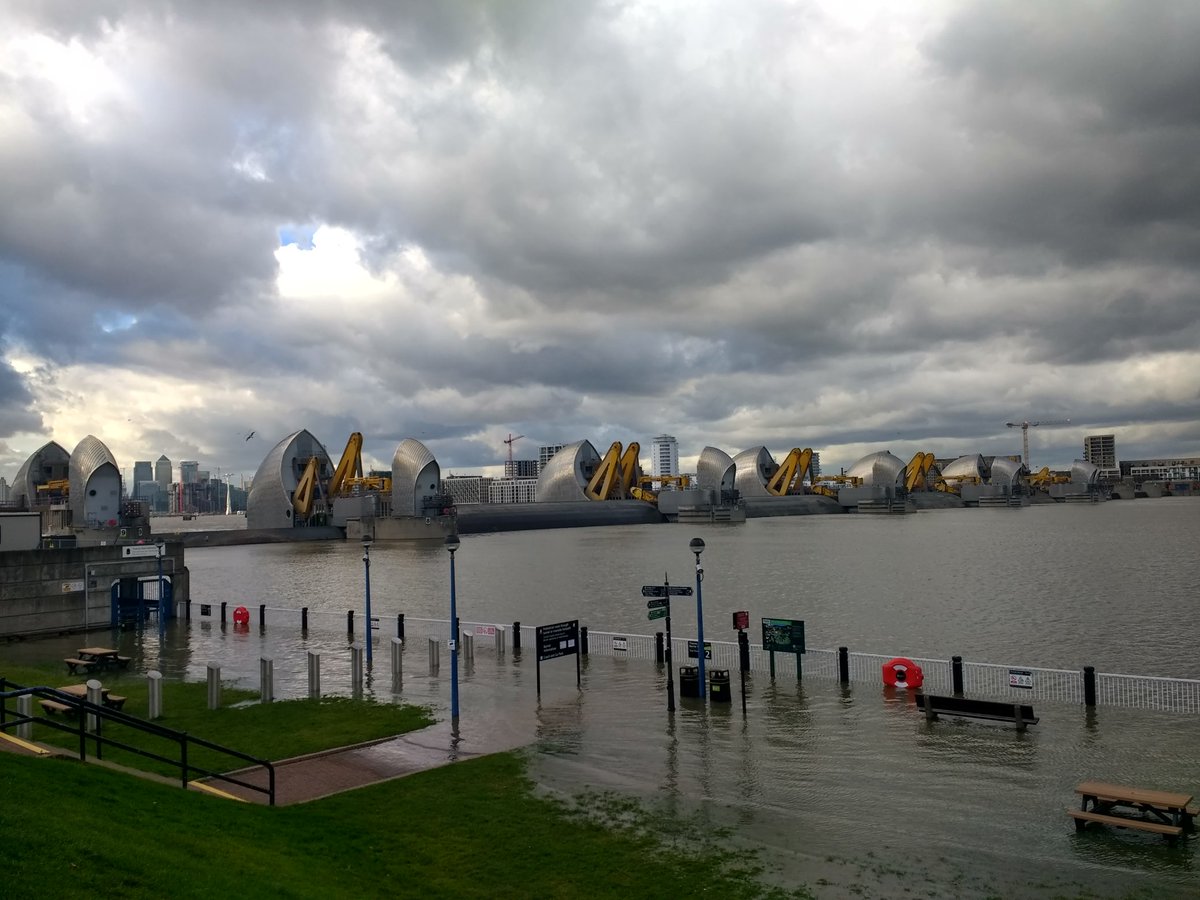
Currently, at the Thames barrier; a closure blocked the incoming tide
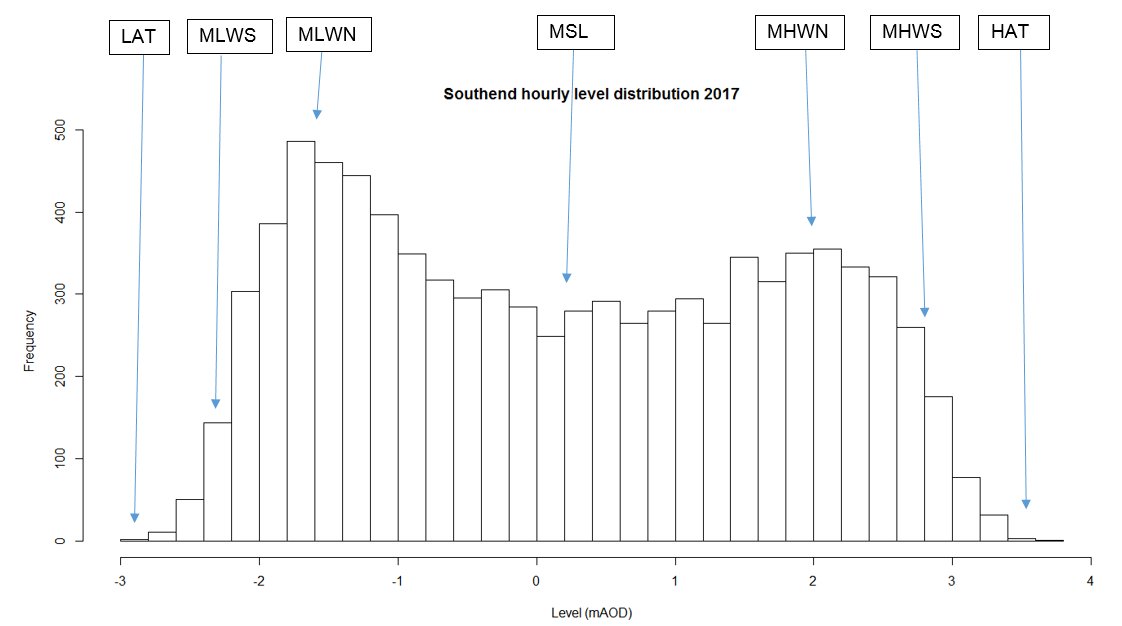
Another fun plot; for sea level this time. The Southend hourly tide level distribution for 2017, with 'official' sea level statistics.
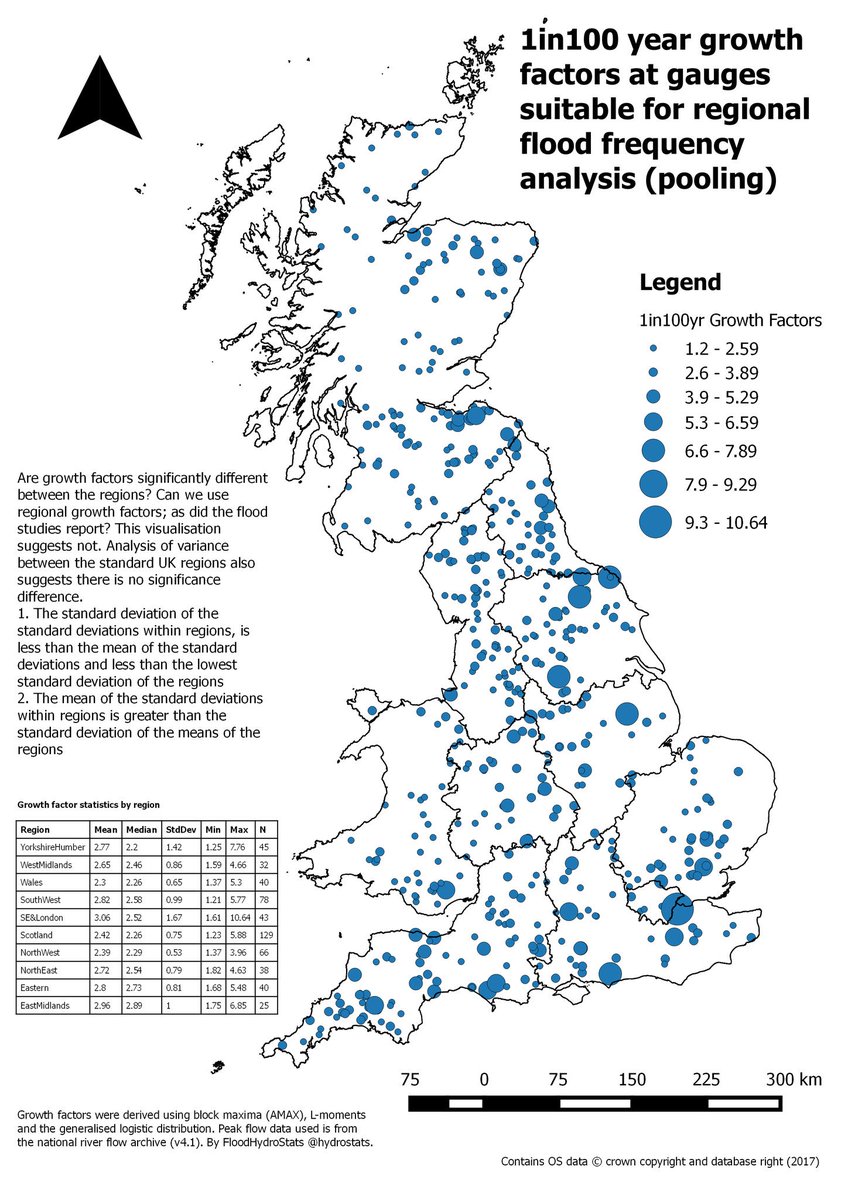
Do flood growth factors have strong spatial/regional correlation? If so, can we use it for UK flood estimation. This map, associated blurb and statistics suggests not.


United States Trends
- 1. 49ers 62,9 B posts
- 2. 49ers 62,9 B posts
- 3. Niners 15,5 B posts
- 4. Brock Purdy 18,8 B posts
- 5. Caleb 78,3 B posts
- 6. #FTTB 8.717 posts
- 7. Kawhi 11,2 B posts
- 8. Luther Burden 6.382 posts
- 9. Swift 53,8 B posts
- 10. Collinsworth 3.353 posts
- 11. #CHIvsSF 2.902 posts
- 12. Eagles 118 B posts
- 13. Josh Allen 42,5 B posts
- 14. Danielle 58,8 B posts
- 15. Ben Johnson 8.650 posts
- 16. #SNFonNBC N/A
- 17. Seahawks 36,2 B posts
- 18. #BaddiesUSA 10,8 B posts
- 19. Bills 127 B posts
- 20. Jennings 14,7 B posts


Something went wrong.
Something went wrong.