
Mike Paulenoff
@MPTrader
35 Yrs on Wall Street, Macro & Behavioral Financial Market Strategist, Author, Columnist, Lawrenceville School, Georgetown Univ. SFS '79, Gtown Tennis '76-'79
You might like


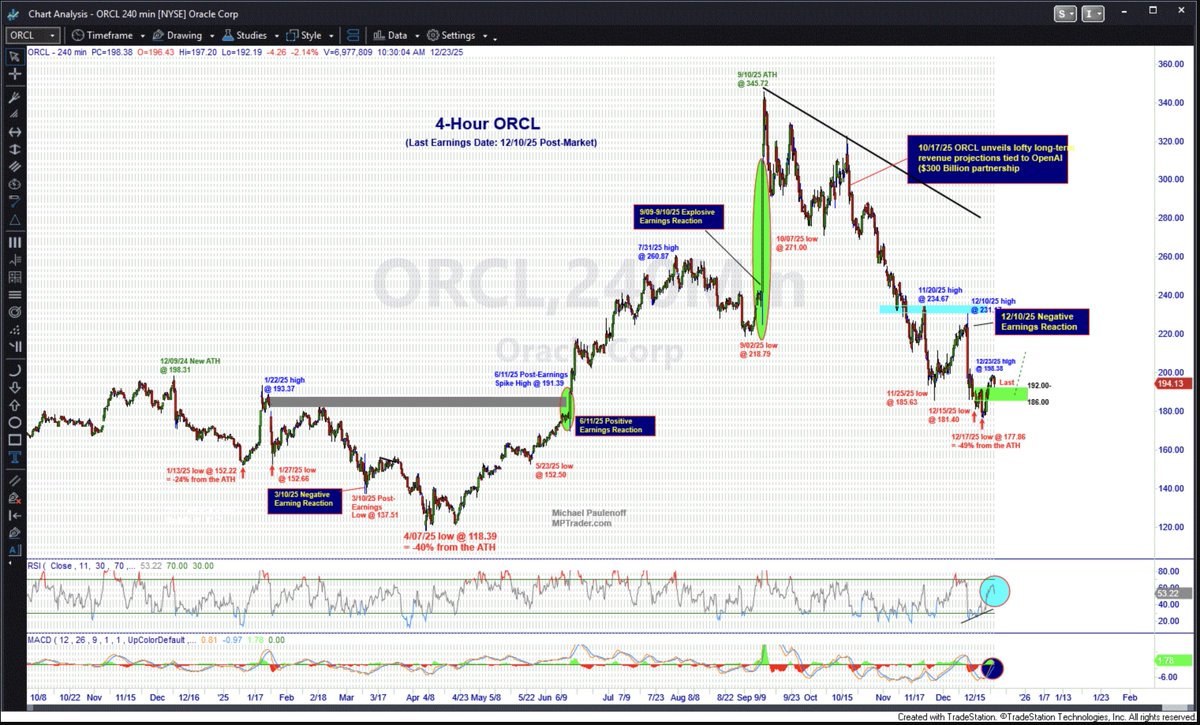
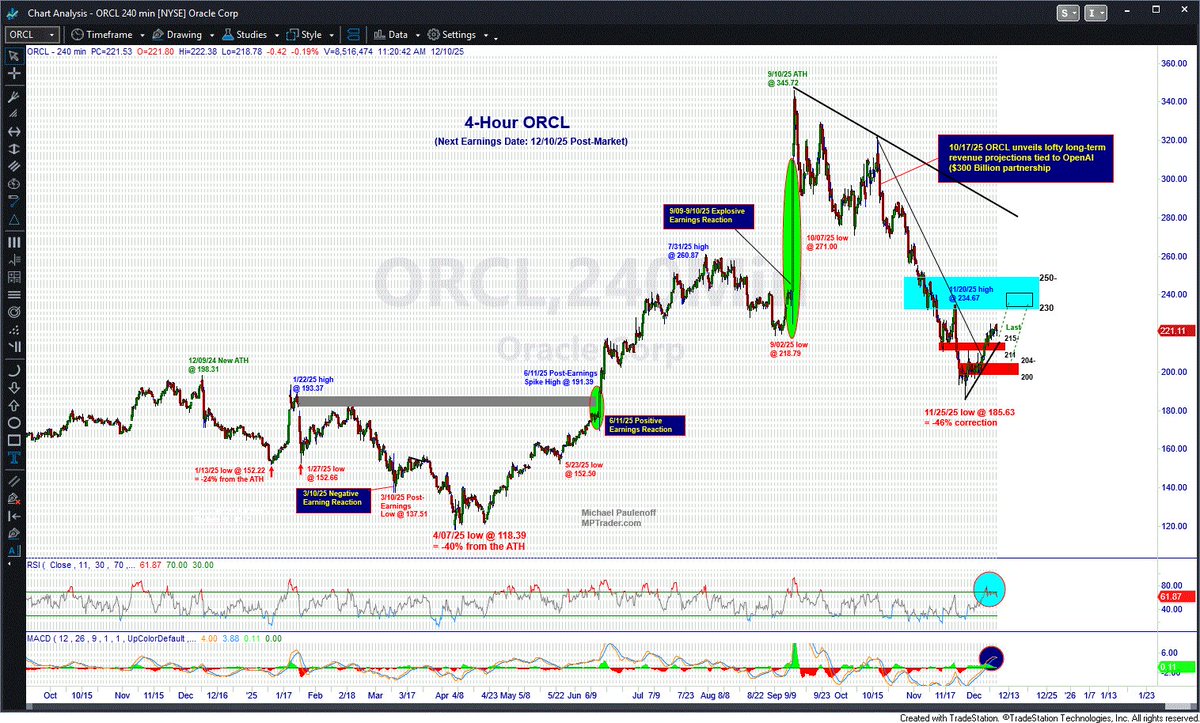
$ORCL-- Purely from my technical setup work, ORCL has the right look of a near-50% corrective pattern (see my attached 4-Hour Chart) that reached downside exhaustion at last week's low of 177.86. Since the low was established, ORCL has climbed to this AM's pre-market high at…
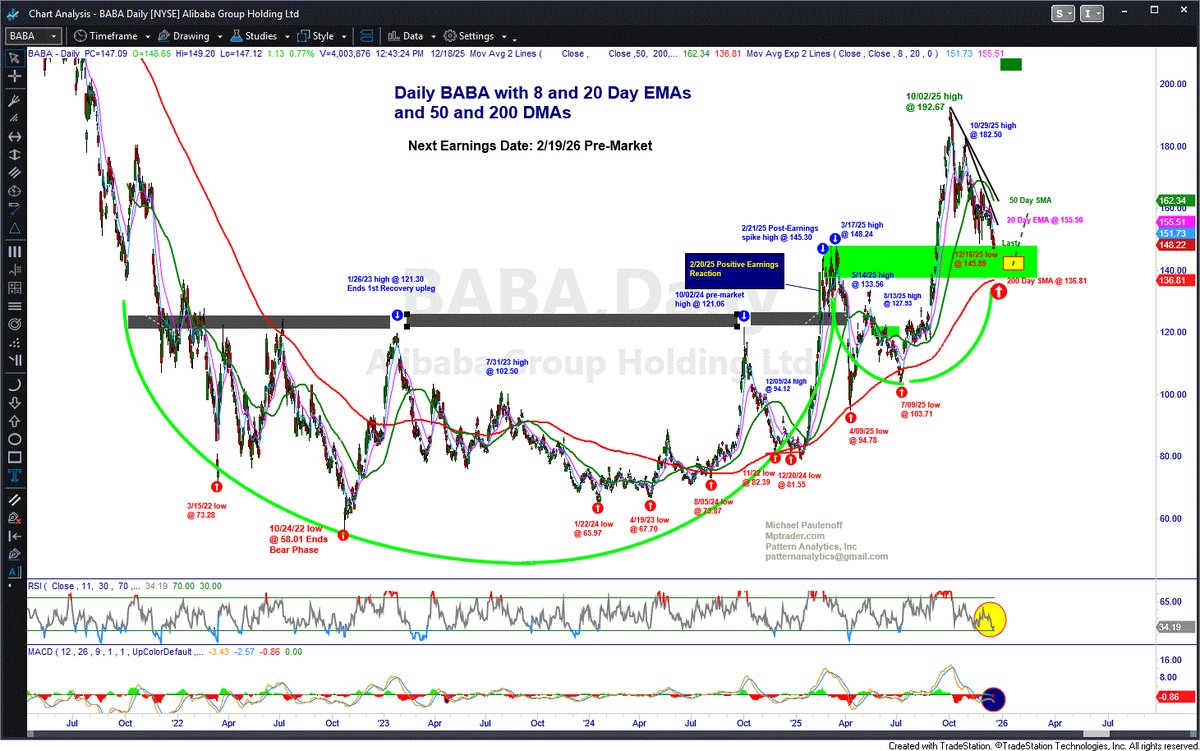
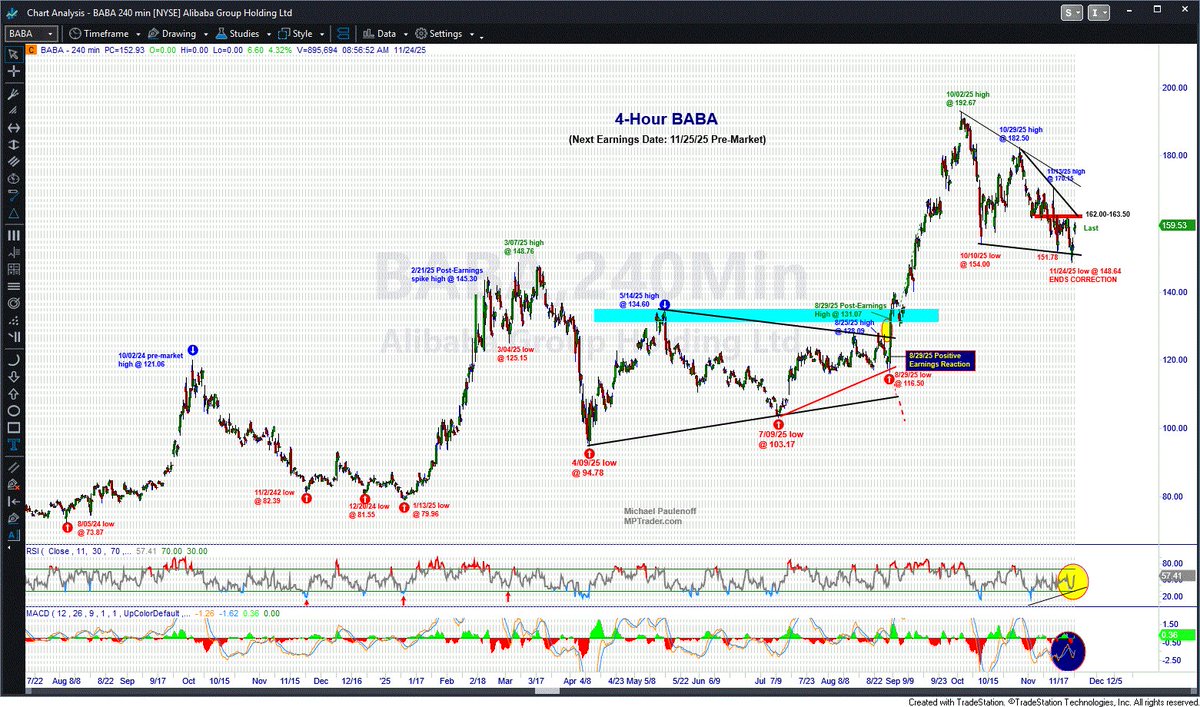
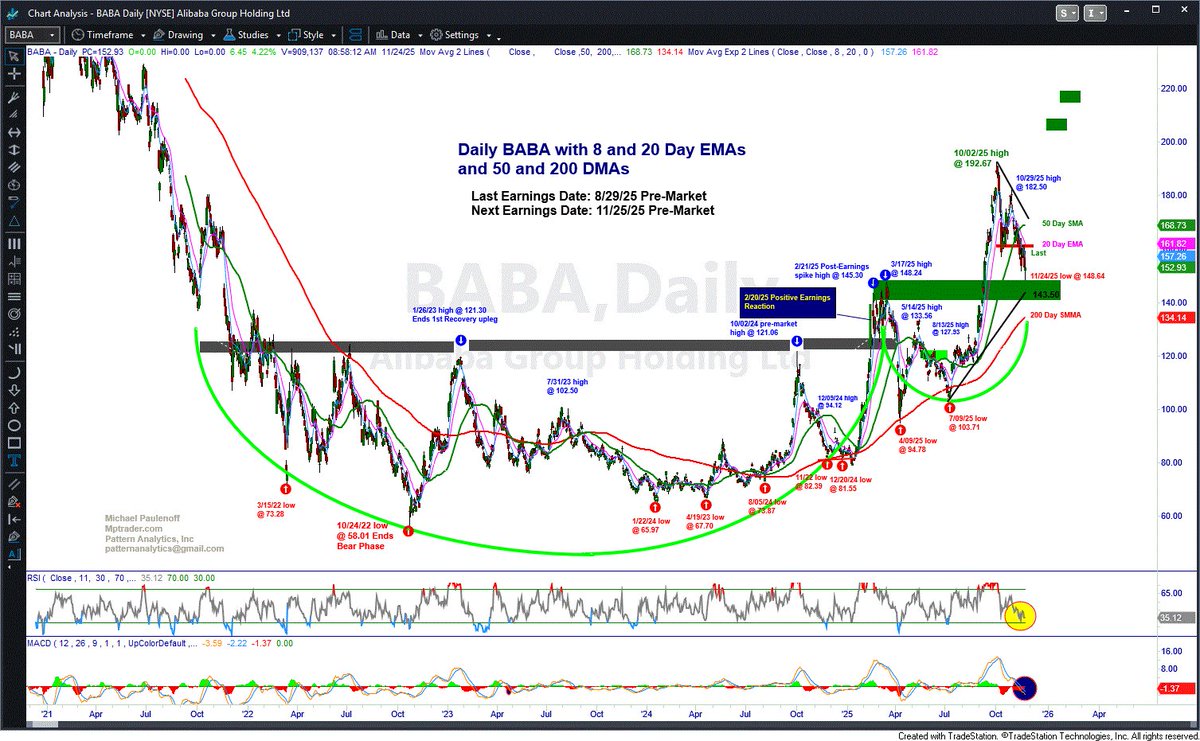
One of our members requested an update on the big China names, such as $BABA, which we see on my attached Big Picture Daily Chart exhibits a still, very powerful 4-year, intermediate-term base-accumulation pattern contrasted with a near-term correction that, when complete, should…
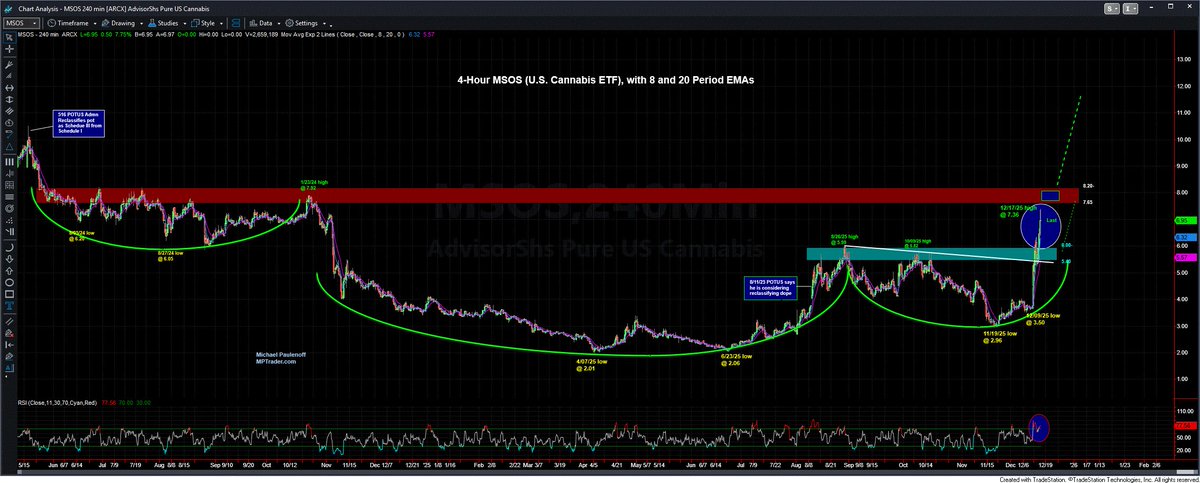
$MSOS (U.S. Cannabis Fund ETF) has gapped up 8% on expectations that POTUS will sign an executive order to reschedule marijuana within hours. Today's upside thrust points the price structure at a test of 18 month resistance from 7.65 to 8.20 that, if (when?) hurdled, will…
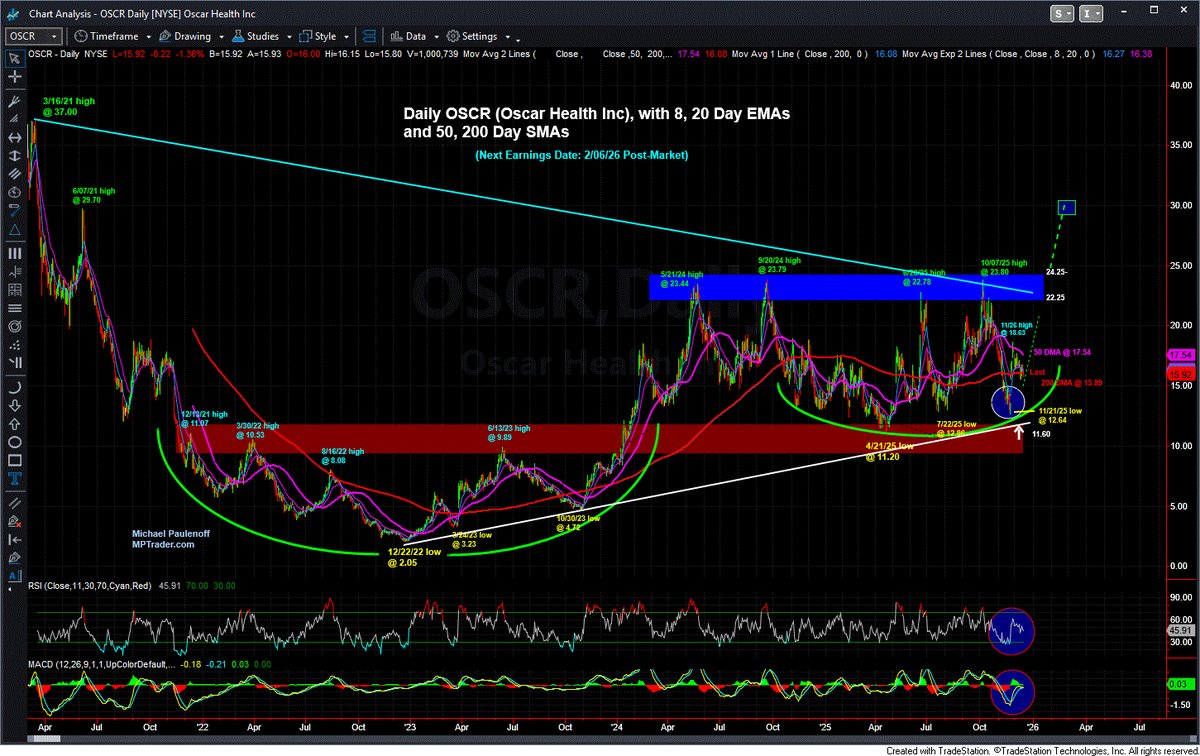
$OSCR (Oscar Health)-- Apart from healthcare becoming a political football, especially heading toward next year's mid-term elections, my chart work on OSCR indicates that the stock established a significant low at 12.64 on 11/21/25 that concluded the entire corrective process…
$ROKU: One look at my Big Picture Daily Chart suggests strongly that ROKU could be one of the BIG WINNERS in the streaming battles in 2026. I have no idea why, but this independent entertainment company that streams into 90 million households around the globe exhibits explosive…

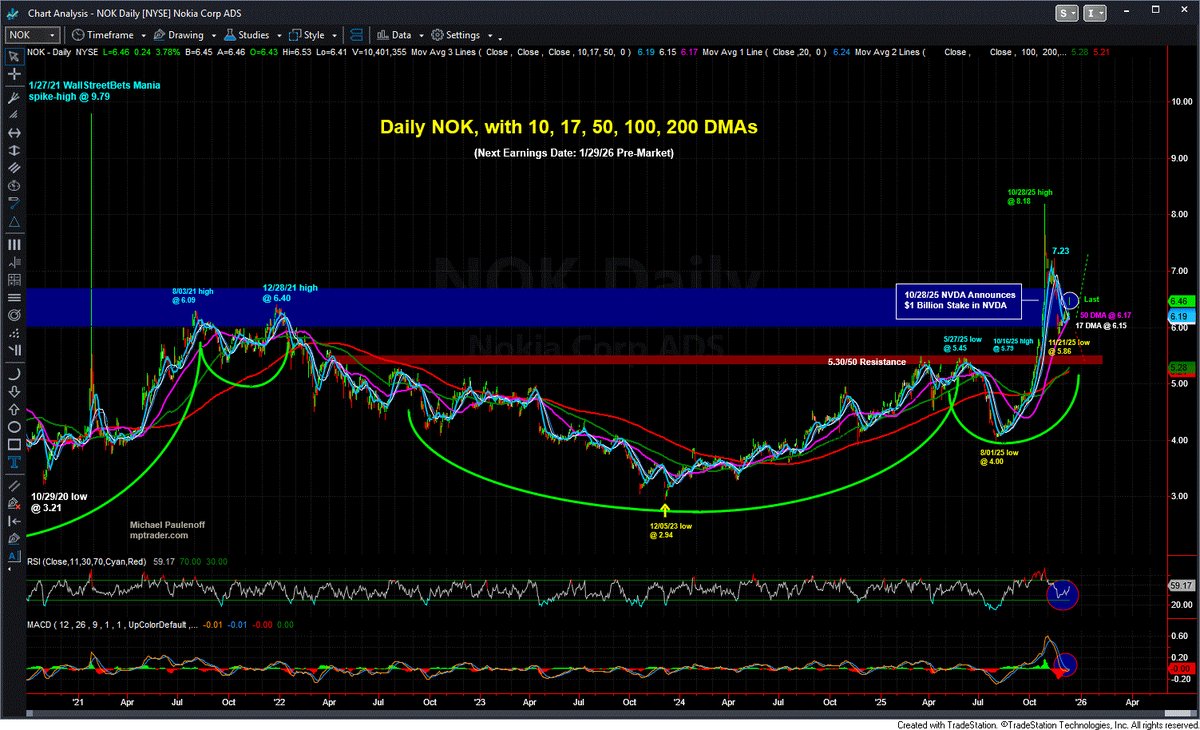
Although I can't find a reason why $NOK popped 4% this AM, my Big Picture technical setup has indicated and still indicates that the multi-month and multi-year price paths point to much higher prices from 10 to 12.50 in the upcoming days and weeks. Today's up-gap open has the…
$ORCL reports Earnings tonight after the close. My technical setup work indicates that the recovery rally from the 11/25/25 major corrective low at 185.63 (see my attached 4-Hour Chart) to the 12/08/25 high at 224.75 has unfinished business on the upside into the 232-240 target…
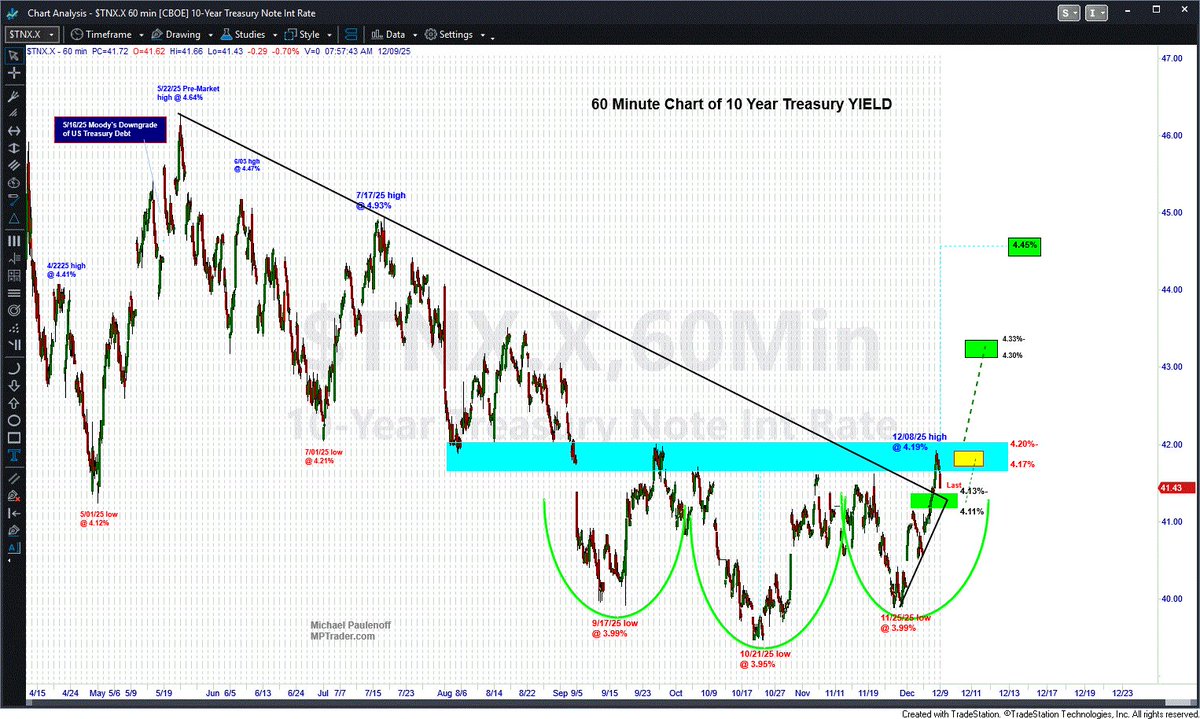
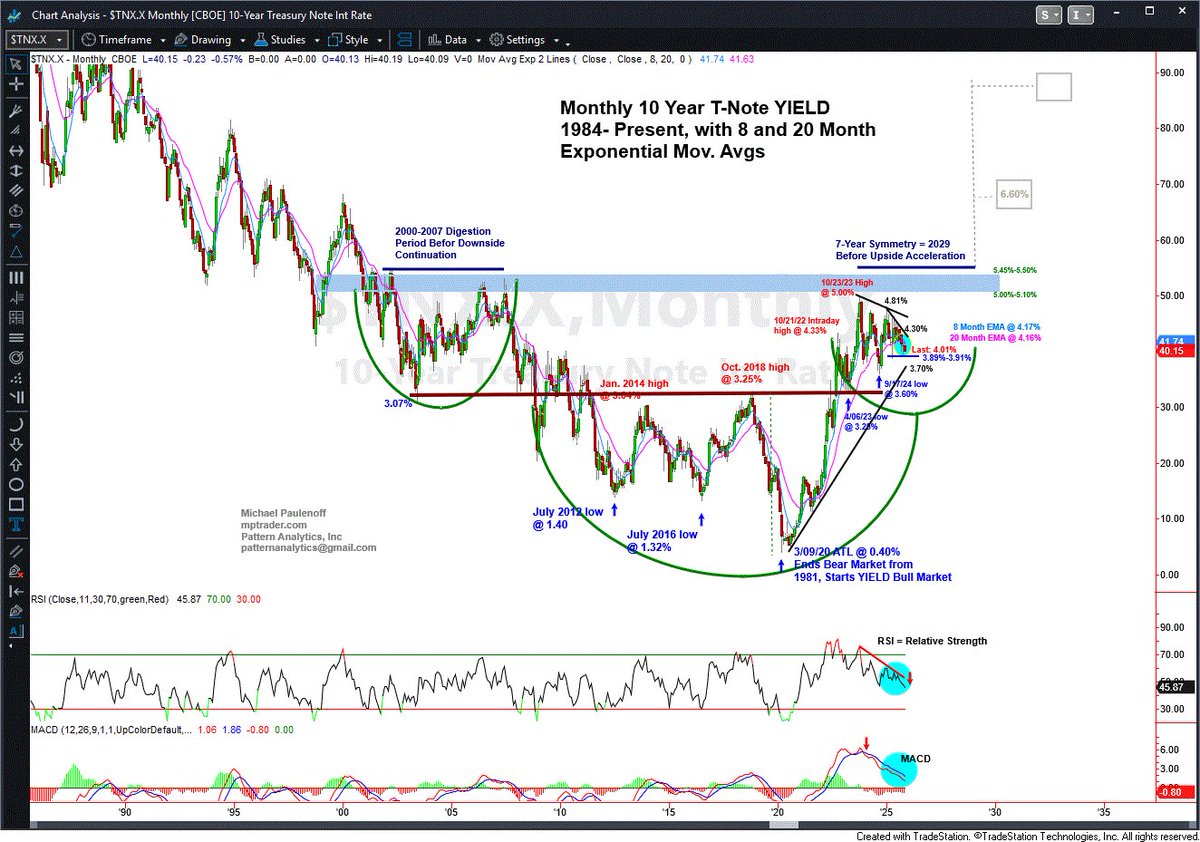
Considering the FOMC will make a significant rate decision and issue a meaningful policy statement on Wednesday afternoon, we should be acutely aware of the reaction of Benchmark 10-year YIELD. 10-year YIELD has carved out an "interesting" if not disturbing pattern on the longer…
$META Follows My Recovery Rally Scenario ... My Daily Chart shows that during the ensuing two weeks, META has surged to the upside along my preferred price path, hitting a November-December 2025 recovery rally high at 676.10 on 12/04/25, the day CEO Mark Zuckerberg announced…
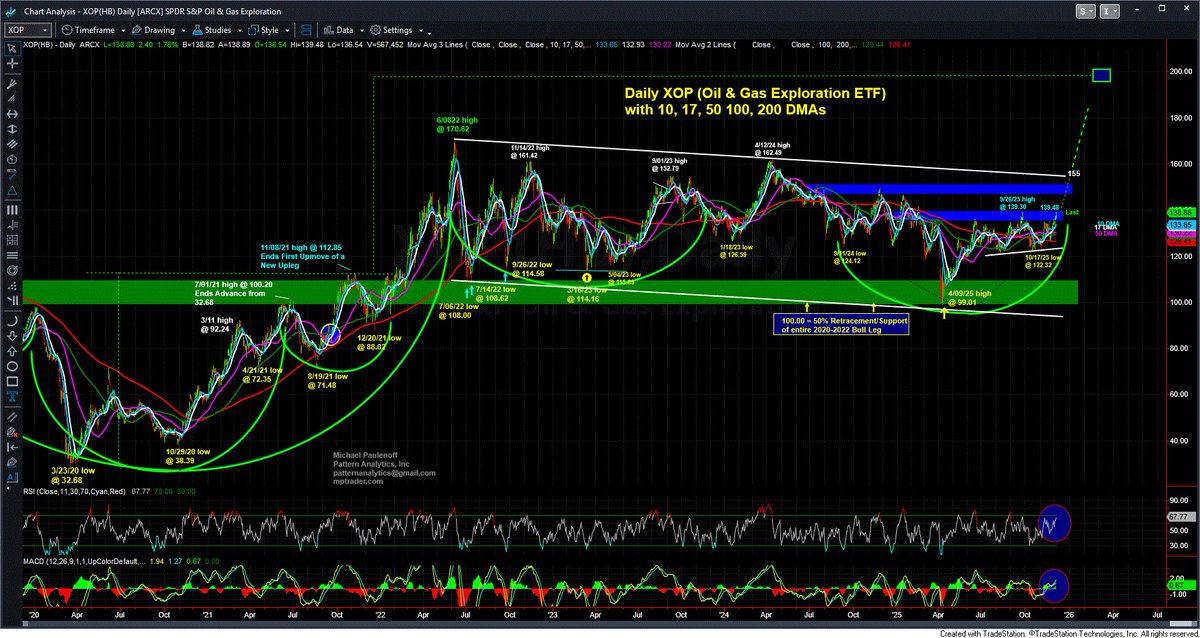
$XOP: My attached Big Picture chart from the March 2020 Pandemic Lows shows the 2020 to 2022 bull phase from 32.68 to 170.62, followed by an agonizingly prolonged digestion-correction period into the April 2025 low at 99.01, which represented a near perfect 50% retracement of…
Three Charts (Nat Gas futures, $BOIL and $CTRA) on upside potential for natural gas... mptrader.com/p/analysis/Thr…

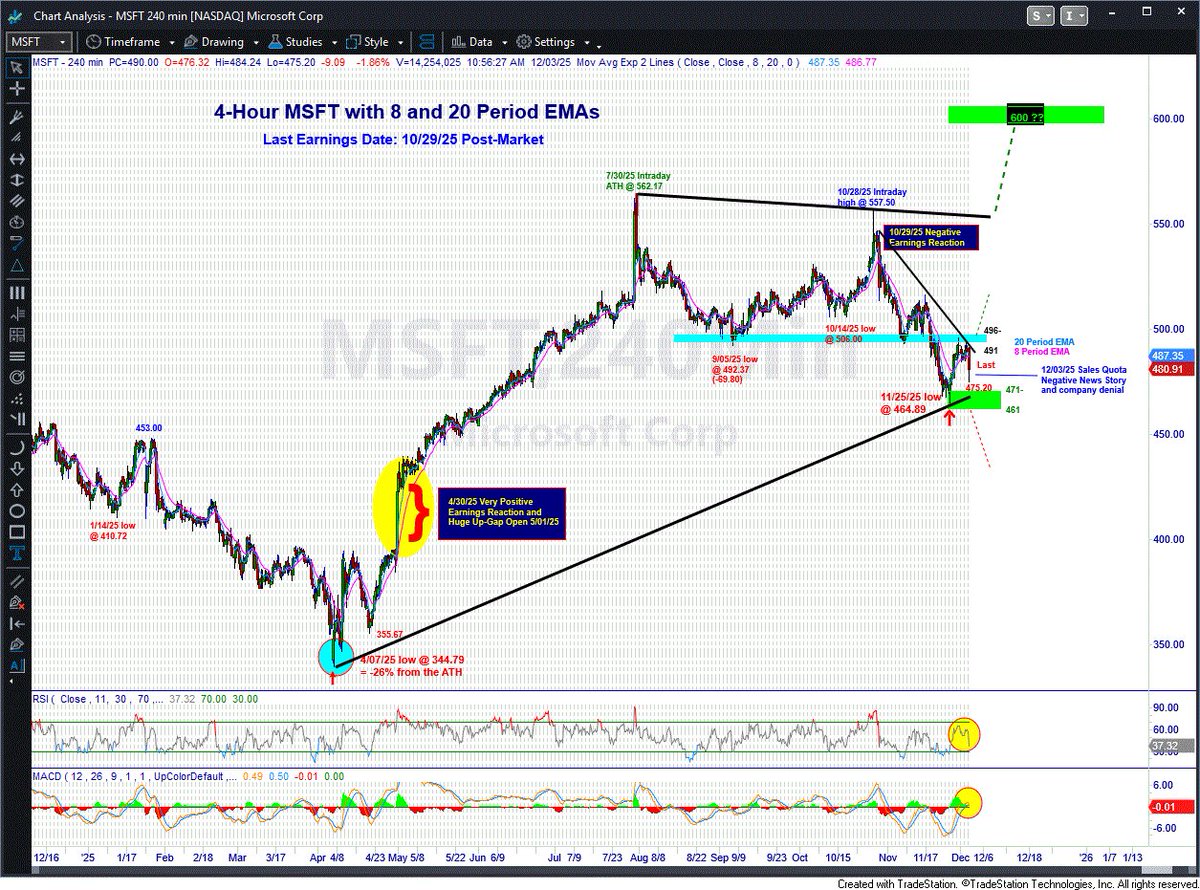
After today's whipsaw price action on a story and the company denial that $MSFT had lowered sales quotas for its salesforce (indicating that monetizing the new AI products is more difficult than previously thought), what does the technical setup indicate? Bottom Line: As long…
ES, #Bitcoin, $MSTR higher this am -- see our charts -- plus Fed entering a less restrictive period of monetary policy plumbing, which has a dovish, bullish influence on the equity markets. mptrader.com/p/analysis/ES-…

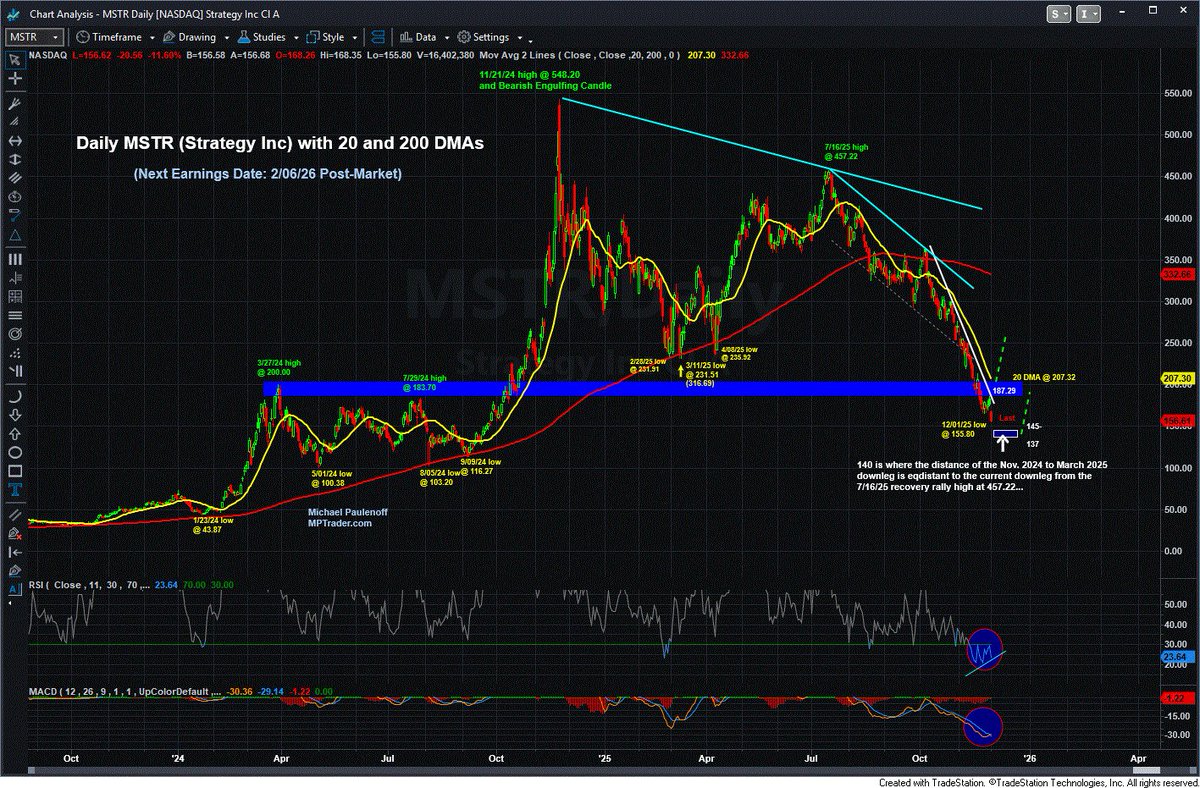
$MSTR (Strategy Inc) is under intense pressure again in reaction to the plunge in Bitcoin. The stock hit a new 12-month corrective low at 155.80 off its 548.20 ATH (11/21/24), a decline of 71.6% so far. Since today's weakness into new corrective low territory is not confirmed by…
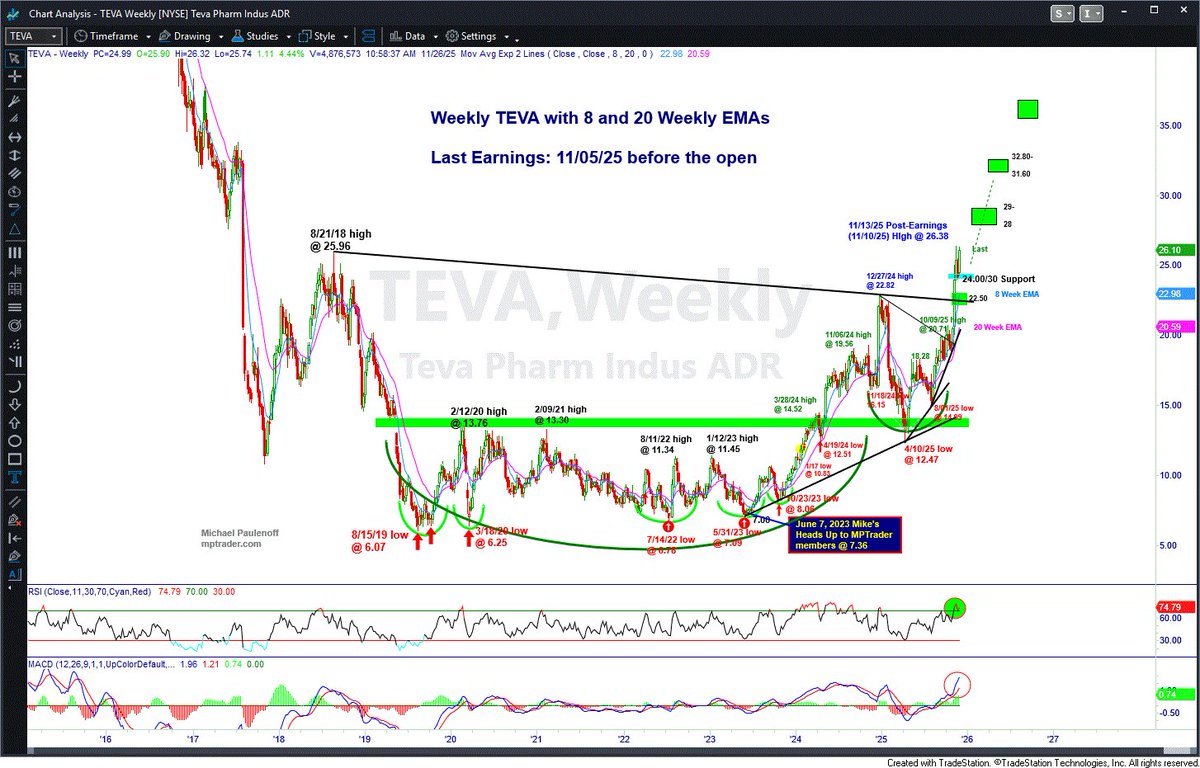
The BIG Picture technical setup in $TEVA (Teva Pharma) keeps on giving, and has the right look of entering a new upleg off its massive multiyear base formation shown on my attached Weekly Chart. As long as last Friday pivot low at 24.01 remains intact, my next optimal upside…
A slew of old economic data was released this AM, showing a relatively weak labor market (ADP), weaker than expected Retail Sales, and stalled inflationary pressures that have pressured 10-year YIELD toward 4% again as November comes to a close in 2-1/2 trading days. My Monthly…
$BABA reports Earnings before Tuesday's opening bell. Technically, my pattern setup argues strongly that BABA completed a 7-week, 23% correction at Friday's low of 148.64, followed by this AM's news-inspired 4.4% pop. This initiates a new upleg that has the right look of the next…
The stronger-than-expected September Payrolls data elicited a positive reaction from the Equity Indices. On top of the NVDA-induced ES vertical spike from 6680 to 6740, the index spiked to a high of 6772.75 so far, a full 2.7% above Tuesday's 5.2% corrective low from the ATH.

Can Equity Indices Regain Upside Traction Ahead Of Wed's NVDA Earnings Report? mptrader.com/p/analysis/Can…


United States Trends
- 1. $LUNA 1,469 posts
- 2. Utah 32.1K posts
- 3. Maxx Crosby 3,637 posts
- 4. Amorim 43.9K posts
- 5. Kyle Whittingham 14.1K posts
- 6. Newcastle 59K posts
- 7. Dorgu 36.6K posts
- 8. Kwanzaa 31.6K posts
- 9. New Mexico 5,859 posts
- 10. #MUNNEW 10.4K posts
- 11. Northwestern 9,971 posts
- 12. Cunha 13.3K posts
- 13. Scalley N/A
- 14. #MUFC 19.7K posts
- 15. Jay Hill 1,030 posts
- 16. Somaliland 85.9K posts
- 17. #GoBlue 1,743 posts
- 18. Zirkzee 6,234 posts
- 19. Casemiro 20.8K posts
- 20. Ayden Heaven 6,811 posts
You might like
-
 Harry Boxer, TheTechTrader.com
@harryboxer -
 ElliottWaveTrader
@AviGilburt -
 Douglas Busch CMT
@chartsmarter -
 Small Cap Strategist
@SmCapStrategist -
 Steven Goldstein
@AlphaMind101 -
 Frank Zorrilla
@ZorTrades -
 Schaeffer's Investment Research
@schaeffers -
 See It Market
@seeitmarket -
 Kunal Desai
@kunal00 -
 Mark Arbeter, CMT
@MarkArbeter -
 Zachary Mannes
@ZacMannes -
 ICEMAN
@IcemanTrading -
 Harry Dunn
@harrydunn88 -
 joeydowntown.eth
@downtowntrader -
 BASED CAJUN
@RaginCajun
Something went wrong.
Something went wrong.