
내가 좋아할 만한 콘텐츠


Download my FREE eBook on Technical Analysis Subscribe to my newsletter, you’ll receive it in a welcome email. Get real life charts for: ✅RSI, Stochastic, MACD ✅Bollinger Bands ✅Candlesticks ✅Moving Averages ✅Fibonacci SmartReversals.com $SPY $QQQ $BTC $NVDA & more.

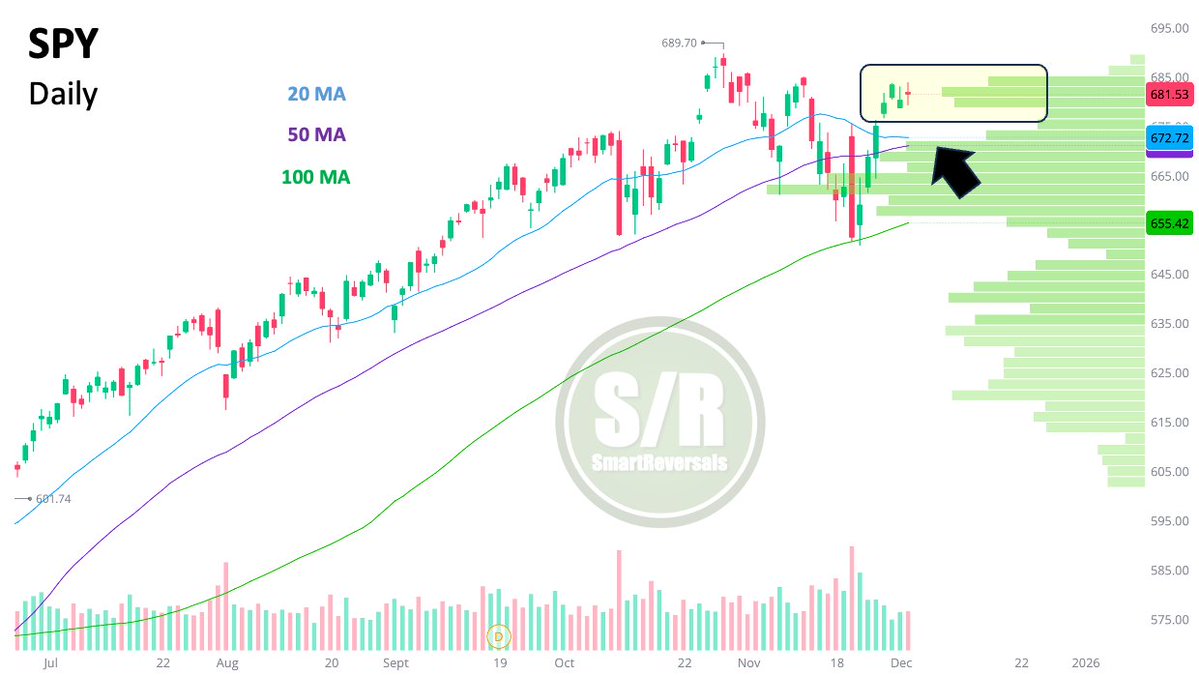
$SPY is consolidating above the current volume shelf following last week's strong bounce. While a gap fill would be normal and healthy, it is not guaranteed. The confluence of the 20DMA, 50DMA, and the lower shelf forms a strong support zone (arrow).
My latest Market Intelligence maps exactly where $SPX & $NDX stand in this bull cycle. I anticipated a -5% pullback. The market delivered -5.7% for the SP500🎯. Cut the noise. Focus on price structure with clear technicals. Read the full analysis here: 👇 smartreversals.com/p/stage-of-the…
My latest Market Intelligence maps exactly where $SPX & $NDX stand in this bull cycle. I anticipated a -5% pullback. The market delivered -5.7% for the SP500🎯. Cut the noise. Focus on price structure with clear technicals. Read the full analysis here: 👇 smartreversals.com/p/stage-of-the…
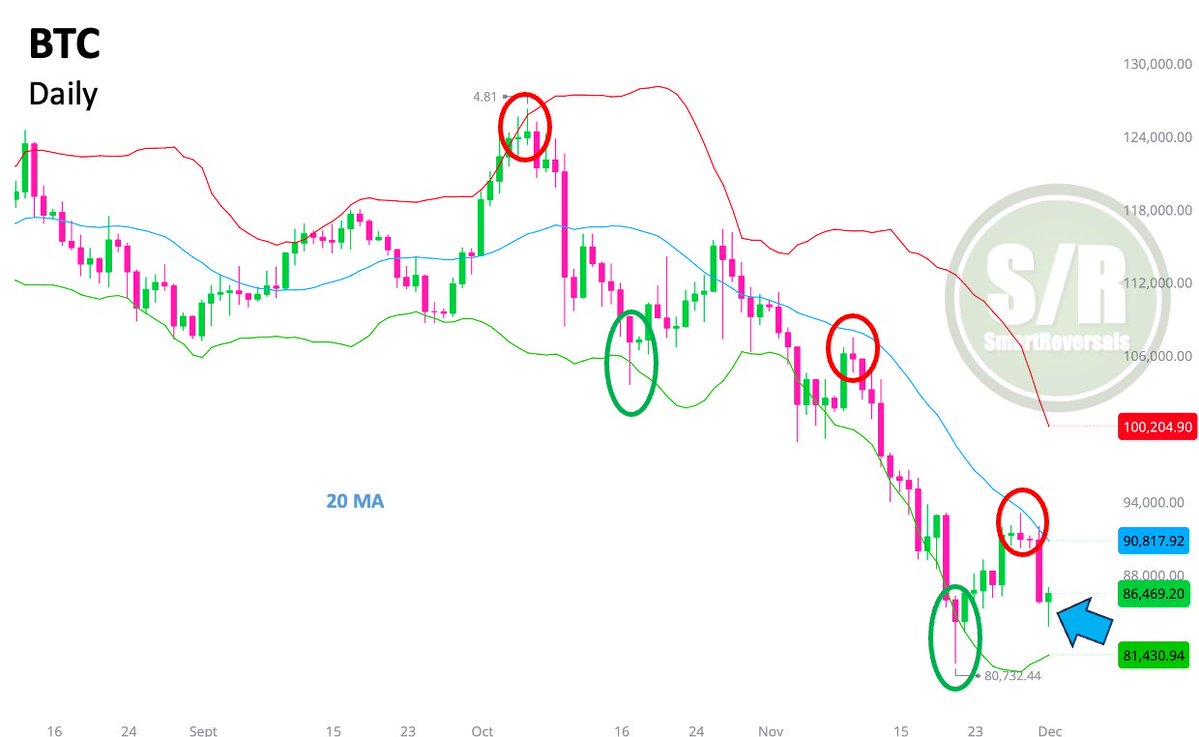
#Bitcoin is Printing a Daily Hammer: Yes, the 20DMA can reject the price again, but this time the lower Bollinger band is curling up. A visit to $90K is likely as long as the latest candle holds its current shape and sets a higher low. $BTC.
Download my FREE eBook on Technical Analysis Subscribe to my newsletter, you’ll receive it in a welcome email. Get real life charts for: ✅RSI, Stochastic, MACD ✅Bollinger Bands ✅Candlesticks ✅Moving Averages ✅Fibonacci SmartReversals.com $SPY $QQQ $BTC $NVDA & more.
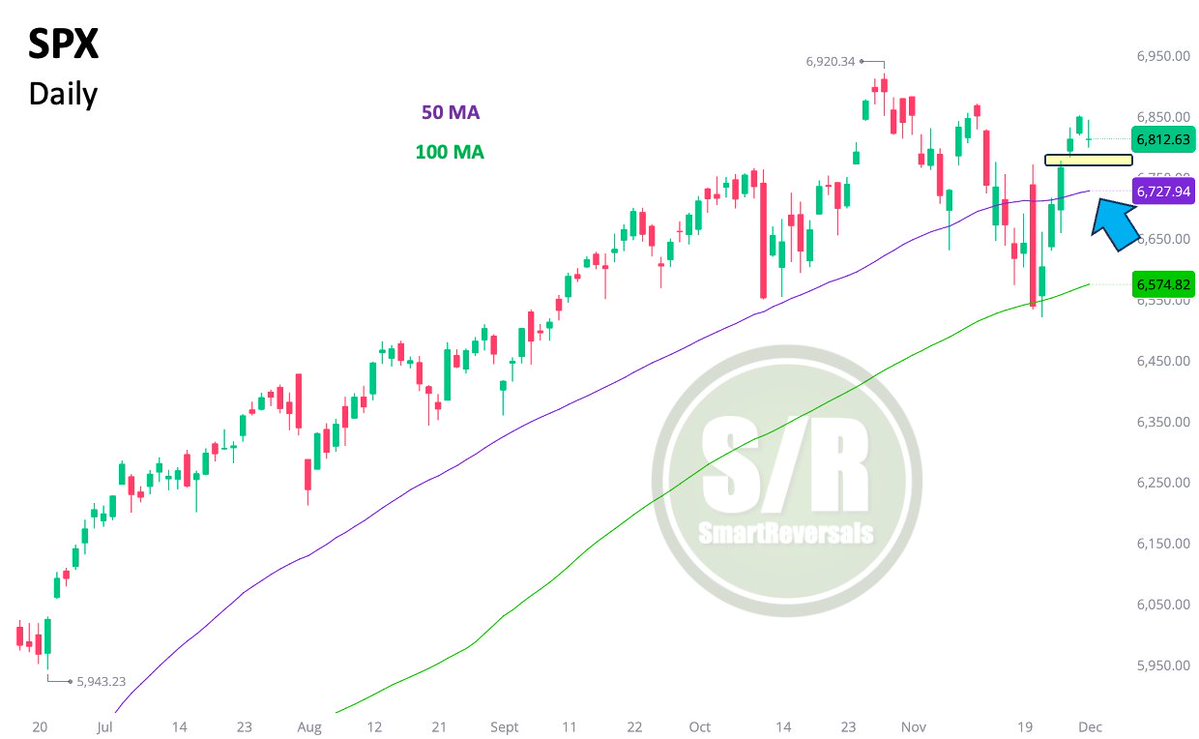
$SPX: At this stage of the bull market, the sooner a gap is filled, the better for healthy continuation. The level of $6,776.4 is acting as a magnet, and the 50DMA is the next line of defense. A consolidation after a +3.73% rally is perfectly normal. #StockMarket
Download my FREE eBook on Technical Analysis Subscribe to my newsletter, you’ll receive it in a welcome email. Get real life charts for: ✅RSI, Stochastic, MACD ✅Bollinger Bands ✅Candlesticks ✅Moving Averages ✅Fibonacci SmartReversals.com $SPY $QQQ $BTC $NVDA & more.
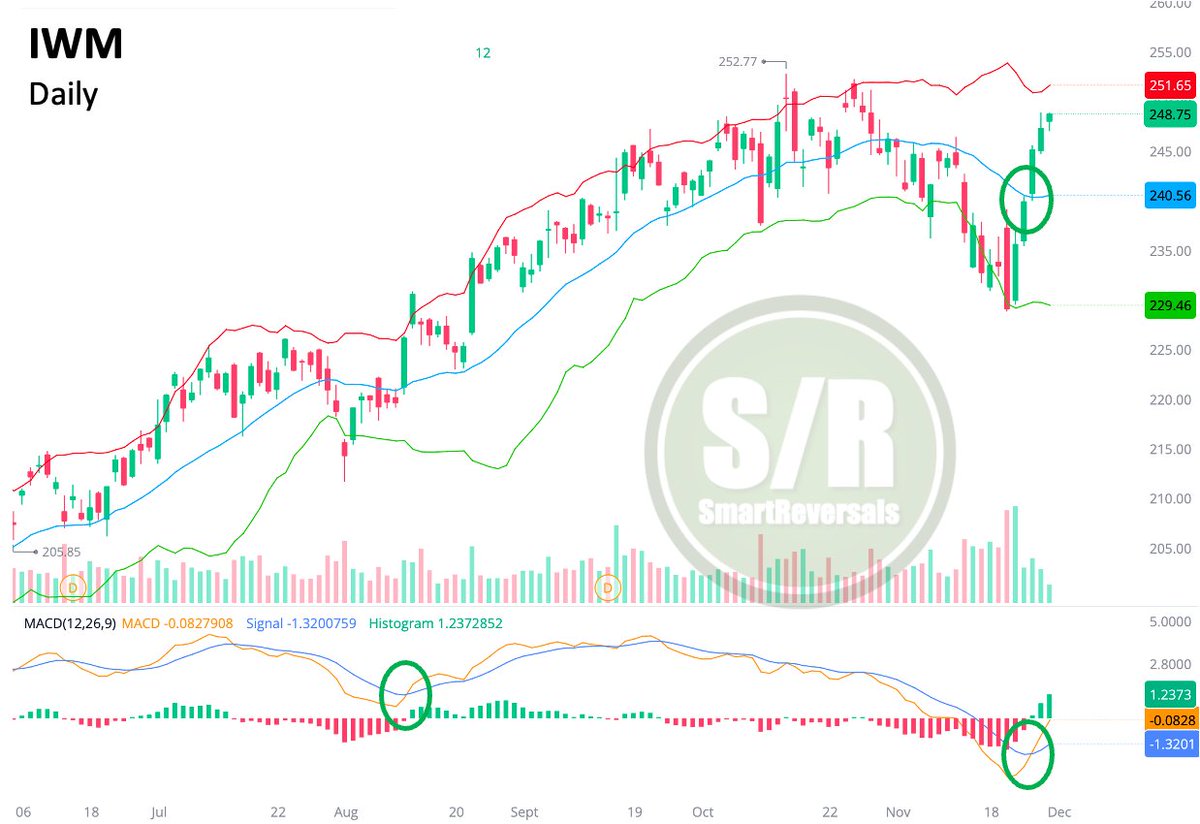
$IWM was my top pick in last Saturday's Weekly Compass due to an immaculate weekly technical setup. The daily chart now confirms that view after a +5.5% rally with a bullish MACD cross and a breakout above the 20DMA. Subscribers secured a clean entry on Monday above the central…
Download my FREE eBook on Technical Analysis Subscribe to my newsletter, you’ll receive it in a welcome email. Get real life charts for: ✅RSI, Stochastic, MACD ✅Bollinger Bands ✅Candlesticks ✅Moving Averages ✅Fibonacci SmartReversals.com $SPY $QQQ $BTC $NVDA & more.
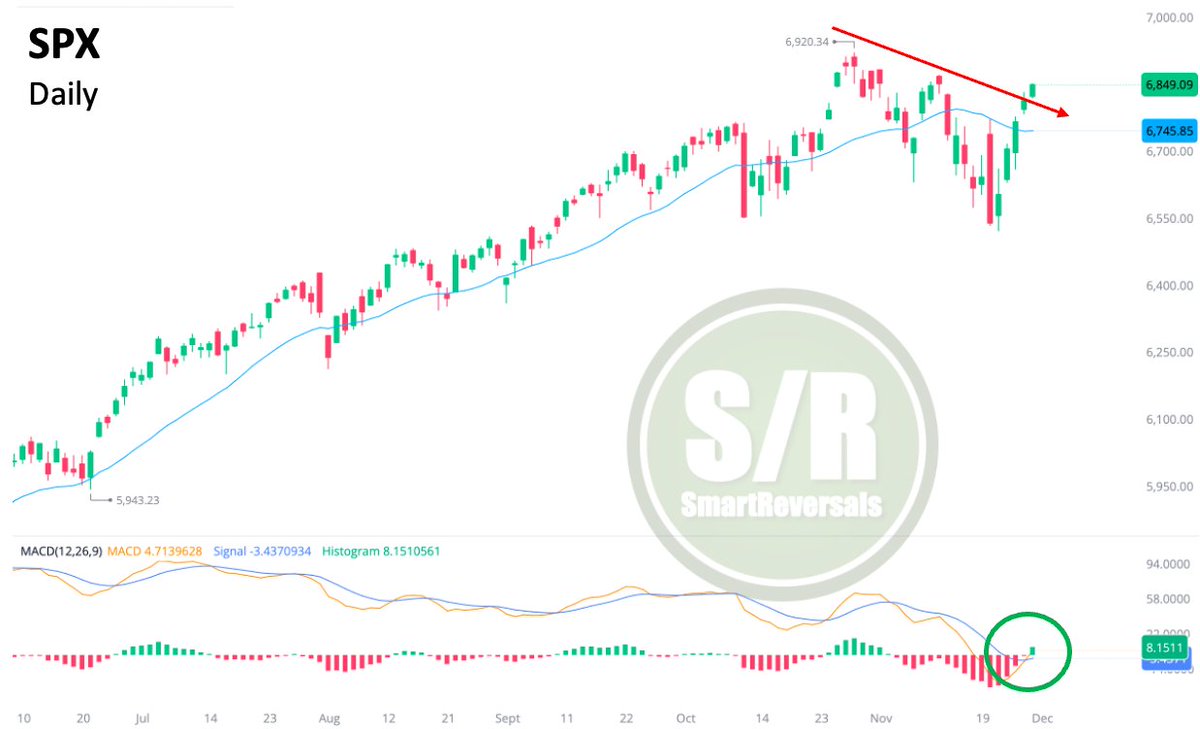
$SPX: Bullish MACD Crossover bouncing at neutral zone validating a momentum shift. The diagonal resistance has been breached. Bullish momentum is on, and the healthy -5.5% pullback is complete. $IWM rallied this week as posted in my newsletter last Saturday, $META & $WMT as well.
Download my FREE eBook on Technical Analysis Subscribe to my newsletter, you’ll receive it in a welcome email. Get real life charts for: ✅RSI, Stochastic, MACD ✅Bollinger Bands ✅Candlesticks ✅Moving Averages ✅Fibonacci SmartReversals.com $SPY $QQQ $BTC $NVDA & more.
On my site, premium subscribers can suggest specific securities for weekly S/R modeling. I just posted the requested list in the premium chat (beyond the usual 40). Two standouts were $BMNR and $CRDO. If you want to see those charts here, Like x100 & Repost x20
Download my FREE eBook on Technical Analysis Subscribe to my newsletter, you’ll receive it in a welcome email. Get real life charts for: ✅RSI, Stochastic, MACD ✅Bollinger Bands ✅Candlesticks ✅Moving Averages ✅Fibonacci SmartReversals.com $SPY $QQQ $BTC $NVDA & more.
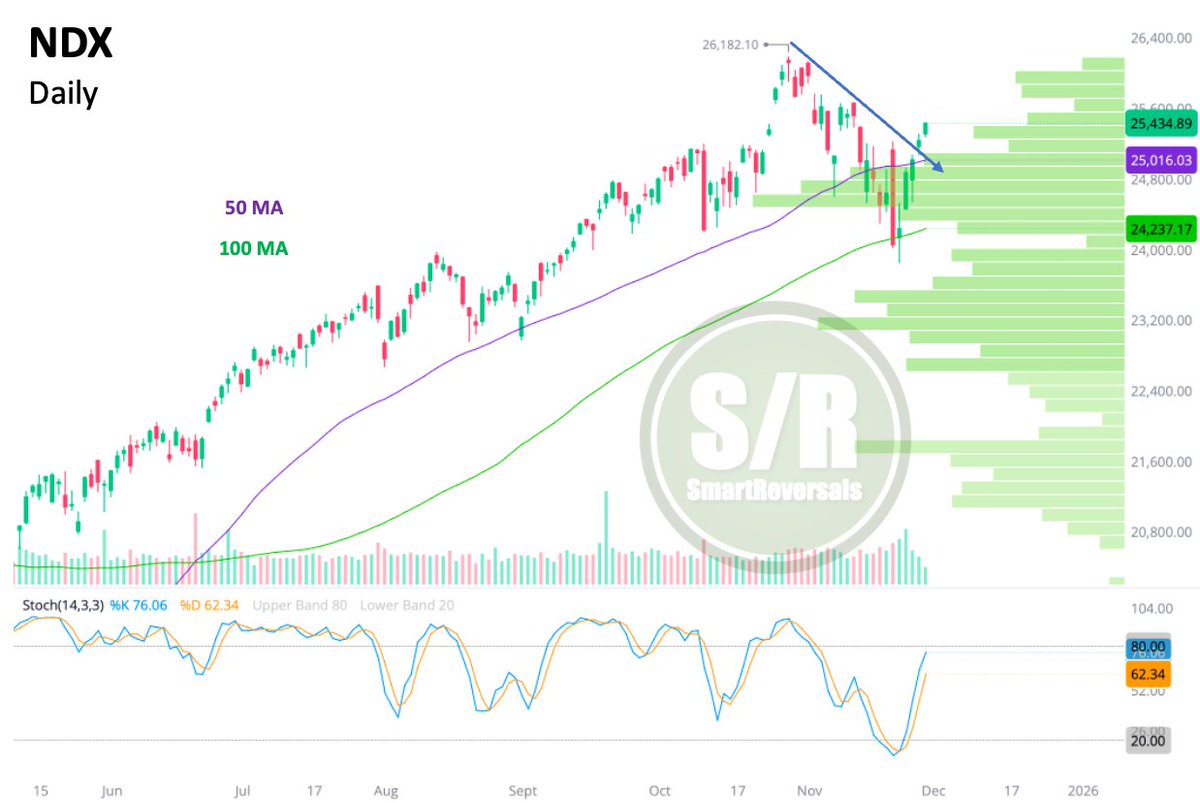
$NDX: Price bounced from the 100DMA and the key annual level zone $23,564. Breaking the 20DMA and the trend of lower highs is bullish. Stochastic suggest the move isn't done. If we consolidate, the 50DMA has flipped to support near the volume shelf.
Download my FREE eBook on Technical Analysis Subscribe to my newsletter, you’ll receive it in a welcome email. Get real life charts for: ✅RSI, Stochastic, MACD ✅Bollinger Bands ✅Candlesticks ✅Moving Averages ✅Fibonacci SmartReversals.com $SPY $QQQ $BTC $NVDA & more.
Charts posted after Friday’s close: $SPX $IWM $NVDA $PLTR Check them out! Like and repost for more 👍🔄
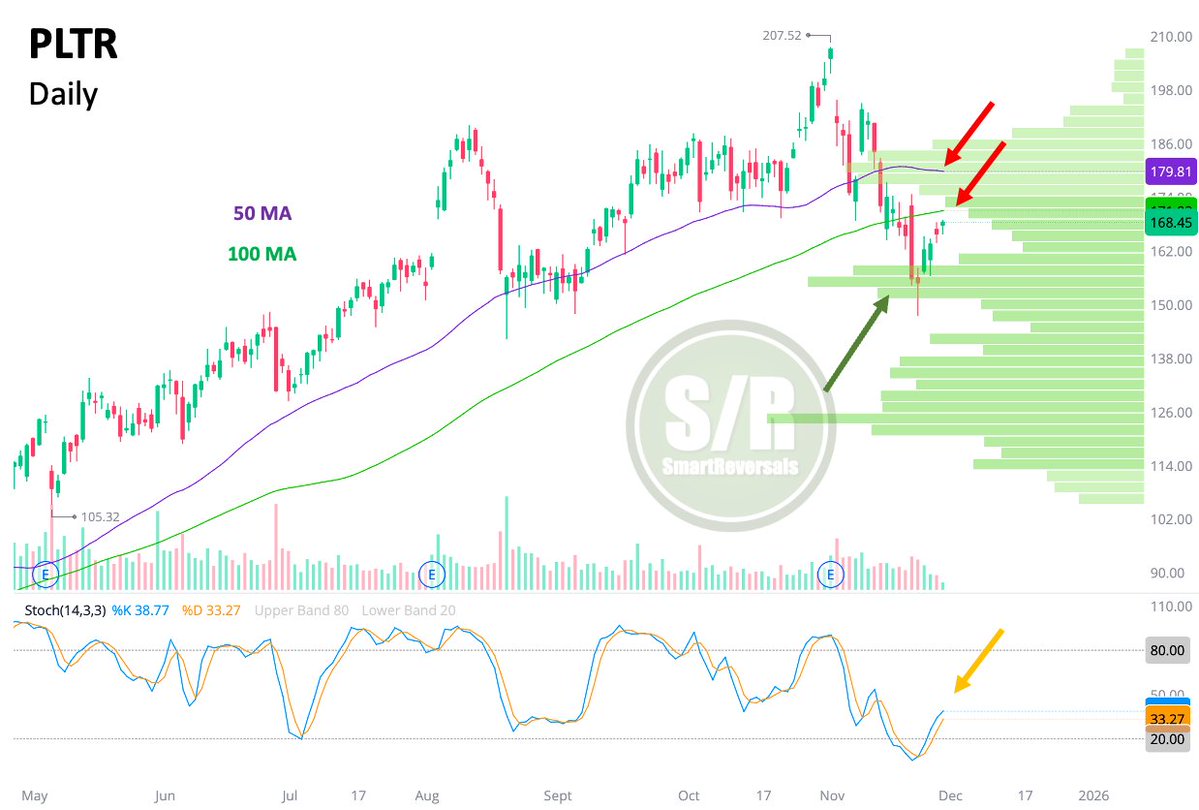
$PLTR: Bounced following the hammer candle at the volume shelf. But the uptrend is compromised: not only the 50DMA but the 100DMA was lost, they're significant hurdles to surpass, and the last two days lack conviction, and the Stochastic is curling down. More momentum is needed.
Download my FREE eBook on Technical Analysis Subscribe to my newsletter, you’ll receive it in a welcome email. Get real life charts for: ✅RSI, Stochastic, MACD ✅Bollinger Bands ✅Candlesticks ✅Moving Averages ✅Fibonacci SmartReversals.com $SPY $QQQ $BTC $NVDA & more.
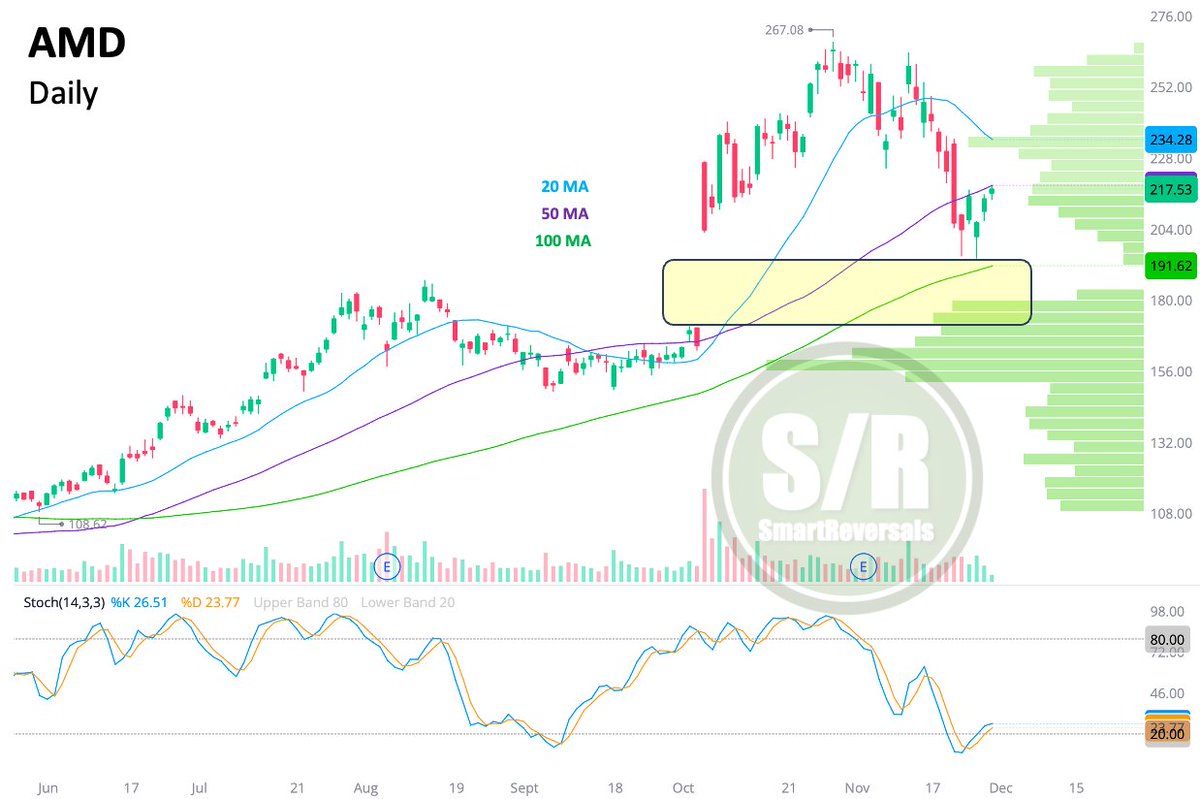
$AMD: Monday's bounce vanished, retesting lows on Wednesday. The latest candle lacks bullish conviction, and Stochastics are curling down. The gap is acting as a magnet; $ORCL filled its gap, will AMD differ? Better setups are elsewhere $SMH?. Learn to read indicators here👇 $QQQ
Download my FREE eBook on Technical Analysis Subscribe to my newsletter, you’ll receive it in a welcome email. Get real life charts for: ✅RSI, Stochastic, MACD ✅Bollinger Bands ✅Candlesticks ✅Moving Averages ✅Fibonacci SmartReversals.com $SPY $QQQ $BTC $NVDA & more.
The Weekly Compass is OUT. 🧭 Access it via the link in bio. The Thanksgiving rally played out as technical analysis suggested last week. Just as the moves in $IWM and $META, this edition has fresh setups to watch now. Updated charts for $BTC, $SMH, $NDX, $SPX, and 20 more.
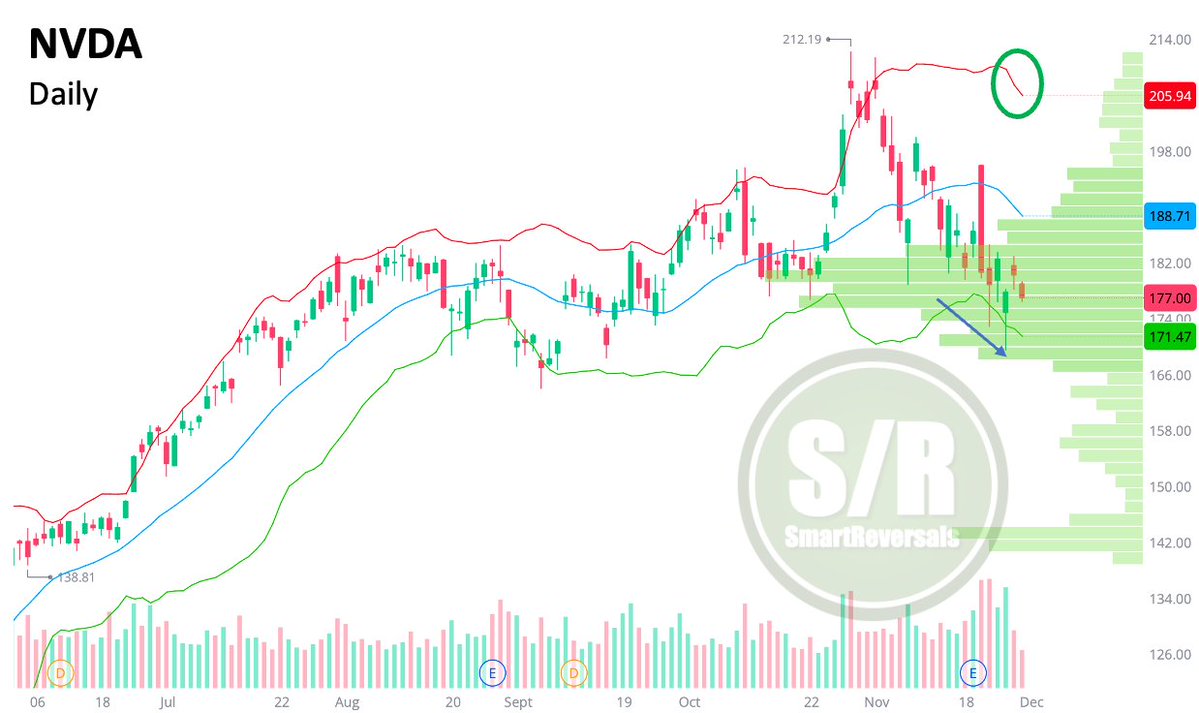
$NVDA: Unlike $SPX and $IWM posted earlier, Nvidia's bounce from Monday has evaporated. The stock failed to reclaim its 20 DMA, and with the Bollinger Bands widening, price action is now targeting critical support at the lower edge of the current volume shelf (arrow). #Rotation
Download my FREE eBook on Technical Analysis Subscribe to my newsletter, you’ll receive it in a welcome email. Get real life charts for: ✅RSI, Stochastic, MACD ✅Bollinger Bands ✅Candlesticks ✅Moving Averages ✅Fibonacci SmartReversals.com $SPY $QQQ $BTC $NVDA & more.
The Weekly and Monthly Support and Resistance Levels are Out for U.S. Indices, ETFs, Magnificent Seven, Futures, Metals, and other major stocks. The bounce is consistent with technical indicators, a green week was expected. Manage your risk and track momentum, access in bio…

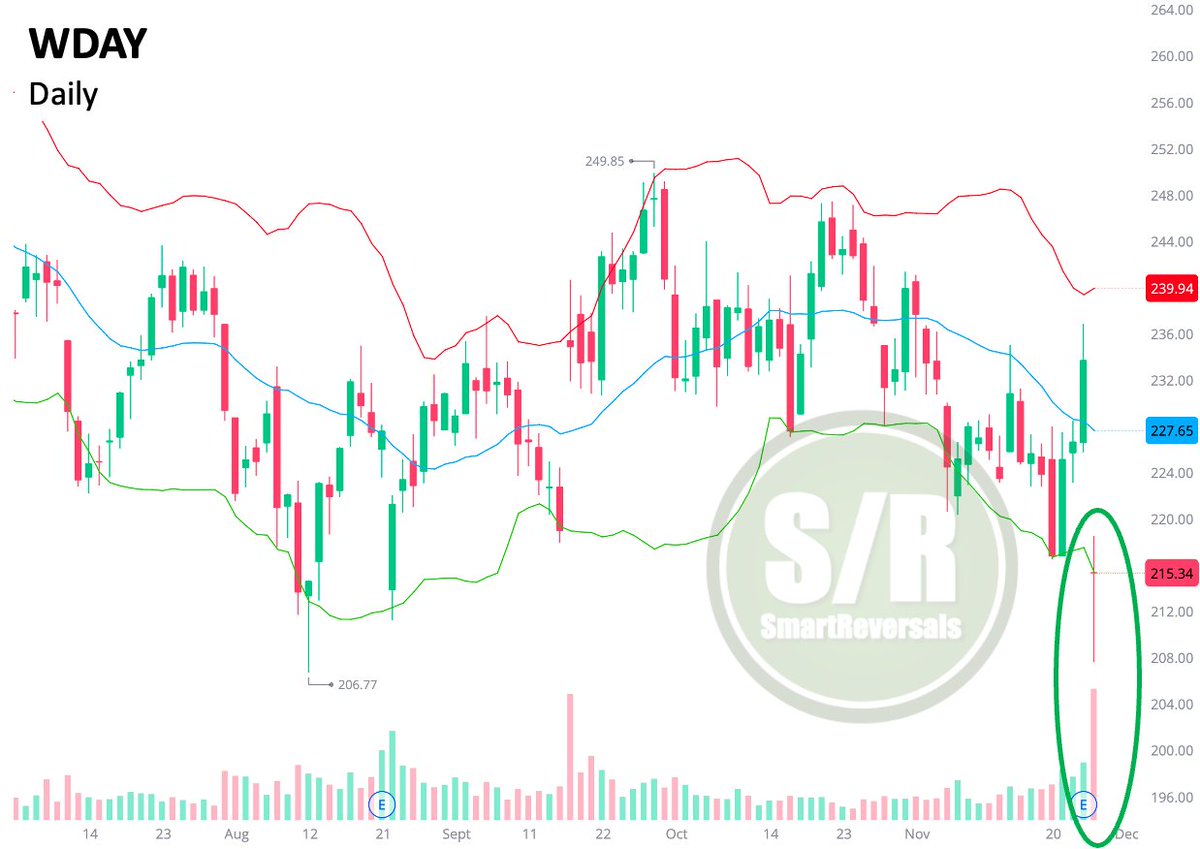
$WDAY printed a bullish dragonfly at the lower Bollinger band, suggesting a bounce to $227. 100 likes 20 reposts to know you're around for more setups. $SPY #StockMarket


United States 트렌드
- 1. Notre Dame 28.5K posts
- 2. Notre Dame 28.5K posts
- 3. #WWENXT 4,726 posts
- 4. Bama 19.1K posts
- 5. Paul Dano 3,624 posts
- 6. Cam Boozer N/A
- 7. Penn State 21K posts
- 8. #CFPRankings N/A
- 9. Tarantino 10.5K posts
- 10. #TADCFriend 2,395 posts
- 11. Stirtz N/A
- 12. Josh Hart 1,035 posts
- 13. Haugh N/A
- 14. Behn 58.9K posts
- 15. Vandy 11K posts
- 16. Van Epps 107K posts
- 17. Somali 178K posts
- 18. Jaylen Carey N/A
- 19. #twitchrecap 14.6K posts
- 20. Bronwyn N/A
내가 좋아할 만한 콘텐츠
-
 King of the Charts - I Cracked the Bitcoin Code
@ChartingProdigy -
 ancient warrior
@warrior_0719 -
 S&P 500 Signals
@SPYSTSignals -
 Markets & Mayhem
@Mayhem4Markets -
 Tom McClellan
@McClellanOsc -
 TRIGGER TRADES
@TriggerTrades -
 Heisenberg
@Mr_Derivatives -
 ProblemSniper
@ProblemSniper -
 dmac
dmac
@dana_marlane -
 David Keller, CMT
@DKellerCMT -
 Gigavest
@Gigavest -
 KAY KIM
@2kaykim -
 Adam Mancini
@AdamMancini4 -
 VolumeLeaders
@VolumeLeaders -
 Gladiator Research Group
@GladsResearch
Something went wrong.
Something went wrong.