
Statition
@statition
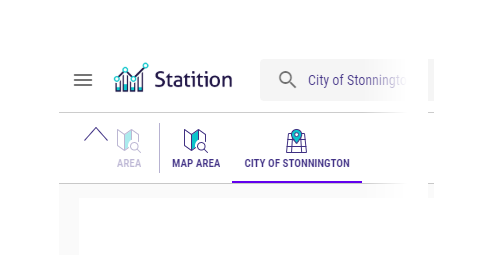
Statition is a statistical analysis app that uses graphs, maps, and reports to tell stories about your area
You might like


We'll soon be adding maps to @statition. As well as having awesome new visuals, you'll be able to pan to any area to see who lives and works there
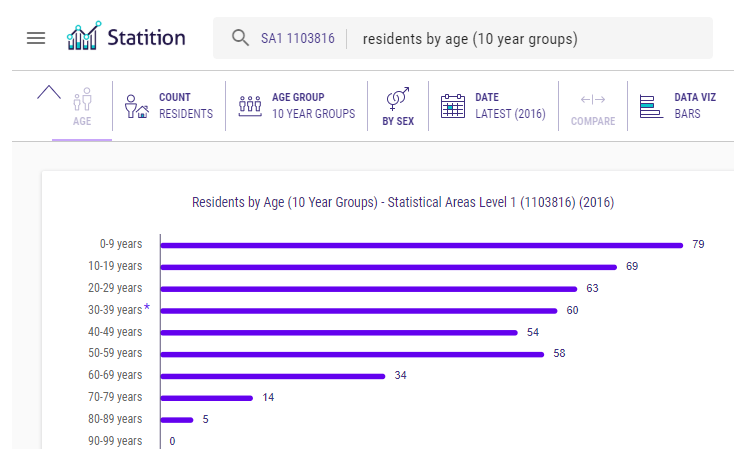
Coming soon: Pan to any area on the map to view the demographic of that area
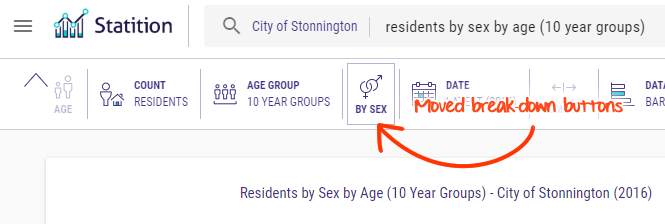
Small change: We're moving the break-down buttons to make them more relevant
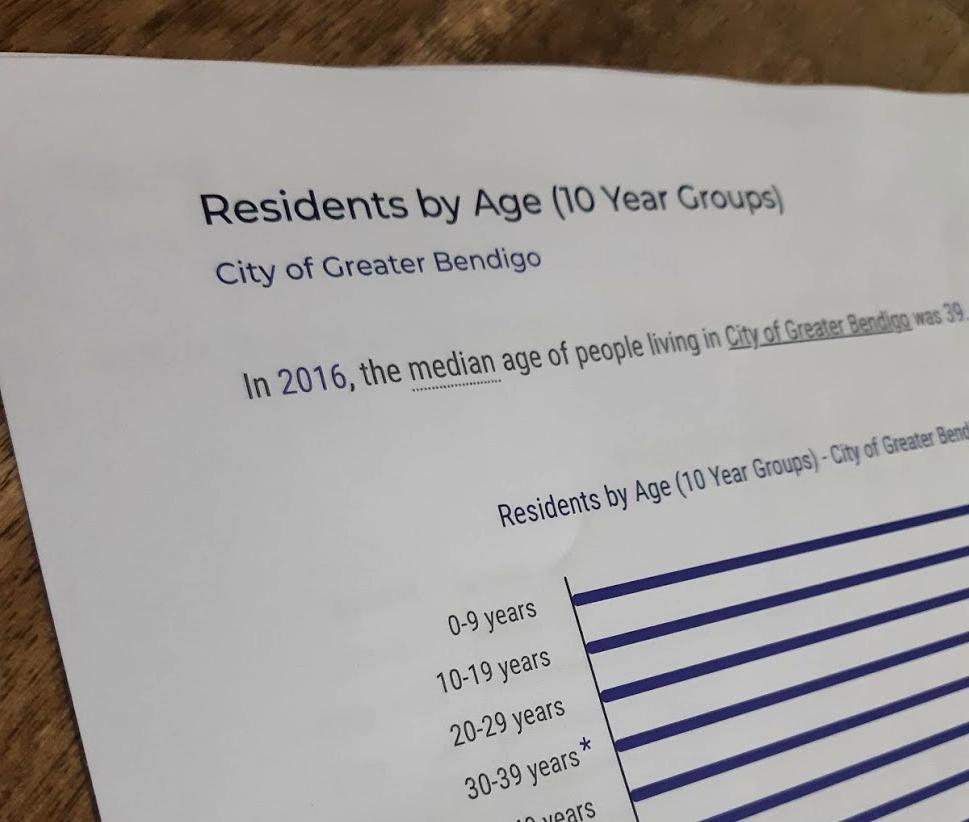
Is there a dataset you'd like to see on @statition? Let us know! 📊#demographics #dataviz
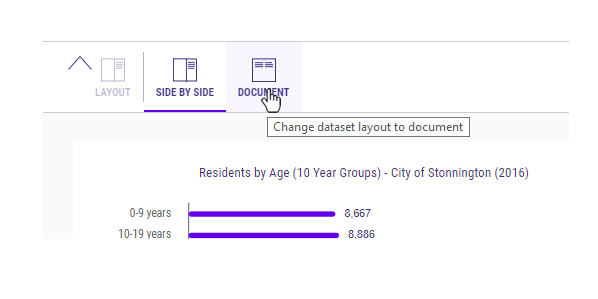
Soon you'll be able to change the layout of datasets to Document mode - ready for print 🖨️
The chart saving feature is working again! 💪 Thank you for your patience
We are aware of a problem with the chart saving feature and are aiming to have it fixed soon! 🙂
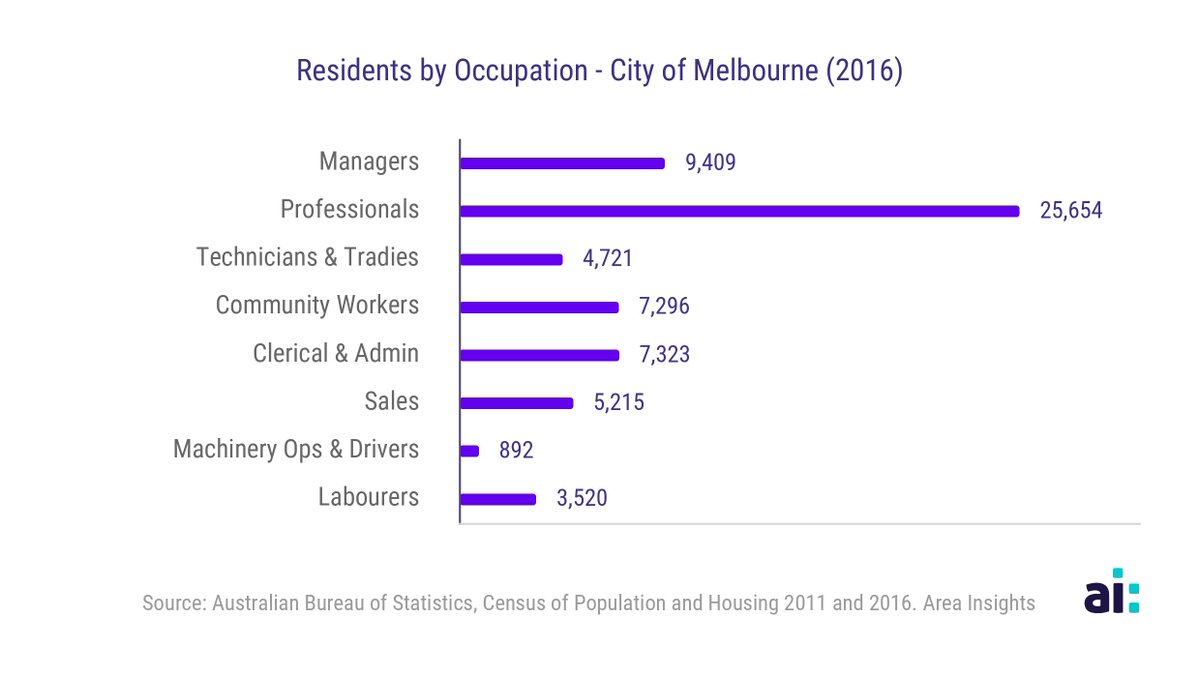
You can now share @Statition charts on social media, like so: statition.com/au/vic/local-g…
We're making improvements to our charts! You'll soon be able to save charts as high-quality images so that they look beautiful in your print reports
Some exciting new features coming this year! Soon you will be able to view an area's working population as well as the resident population
Coming soon to @Statition: charts! 📊 📈📉 What is your favorite chart type?
1 vote · Final results
We're adding data for all LGAs and suburbs. What other geographies would you like to see in @Statition


United States Trends
- 1. Dabo N/A
- 2. Notre Dame N/A
- 3. Jassi N/A
- 4. Wendy N/A
- 5. Rivers N/A
- 6. Stacey N/A
- 7. Lobo N/A
- 8. Blades Brown N/A
- 9. Deion N/A
- 10. March for Life N/A
- 11. Ryan Wedding N/A
- 12. #FursuitFriday N/A
- 13. Jemele N/A
- 14. #TALON N/A
- 15. Nate Oats N/A
- 16. Bad Bunny N/A
- 17. OpTic N/A
- 18. #RepublicanHealthcareDisaster N/A
- 19. Marc Anthony N/A
- 20. Bricillo N/A


Something went wrong.
Something went wrong.