
你可能會喜歡


Consider TechCharts Membership- Weekly Global Equity Reports, breakout alerts, Educational Video - Classic Charting. blog.techcharts.net

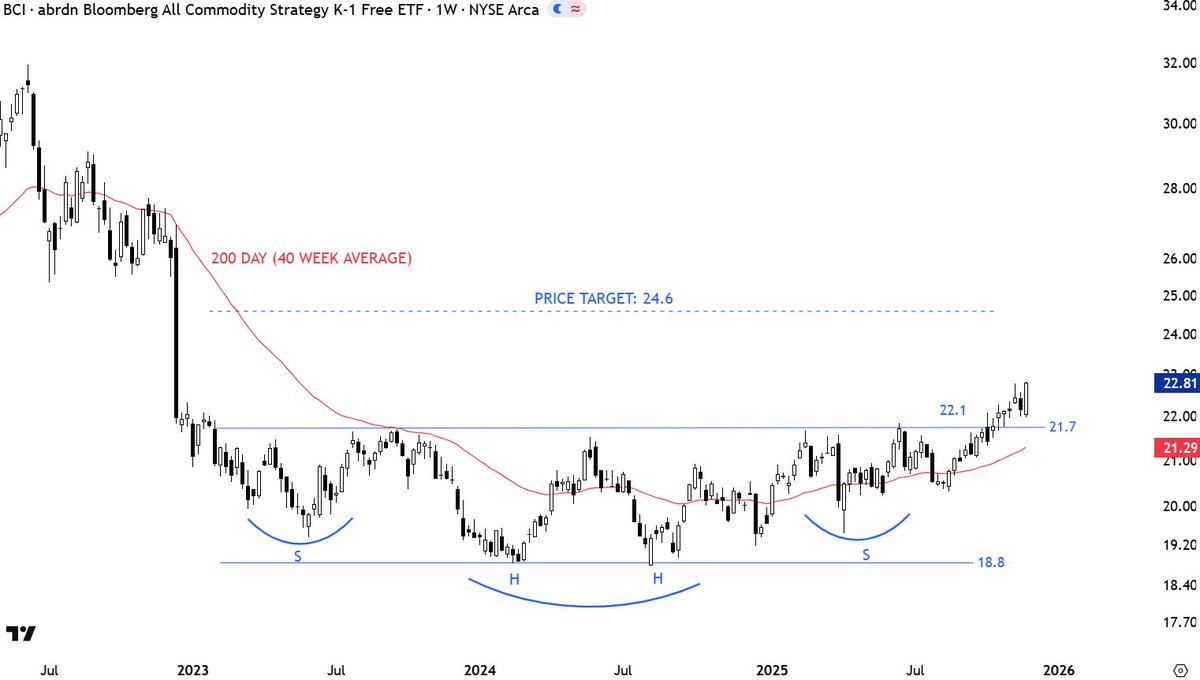

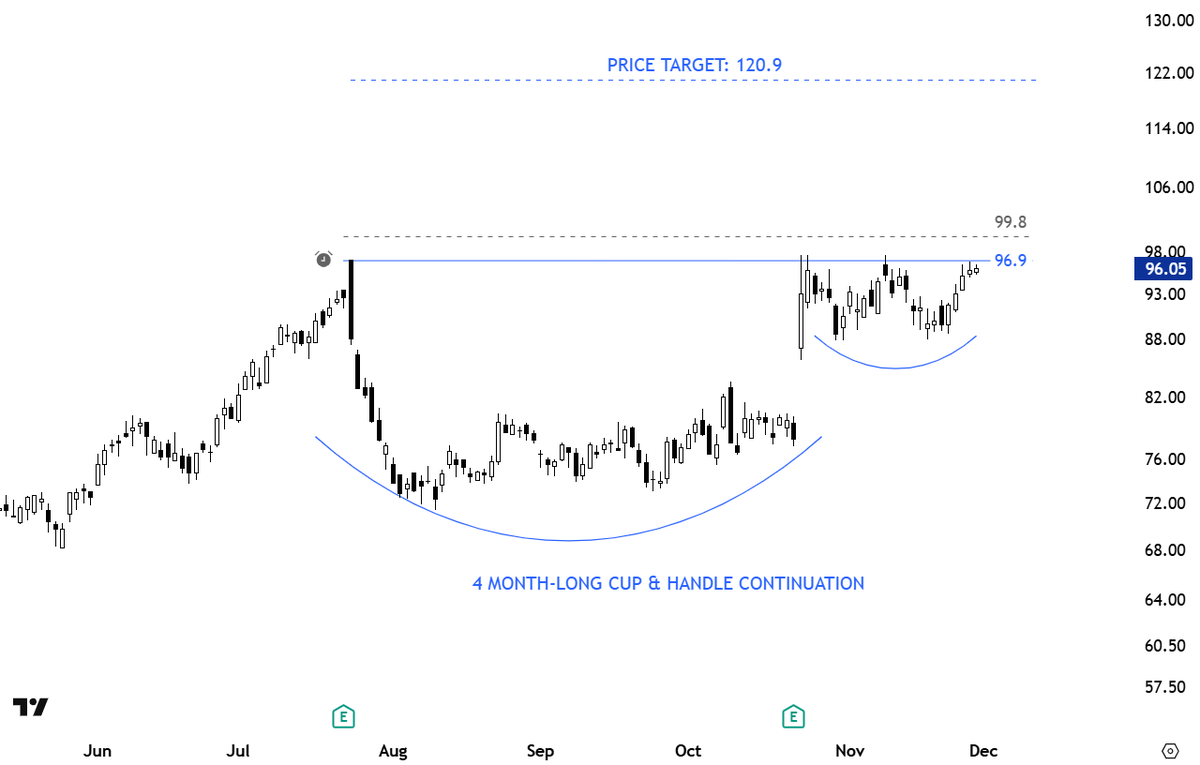
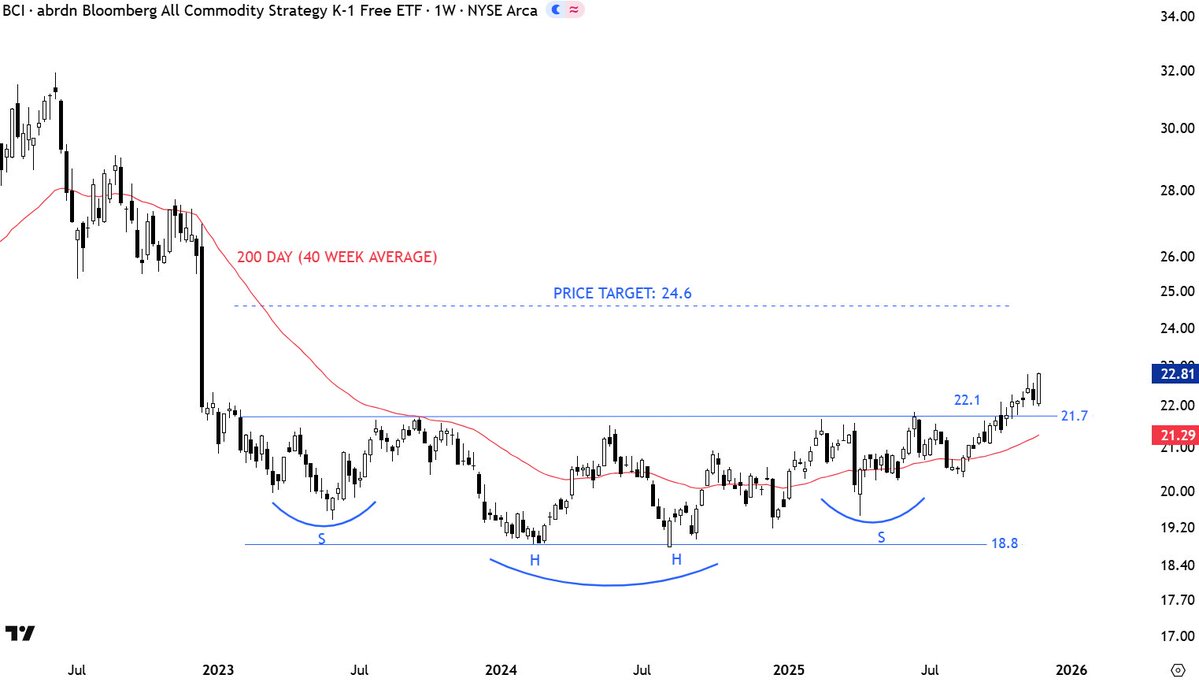
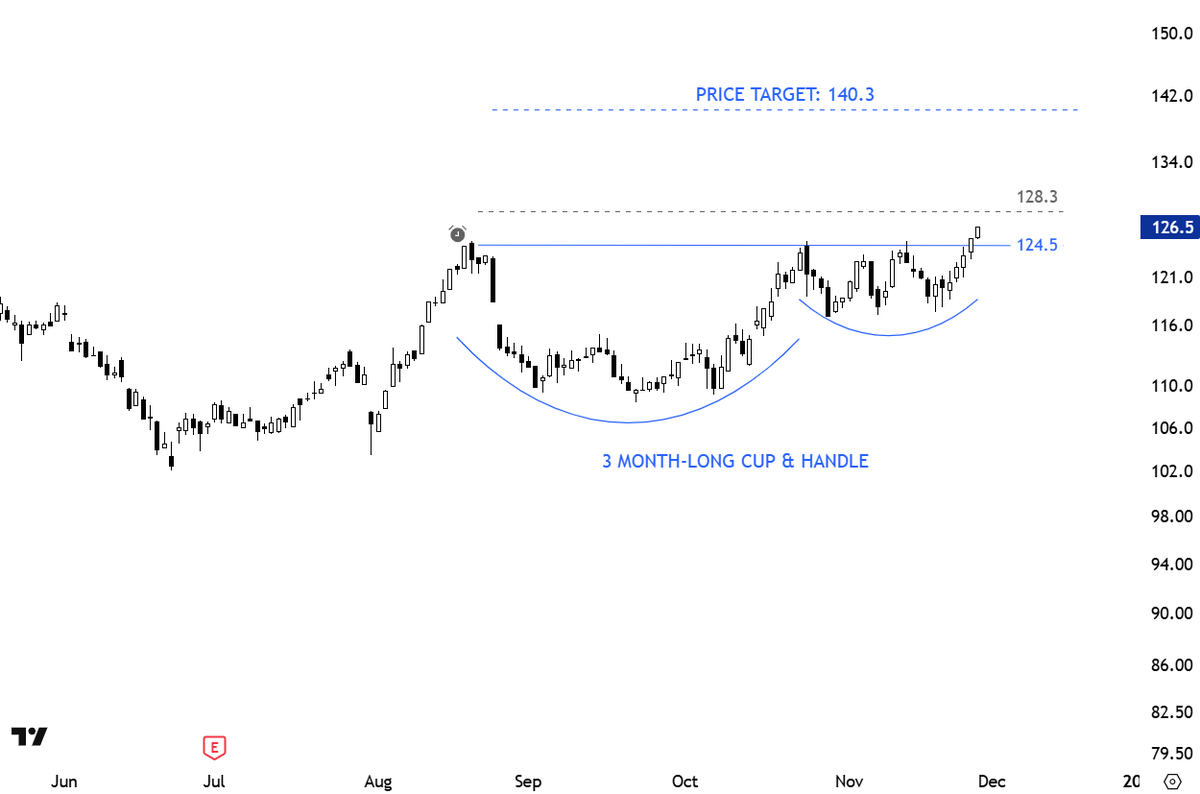
#TECHCHARTSMEMBERS Adding this setup to the upcoming report. Cup & handle. Commodity play. Stay tuned >> blog.techcharts.net
#TECHCHARTSMEMBER I'm adding some really good setups to the upcoming report. Stay tuned >> blog.techcharts.net
#TECHCHARTSMEMBERS #ENERGY stocks are setting up. Next strong move can take place in #ENERGY and #EQUITIES. I covered several setups under #Watchlist Access >> tinyurl.com/ahd4atcu
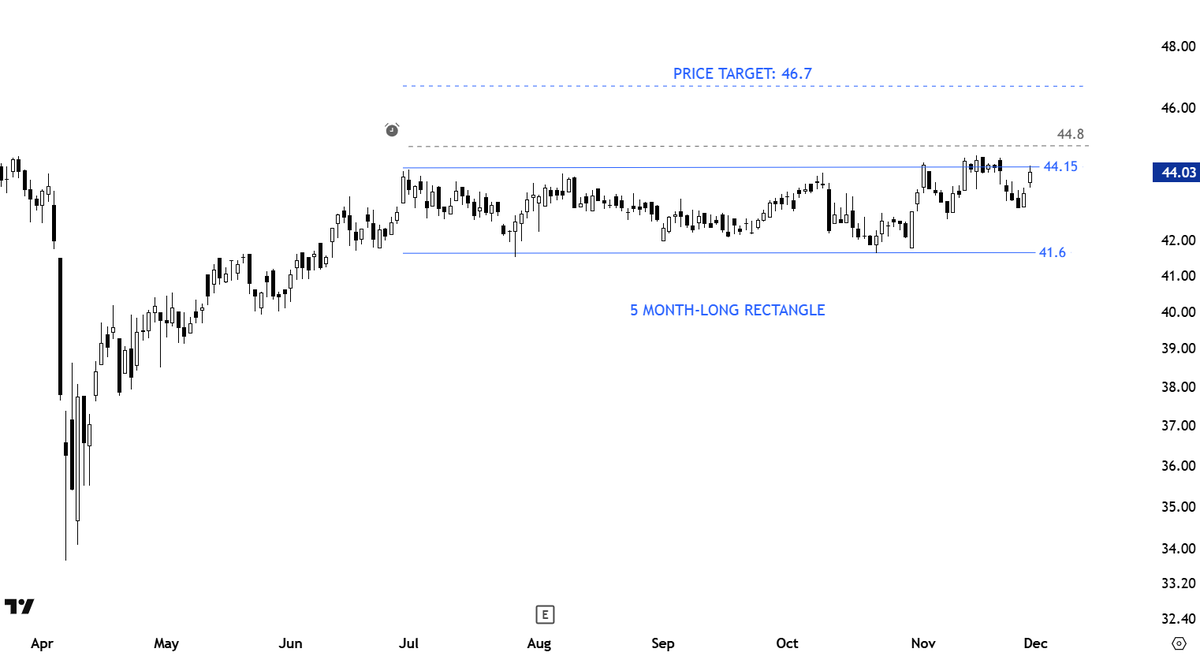
Is there an edge? Common question I get. This is the fundamentals of market price action. Consolidation > Trend > Consolidation and so on... The edge comes from the ability to manage biases and read the chart as is.
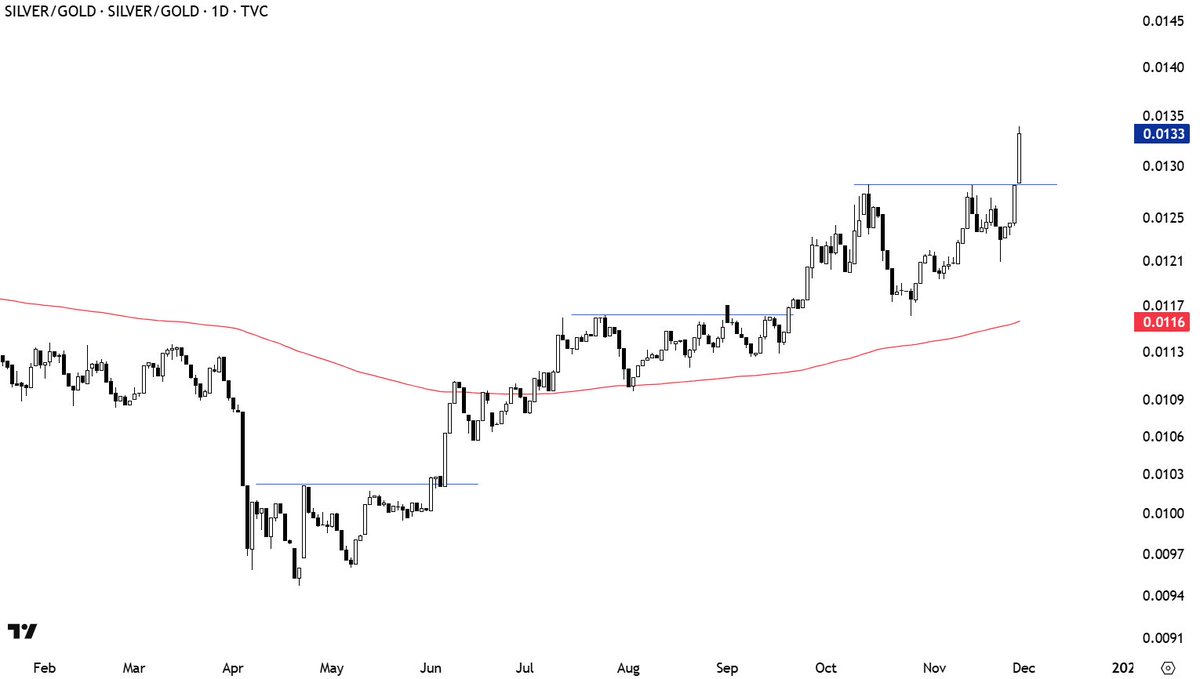
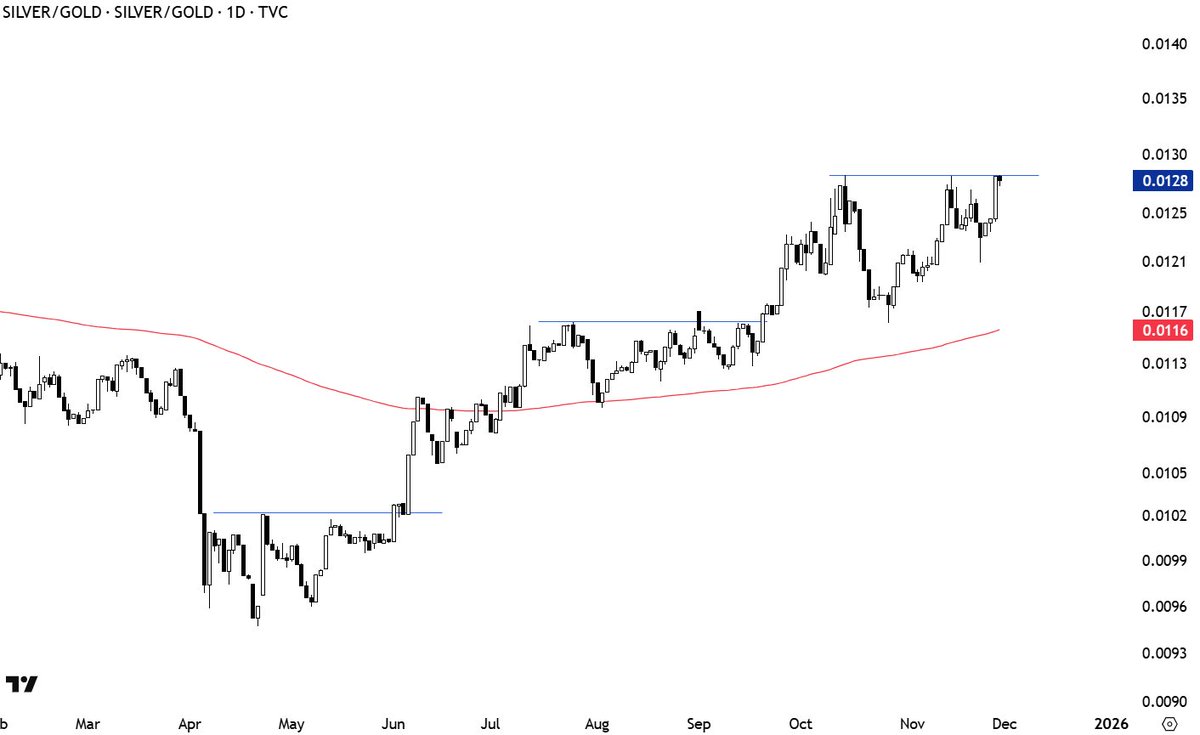
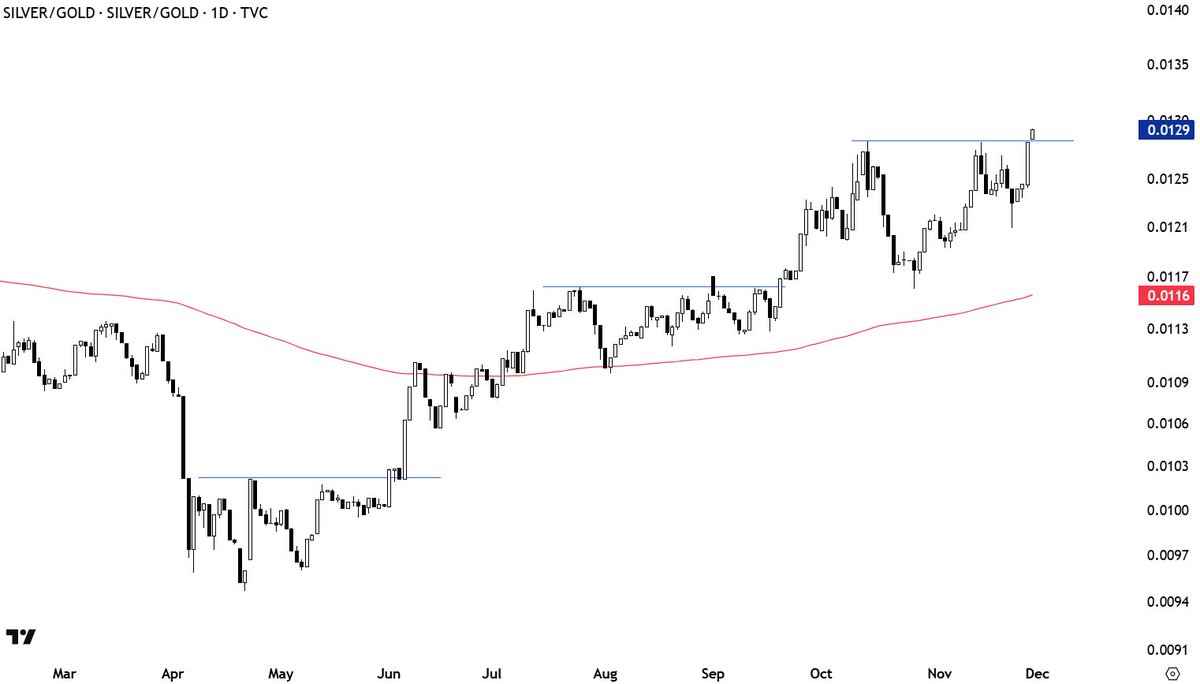
SILVER vs. GOLD might be starting again.
A chart pattern negation level and stop-loss are two different things. While one can use the pattern negation as a wide stop-loss, aggressive risk management for higher reward/risk might require a tight stop-loss placement. ATR Trailing Stop-loss can be helpful in achieving that.
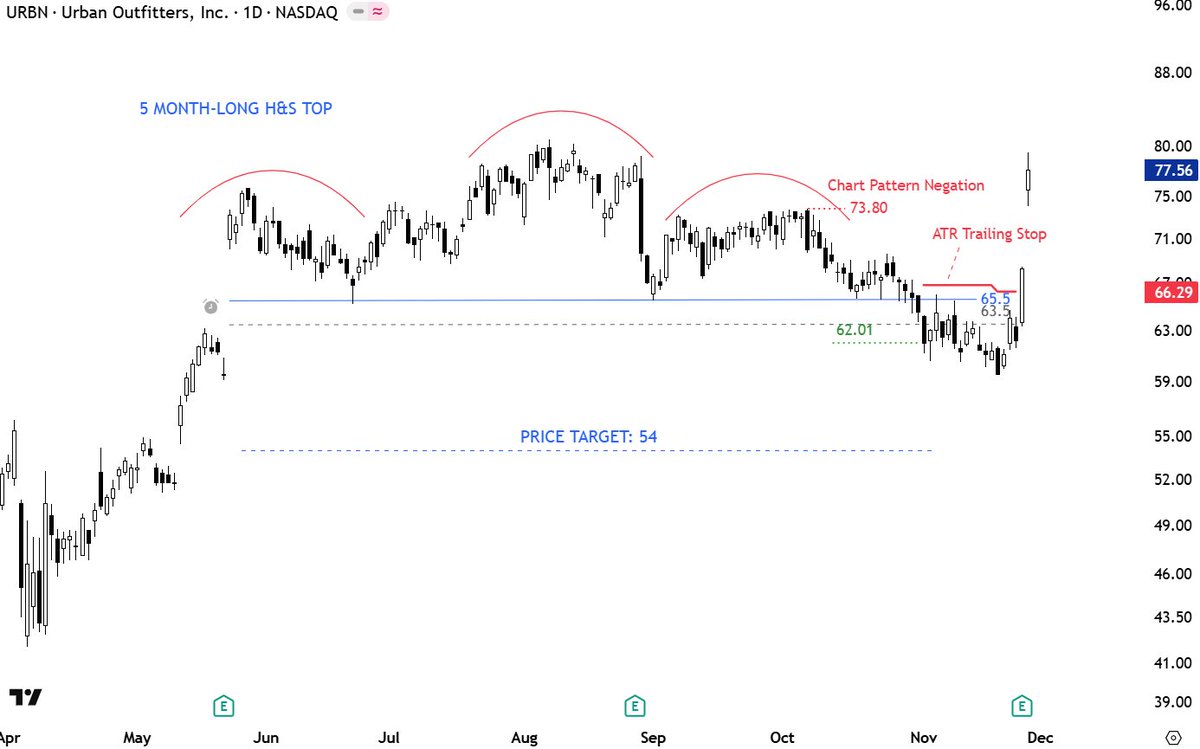
The ATR trailing stop is date and price adjustable (and now long/short adjustable as well). It starts plotting it from your actual entry day and once the intraday price hits the trailing it stops calculating it. This is one of the best tool to ride Type 1 breakouts/breakdowns…
There is now an updated version for the ATR Trailing Stop which allows for trend direction selection. With short setups you can apply trailing stop on short trades. With long setups you can select long and trail long positions. Latest #BLOG #POST 👇 blog.techcharts.net/index.php/2025…
If you are interested to learn more about what I share with our #premium #members 👇👇👇 blog.techcharts.net/index.php/free… Get a feel and MOST important SUBSCRIBE specifically this week to receive one of my favorite setup...

There is now an updated version for the ATR Trailing Stop which allows for trend direction selection. With short setups you can apply trailing stop on short trades. With long setups you can select long and trail long positions. Latest #BLOG #POST 👇 blog.techcharts.net/index.php/2025…
There is now an updated version for the ATR Trailing Stop which allows for trend direction selection. With short setups you can apply trailing stop on short trades. With long setups you can select long and trail long positions. Latest #BLOG #POST 👇 blog.techcharts.net/index.php/2025…
Given that it is Thanksgiving, I would like to thank everyone for the inspiration, the drive to work harder, suggestions and feedbacks. We are growing in our journey together. So here is something I put together after several questions on ATR Trailing Stop Trading View Pine…
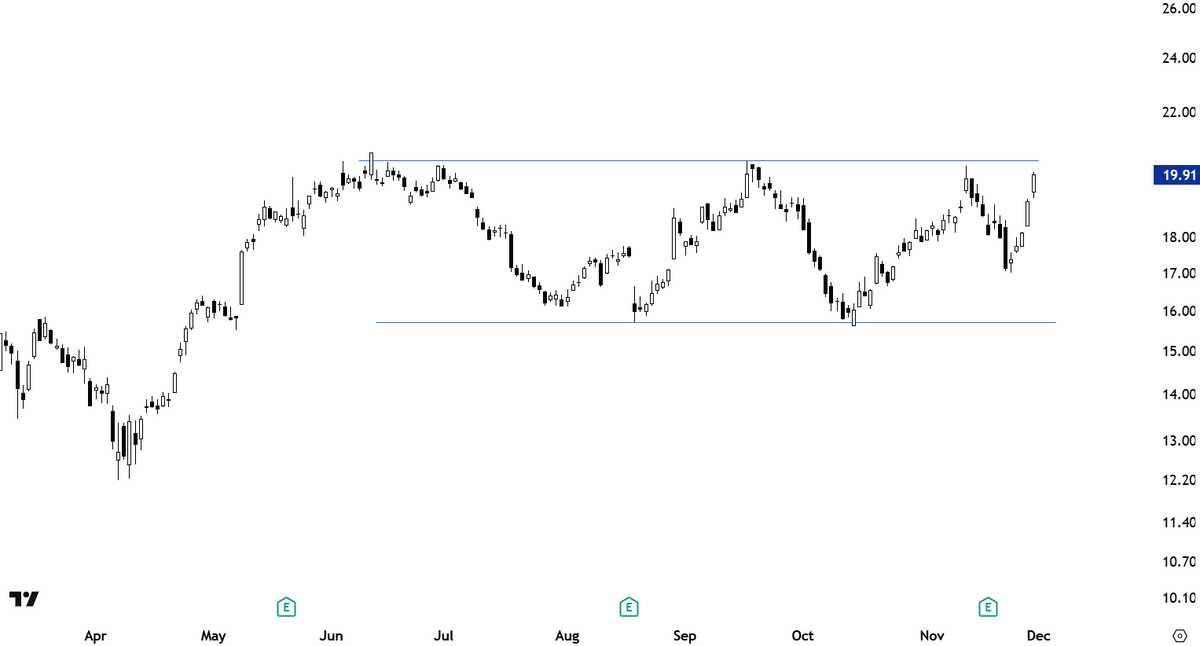
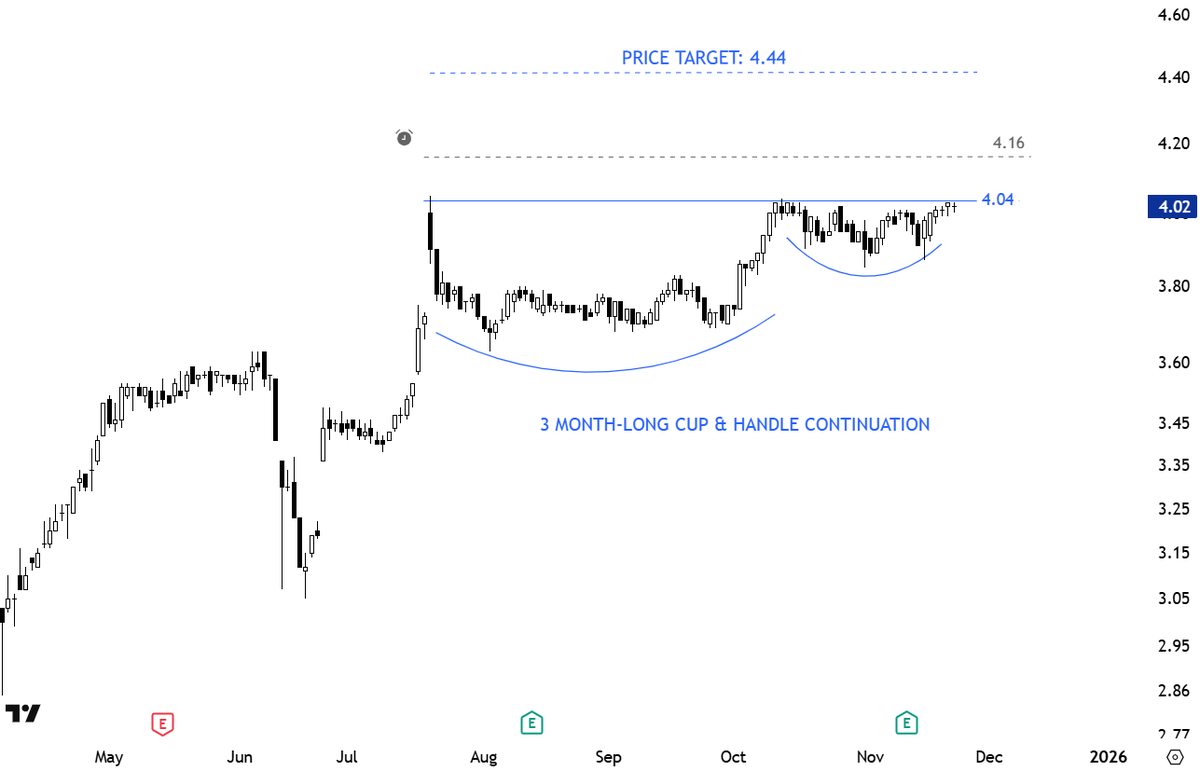
A similar setup from #EUROPE #EQUITIES Possible cup & handle continuation #TECHCHARTSMEMBERS Access >> tinyurl.com/dmnau7d9
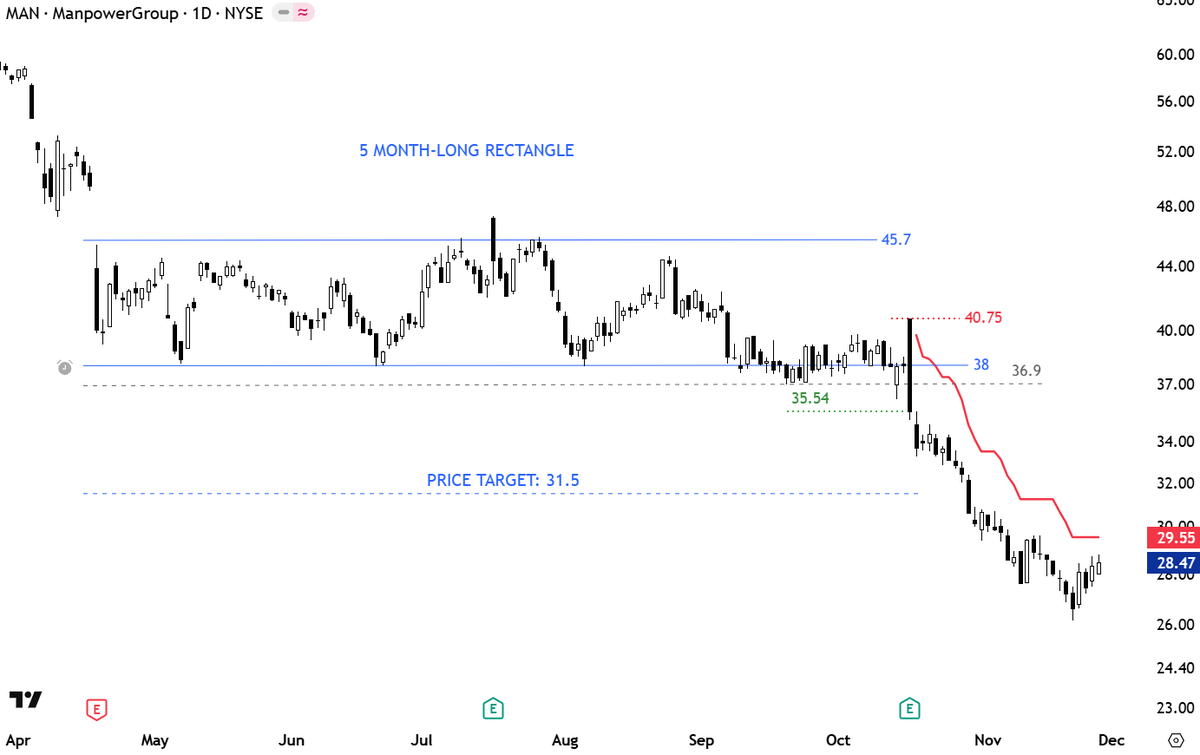
A stock that I have traded in large quantities in MENA fund management days. Stocks in MENA have a tendency to form strong trends with breakouts. I have covered this in the latest #watchlist. Now a breakout alert. If it becomes a Type 1, my advice it to trail it with an ATR…

A stock that I have traded in large quantities in MENA fund management days. Stocks in MENA have a tendency to form strong trends with breakouts. I have covered this in the latest #watchlist. Now a breakout alert. If it becomes a Type 1, my advice it to trail it with an ATR…
Cup & handle is a bullish continuation chart pattern. Price after making a low and deep correction, forms a higher low (the handle) and prepares for a breakout. Higher low shows buyer's willingness to bid the price higher and not wait for previous low. More on this opportunity…


United States 趨勢
- 1. Texas 145K posts
- 2. #HookEm 8,930 posts
- 3. Austin Reaves 6,603 posts
- 4. Arch Manning 6,232 posts
- 5. 3-8 Florida 1,396 posts
- 6. Jeff Sims 1,459 posts
- 7. Aggies 8,348 posts
- 8. Marcel Reed 4,111 posts
- 9. Sark 4,248 posts
- 10. #LakeShow 2,306 posts
- 11. Arizona 31.1K posts
- 12. SEC Championship 4,630 posts
- 13. Devin Vassell 1,837 posts
- 14. #OPLive 2,333 posts
- 15. #iufb 3,334 posts
- 16. Elko 2,378 posts
- 17. #SmackDown 16.2K posts
- 18. Ole Miss 24.8K posts
- 19. Ryan Nembhard N/A
- 20. Bears 133K posts
你可能會喜歡
-
 Peter Brandt
@PeterLBrandt -
 Raoul Pal
@RaoulGMI -
 DonAlt
@CryptoDonAlt -
 Willy Woo
@woonomic -
 RookieXBT 🧲
@RookieXBT -
 Mark Minervini
@markminervini -
 Patrick Walker
@PatrickWalker56 -
 Trading Composure
@TradingComposur -
 jack schwager
@jackschwager -
 Linda Raschke
@LindaRaschke -
 Mark Newton CMT
@MarkNewtonCMT -
 Bob Loukas 🗽
@BobLoukas -
 Colibri Trader (a.k.a. Atanas)
@priceinaction -
 Rayner Teo
@Rayner_Teo -
 Bluntz
@Bluntz_Capital
Something went wrong.
Something went wrong.