Dit vind je misschien leuk


Few signals have correlated with #Bitcoin's macro inflections as tightly as China's 10-year yield. Local tops at major $BTC impulse tops. Local CN10Y downtrend breaking with 3W RSI exceeding 50... Began each of #Bitcoin's last 3 largest moves.


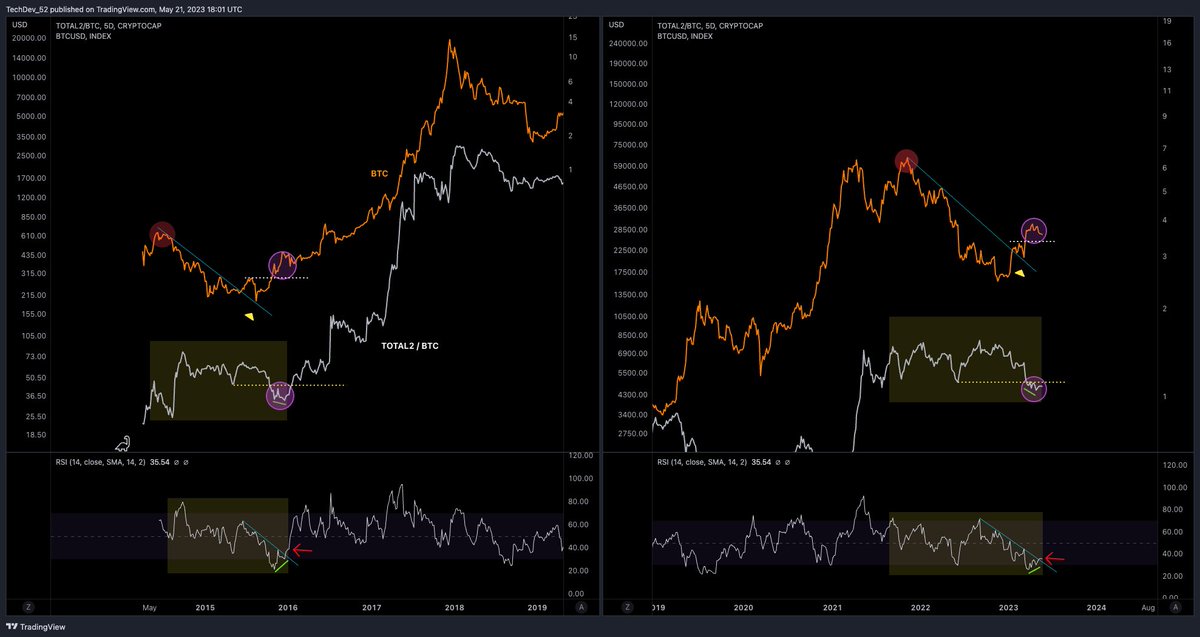
It’s not just #Bitcoin which suggests an early parabolic move. #Altcoin cap / $BTC appears at an inflection point.
Expanded flats are brutal. The market obliterates both sides before macro continuation.

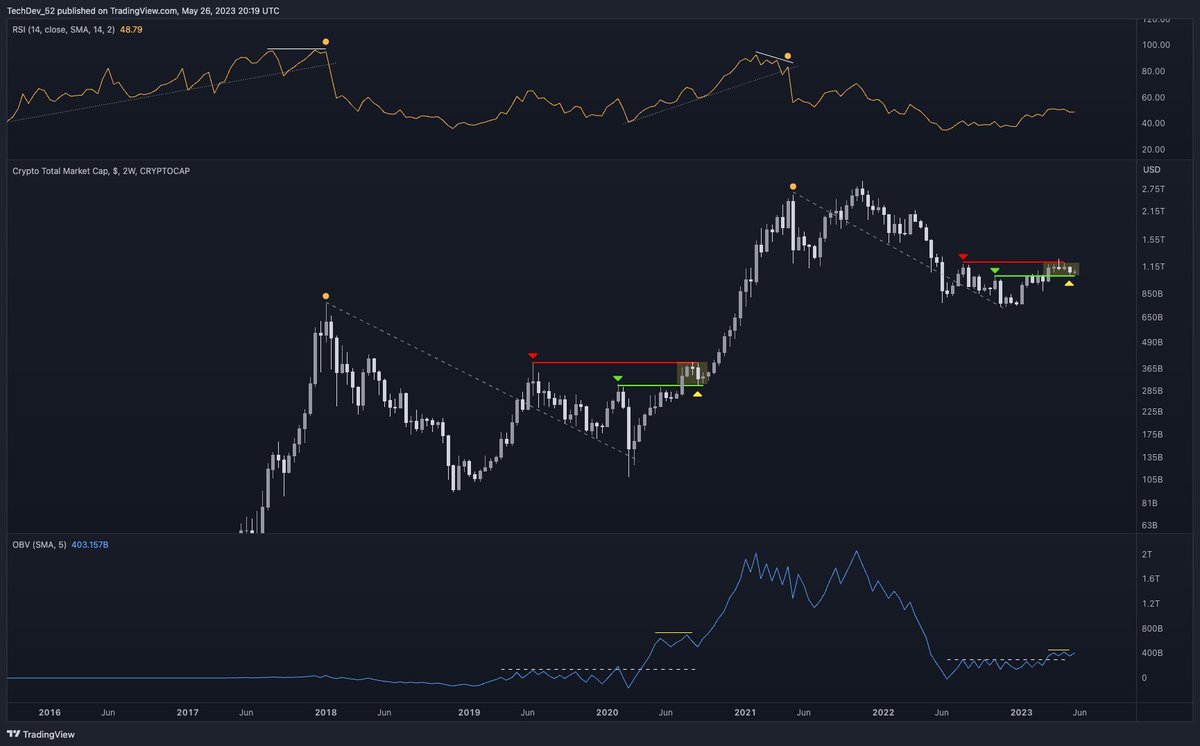
Bband statement applies to $TOTAL
Most didn’t expect a parabolic move at the last 20/200W EMA cross either. Weekly Bollinger bands haven’t been tighter since. (Except late 2016).

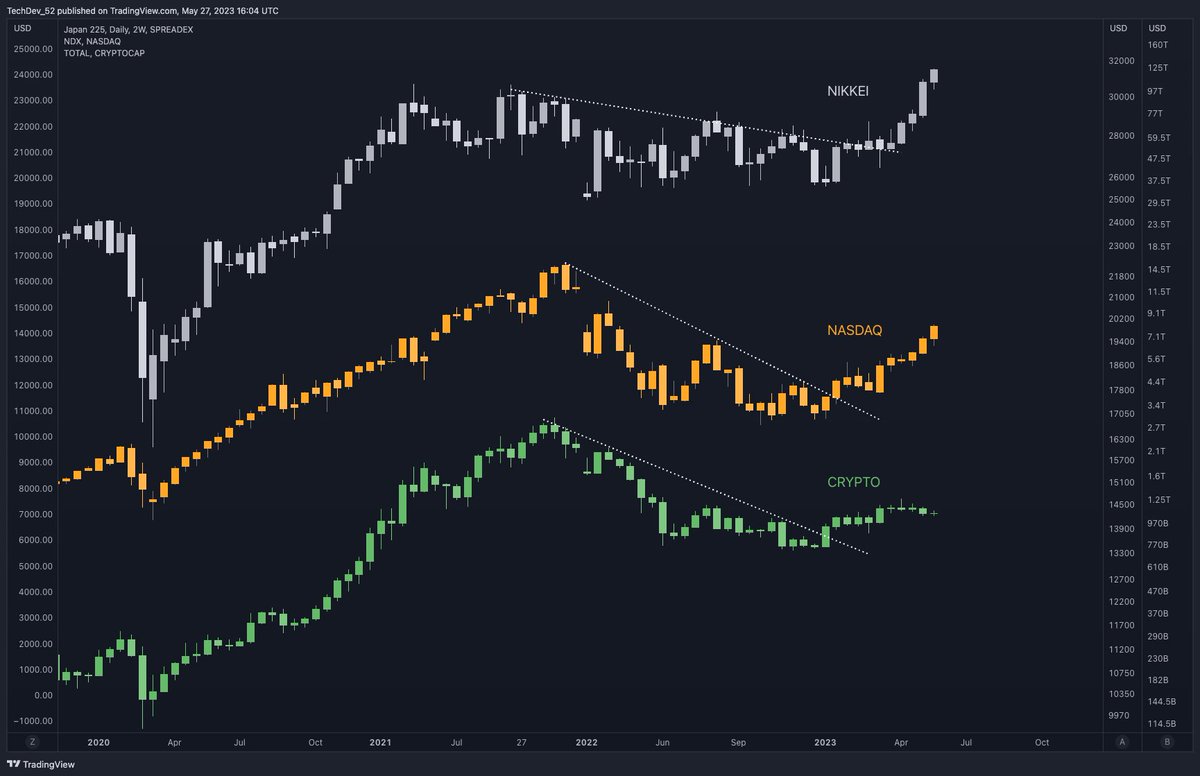
Crypto and NASDAQ to follow Nikkei to new highs imo.

Really interesting to observe the takes. Some see it as bearish on crypto (recently outperformed). Others see crypto’s fortune being told and an upcoming rotation.
NIKKEI > NASDAQ > Crypto ?
It's different than 2020. And I think it's a different impulse wave.
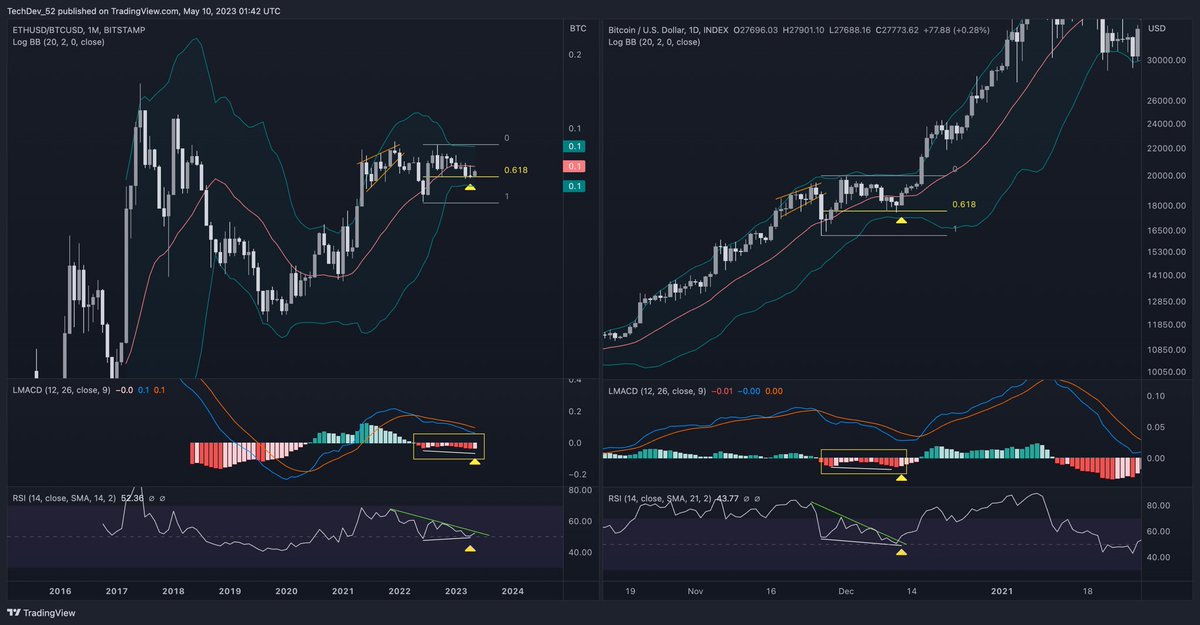
$ETHBTC is in a 16-month flat correction (see $BTC Nov-Dec 2020). Monthly Bollinger bands are as tight as they've ever been. Any idea what happens to alts when this completes?
Eyes on $ETHBTC. Update this week.
Entire #altcoin market is 560 billion. NVIDIA added 220 billion in 16 hours. But “where will the money come from”?
Keep hearing "how can we reach new ATH before the end of the year? It's impossible." About where I think we are now compared to our last impulse. Note that the S/R flip and retest at 10k took about 3 months to complete. 2 months later we had rallied 90% to new all time highs.…

Still not primary timeline idea. Just an interesting observation for folks who prefer to look at Bitcoin in “cycles” of pointy tops. Primary time-based idea below. Covered in issue # 18 with supporting evidence. Pub link in bio.

#Bitcoin on adjusted log time. Time = log(weeks)^3.44 10.2 log periods elapsed between each touch of top curve. Next set meets curve at 160-180K December 2023. Not a forecast. Not a prediction. Not even my primary idea. Just an observation based on a sample size of 2.
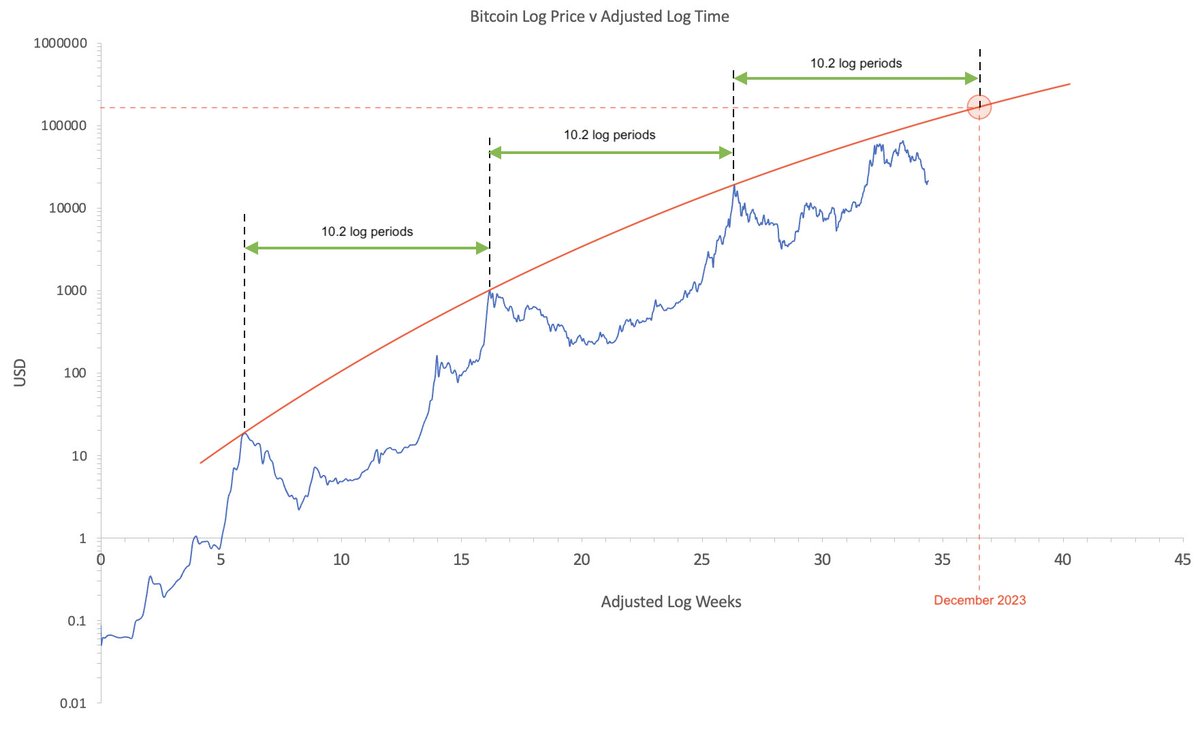
Update: #Bitcoin on adjusted log time Time = log(weeks)^3.44 Next period meets curve at 160-180K December 2023. Observation based on a sample of 2.

Weekly #crypto cap Bbands haven’t been this tight with price above center since October 2016.
This week I also reviewed the state of CN10Y/DXY and what it needs to show in the next few 3W candles. Sub link in bio.


United States Trends
- 1. #IDontWantToOverreactBUT N/A
- 2. Howie 7,649 posts
- 3. #MondayMotivation 35.3K posts
- 4. Hobi 51.1K posts
- 5. Phillips 503K posts
- 6. Winthrop 1,524 posts
- 7. Victory Monday 2,773 posts
- 8. Good Monday 50.4K posts
- 9. $IREN 15.7K posts
- 10. #MondayVibes 3,083 posts
- 11. 60 Minutes 117K posts
- 12. #maddiekowalski N/A
- 13. #Talus_Labs N/A
- 14. Kimberly-Clark 1,789 posts
- 15. Happy Birthday Kim N/A
- 16. $QURE 2,045 posts
- 17. Tomorrow is Election Day N/A
- 18. Kenvue 2,568 posts
- 19. Queens 38.6K posts
- 20. $CIFR 8,534 posts
Dit vind je misschien leuk
-
 Paloma Ford
@palomaford -
 exq=.s.te =n.c&de/s
@crashtxt -
 Team DLH
@TeamDLH -
 Dj Lashay
@MICHELLEgotBARS -
 JasonMartin
@PROBLEM354 -
 🇭🇹tachaaaaa🇭🇹
@tachadoll_ -
 DJ LAZY K
@DJLAZYK -
 DarKnighT EnT
@DARKNIGHTENT -
 smitty
@Smitty -
 Sound Alive Records
@Sound_Alive_Rec -
 Pure Fire®
@PureFireBeatz -
 Eddie Grand Is Here!
@eddiegrandnj
Something went wrong.
Something went wrong.