
你可能會喜歡


For us, AI doesn’t replace creativity. It amplifies it. Curious to learn how our team uses machine learning as an ally to push the boundaries of data storytelling? 🤖 Join our webinar on November 20 to see how we’re integrating AI into every stage of our creative process. Plus,…


Which university has had the most alumni become entrepreneurs in the last decade? Hint: its not Stanford or Harvard 🎓 This Markets in a Minute visualization, created in partnership with @TerzoHQ, explores which institutions are fueling the next generation of innovation through…
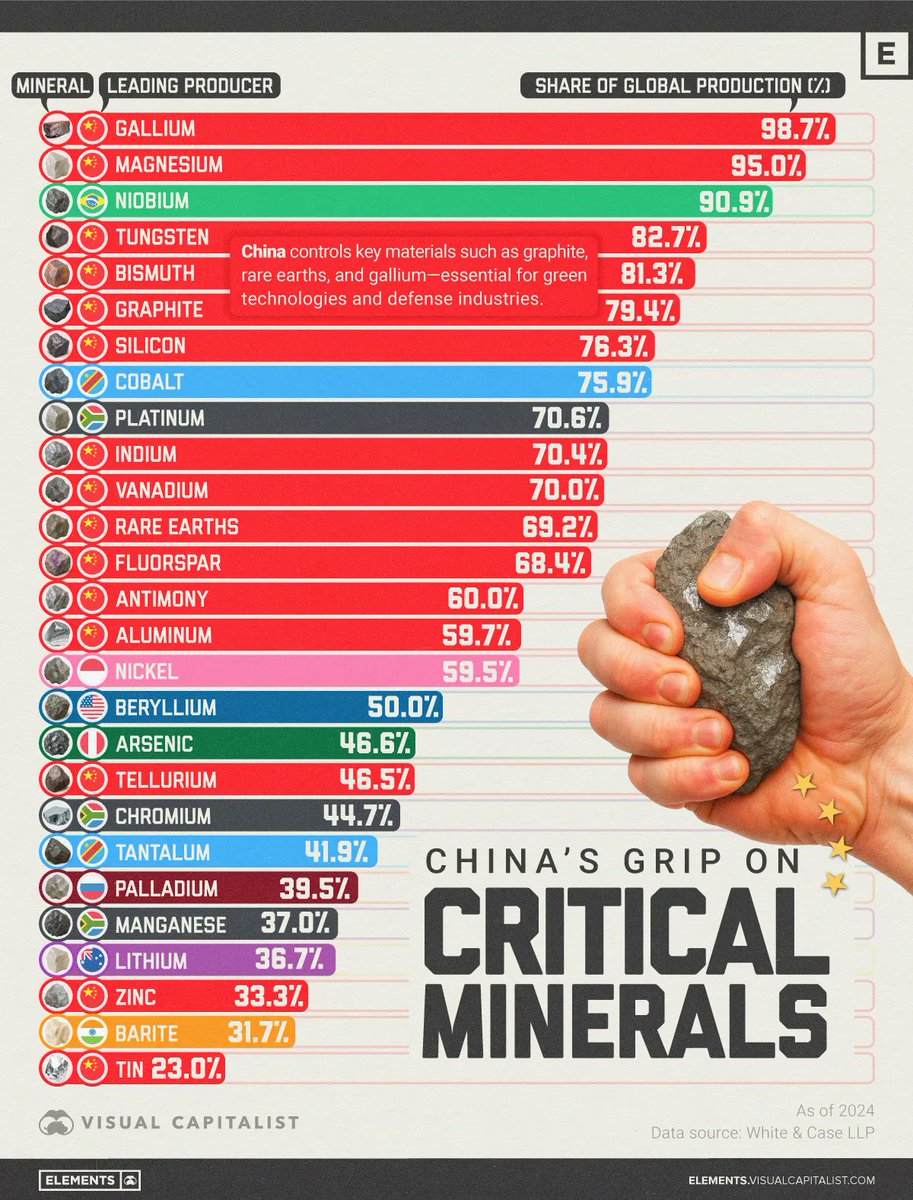
How Much Control China Has Over the World’s Critical Minerals 🪨 From @VCElements—bridging the gap between global trends shaping our future, and the raw materials powering them ⚡️ elements.visualcapitalist.com/how-much-contr…
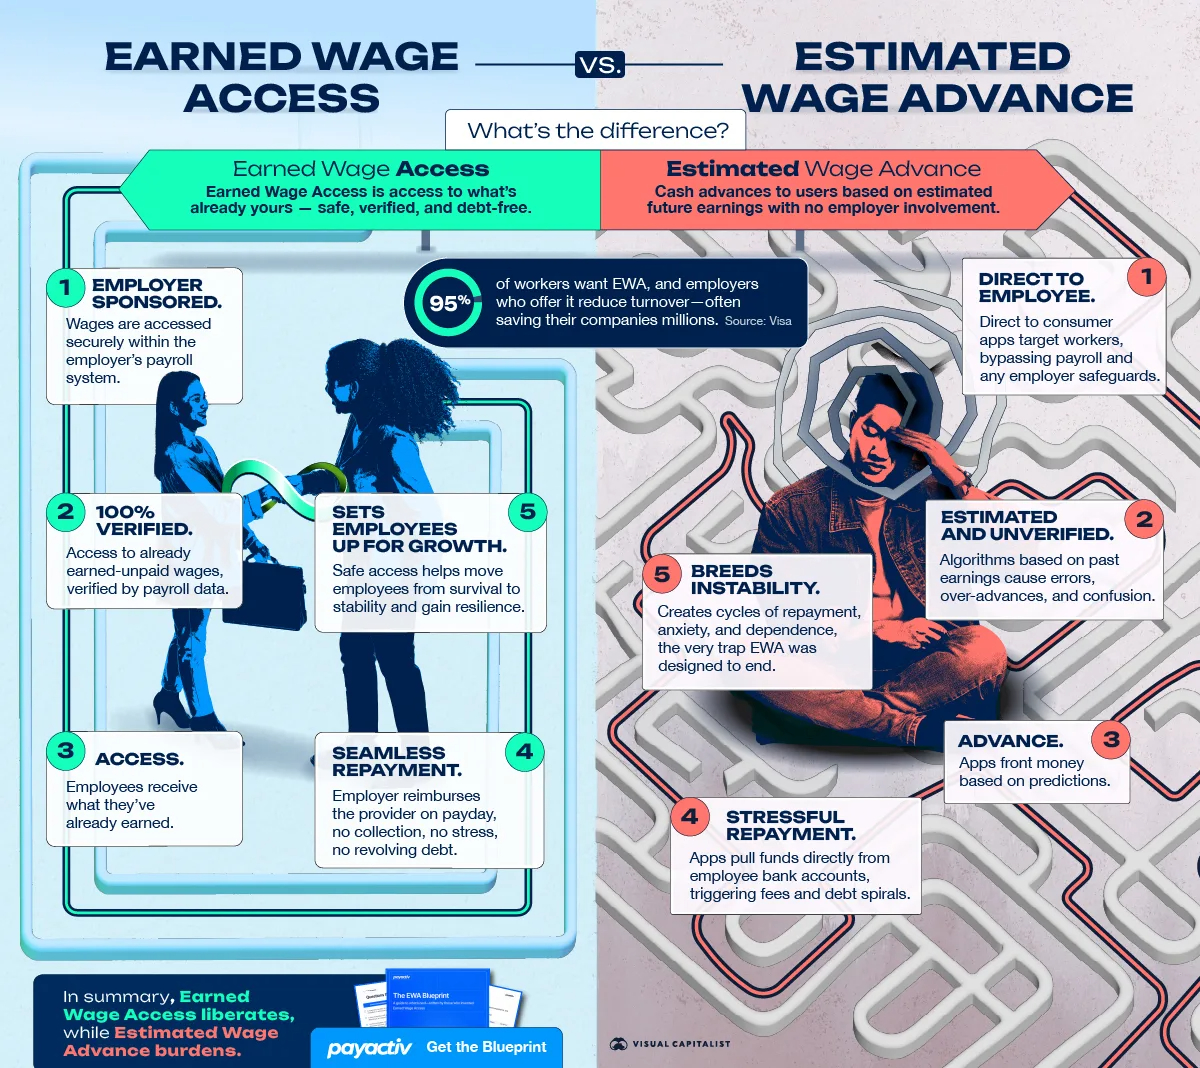
Earned wage access vs estimated advances: find out how verified, employer-sponsored access avoids debt and improves retention 💵 This graphic, created in partnership with @Payactiv, contrasts employer-integrated access to already-earned pay with direct-to-consumer estimated…

From production growth to cost comparisons and future output, these visuals show how OH, WV, and PA stack up across key natural gas metrics. 📊 Explore the full series, created with partner @ShaleCresUSA, for data on regional gas availability, access to buyers, and existing…

Flashback Favorite 🔙 Mapped: Retirement-Age Workers by U.S. State 💼 From the Archive: visualcapitalist.com/mapped-retirem…


As retiree numbers climb and workforces shrink, which countries are seeing workers support the most seniors? 👴 This Markets in a Minute visualization, created in partnership with @TerzoHQ, ranks countries by their old-age dependency ratio in 2024. visualcapitalist.com/sp/ter01-mappe……

Visual of the Week 🥇 Europe has 7 of the 10 wealthiest nations, driven by small populations and strong welfare. Liechtenstein leads worldwide with a $231.7K GDP per capita, boosted by a workforce that's 60% commuters 💰 visualcapitalist.com/ranked-the-wor…

Visualizing 30 Years of Rare Earth Production, by Country 📈 Exclusive data from our partner @benchmarkmin reveals the shifts in mine production from 1994 to 2024—via @VCElements. elements.visualcapitalist.com/visualizing-30…

With 481 km² in Canada’s top gold district, Maple Gold is positioned at the center of a major opportunity ⛏️ Here, we've partnered with @MapleGoldMines, to illustrate how rising gold prices, active consolidation, and high-quality Abitibi assets are converging to create a unique…


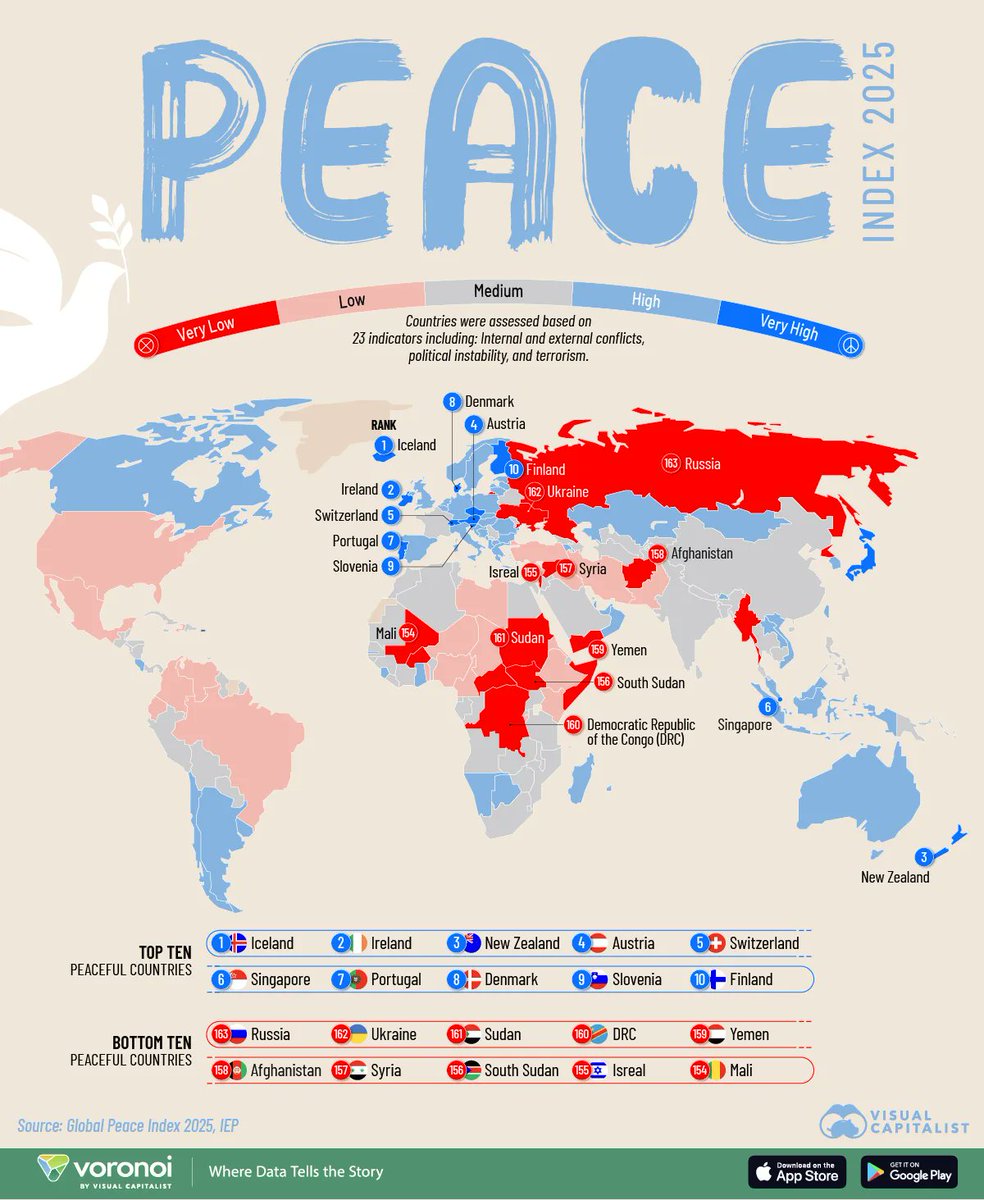
Mapped: The World’s Safest (and Least Safe) Countries in 2025 🕊️ visualcapitalist.com/worlds-safest-…

Charted: Tracking the Decline in Oil Spills from Tankers (1970-2024) 🛢️ This graphic by @OurWorldInData is one of the many incredible data-driven charts and stories from creators featured on our @VoronoiApp. ✅ voronoiapp.com/climate/Oil-sp…


United States 趨勢
- 1. Clay Higgins 24.2K posts
- 2. Scotland 77.1K posts
- 3. Grisham 4,141 posts
- 4. Peggy 7,145 posts
- 5. Cashman 1,204 posts
- 6. Saudi 258K posts
- 7. Dominguez 3,264 posts
- 8. Bellinger 2,576 posts
- 9. Nicki 128K posts
- 10. Mary Bruce 6,013 posts
- 11. #UNBarbie 16.5K posts
- 12. Gemini 3 52.1K posts
- 13. Khashoggi 56.4K posts
- 14. Tierney 12.6K posts
- 15. The House 559K posts
- 16. Dearborn 54.5K posts
- 17. Shota 9,848 posts
- 18. Gleyber Torres 1,542 posts
- 19. Woodruff 1,459 posts
- 20. Sedition 6,594 posts
你可能會喜歡
-
 World of Statistics
@stats_feed -
 Naval
Naval
@naval -
 Elements
@VCElements -
 Prof. Feynman
@ProfFeynman -
 Compounding Quality
@QCompounding -
 Ray Dalio
@RayDalio -
 James Clear
@JamesClear -
 Howard Marks
@HowardMarksBook -
 Yardeni Research
@yardeni -
 Our World in Data
@OurWorldInData -
 (((The Daily Shot)))
@SoberLook -
 Steve Hanke
@steve_hanke -
 Aswath Damodaran
@AswathDamodaran -
 Long Equity
@long_equity -
 Statista
@StatistaCharts
Something went wrong.
Something went wrong.