
Darkhorse Analytics
@dhanalytics
We use data and visualization to help clients make and communicate decisions.
You might like


Love amazing maps? Here's our Top 5 Maps after coming across thousands of visualizations! #maps #dataviz youtu.be/5_n9K4WEal4
Proud to share that the @EconomicPolicy Data Library has won an Anthem Award for DEI: Best Use of Data. A single, rigorous, accessible source for decades of economic research — built with the Economic Policy Institute. Explore → hubs.la/Q03TR0cW0
Our latest piece unpacks three policy moments where visualization could have shifted the outcome; showing exactly what to do differently when your research needs to land in policy development, not just in peer review. Read more here: hubs.la/Q03S5nwD0

Today marks a big moment: Darkhorse Analytics is now Darkhorse Visualization. Same team, same values, same rigour. New name, new look, sharper focus: Make data clear, compelling, and impossible to ignore. 🔗 hubs.la/Q03PB22h0
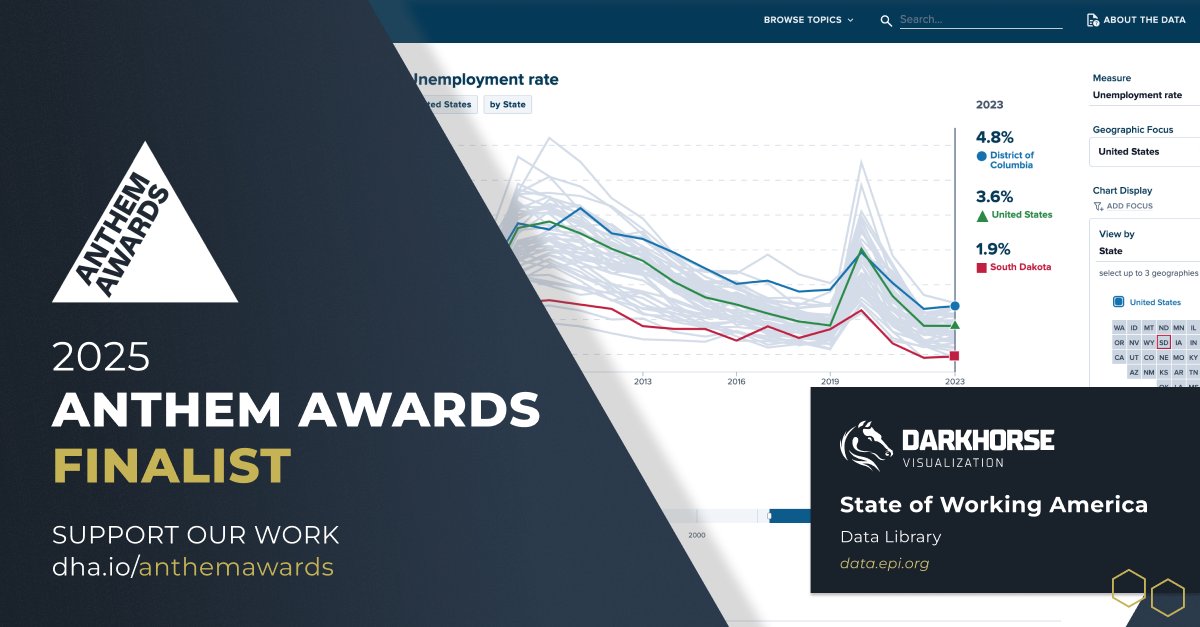
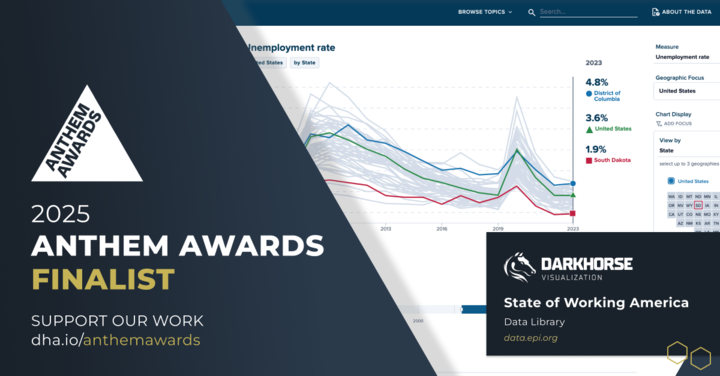
We’re proud to share that our EPI Data Library is a finalist in the Diversity, Equity, Inclusion & Belonging Awareness category at the 5th Annual #AnthemAwards. 🗳️ Vote by Oct 30: hubs.la/Q03PcLwP0
If you’re a PI, NGO lead, or program director, your challenge isn’t just collecting data—it’s making it matter. Join Darkhorse Academy: a free 6-part masterclass on turning research into real-world impact. Limited seats → hubs.la/Q03xYyGx0
We’ve designed award-winning visualizations for public safety, health & policy. Our secret? Strip away the clutter. Join our free webinar: Data Looks Better Naked Timeless design tips and tactics you can use tomorrow. 🎟 Save your seat → hubs.la/Q03pSBKN0
The Care Board reveals the true value of care: paid & unpaid, formal & informal. In partnership with @UnivOfKansas, we built a dashboard that makes care data clear, intuitive, and powerful. Explore who gives care, who gets care, and what it’s worth: hubs.la/Q03f_cM40

Darkhorse worked closely with Lumina Foundation to design a more intuitive, interactive, and impactful data experience—one that makes insights easier to explore, compare, and share. Read more: hubs.la/Q0390D1t0
Responsive, intuitive, thoughtful and accessible design is at the core of how we help organizations focused on social impact drive awareness, influence policy, and inspire change. Here's 5 ways we tackled that in our latest project: hubs.ly/Q035lHvs0
Are you a principal investigator, NGO leader, or researcher seeking to enhance the reach and impact of your research or message? Register for our two-day intensive workshop to unlock the power of data communication for your research: hubs.la/Q02ZWwWs0
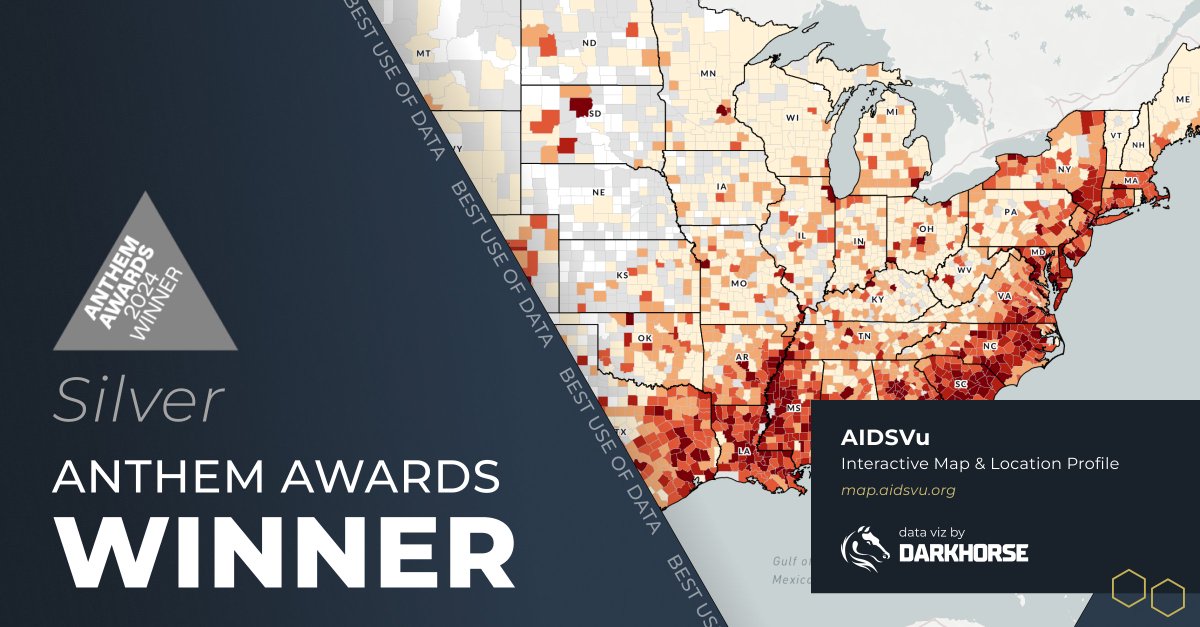
Darkhorse Analytics is proud to announce that AIDSVu Interactive Map & Location Profiles has been named a Silver Anthem Awards winner. AIDSVu combines public health data and intuitive visual storytelling. View our award here: hubs.la/Q02Y_4Y_0
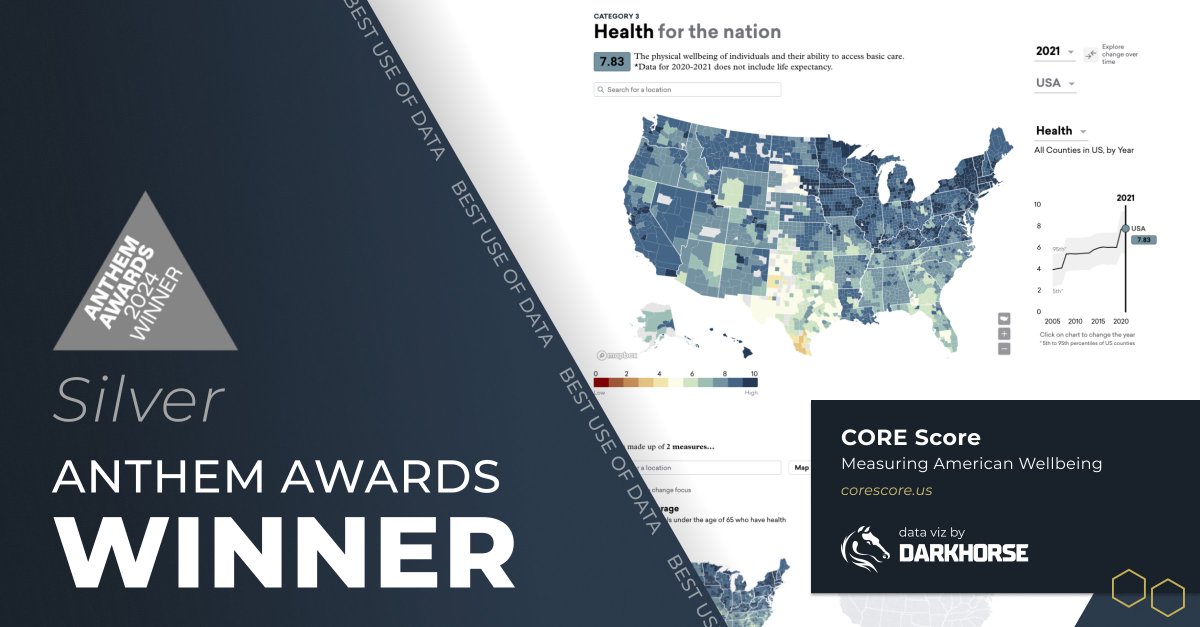
Darkhorse Analytics is proud to announce that CORE Score Data Visualization has been named a Silver Anthem Awards winner. View our award here: hubs.la/Q02Y_6K10
Our visualizations "AIDSVu Interactive Map & Location Profiles" and "CORE Score Data Visualization" are finalists for the 4th Anthem Awards. Vote for "AIDSVu Interactive Map & Location Profiles": hubs.la/Q02VfGH70 Vote for "CORE Score": hubs.la/Q02VfJ-y0

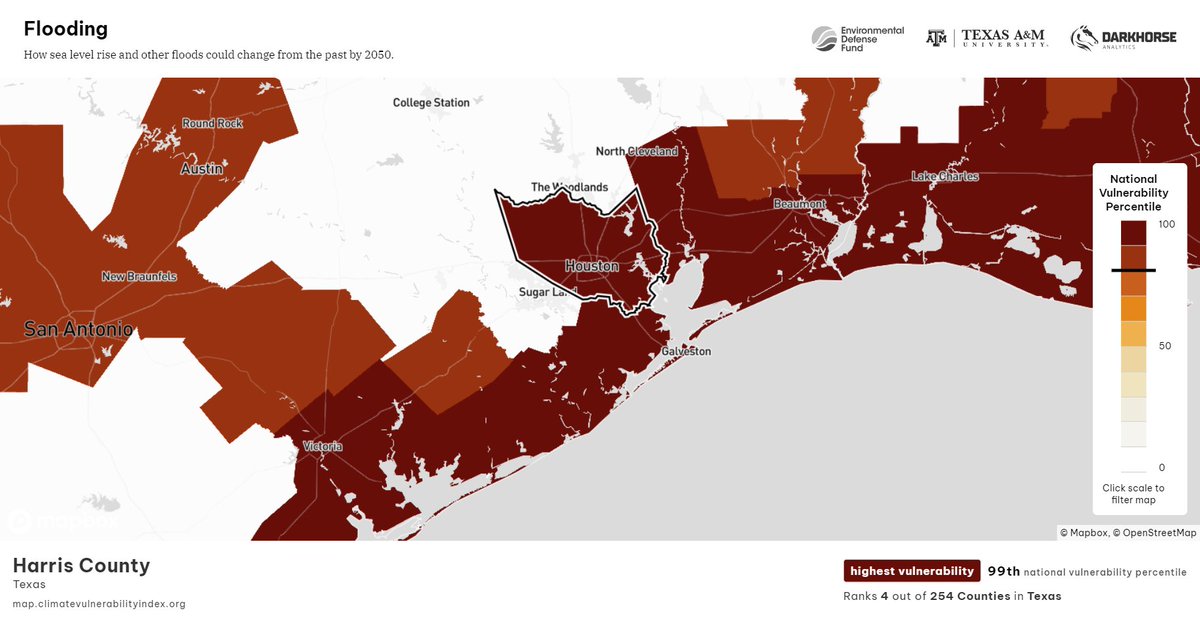
Climate change is transforming our summers into states of emergency. @EnvDefenseFund's U.S. Climate Vulnerability Index helps show why storms like #HurricaneBeryl become complex disasters in places like Houston. #ExtremeWeatherSZN
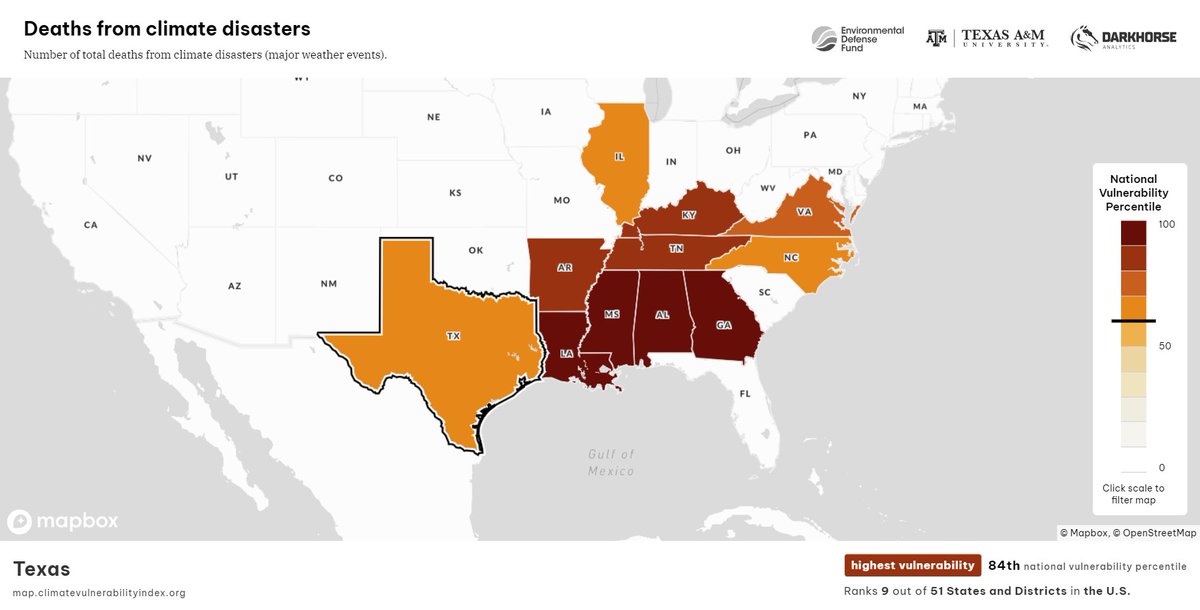

Hurricane Beryl’s record-breaking strength and rapid intensification highlight the stark impact of human-caused climate change driven by burning fossil fuels. “With a warming climate, we should be expecting more of these storms to rapidly intensify.” npr.org/2024/07/04/nx-…

Our work on the new AIDSVu and HepVu Interactive Maps is live. Check them out here: hubs.la/Q02Gr67M0 and hubs.la/Q02GqZ_r0 These tools continue to serve Darkhorse’s ongoing mission: to make brilliance accessible.

TODAY is the last day to show support for @dhanalytics. Join the Anthem Awards Celebration: celebrate.anthemawards.com/PublicVoting#/… #AnthemAwards


United States Trends
- 1. Packers 214 B posts
- 2. Packers 214 B posts
- 3. Good Sunday 60,7 B posts
- 4. 4E FIRST FAMILY TIME 755 B posts
- 5. #Unveiling4Elements 750 B posts
- 6. Caleb 115 B posts
- 7. LaFleur 47,6 B posts
- 8. Ben Johnson 47,2 B posts
- 9. Bregman 29 B posts
- 10. McManus 20,4 B posts
- 11. Jordan Love 21,1 B posts
- 12. #GMMTVFANDAY28 255 B posts
- 13. WILLIAMEST IN TOKYO 217 B posts
- 14. Cancun 7.395 posts
- 15. Pond 107 B posts
- 16. Cubs 27,1 B posts
- 17. #Arknights6thAnniv 2.279 posts
- 18. Red Sox 8.468 posts
- 19. Devers 4.644 posts
- 20. Whale - Buy 4.818 posts


Something went wrong.
Something went wrong.