
Two websites: Learning OpenPyXL: openpyxl.com Learning xlwings: xlwings.net

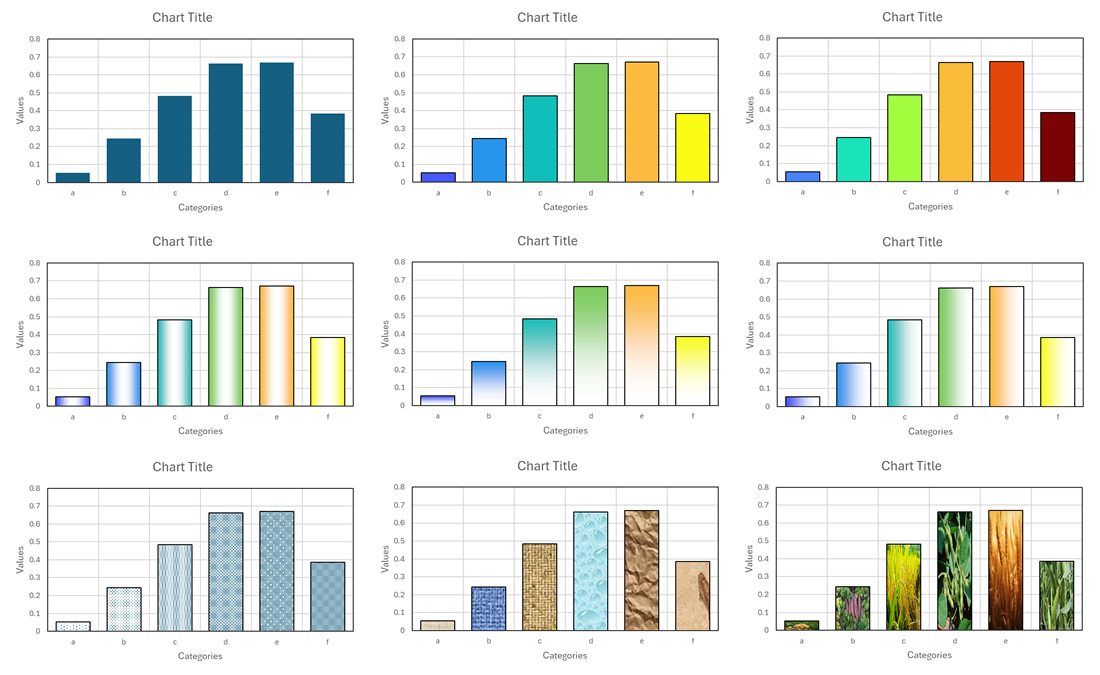
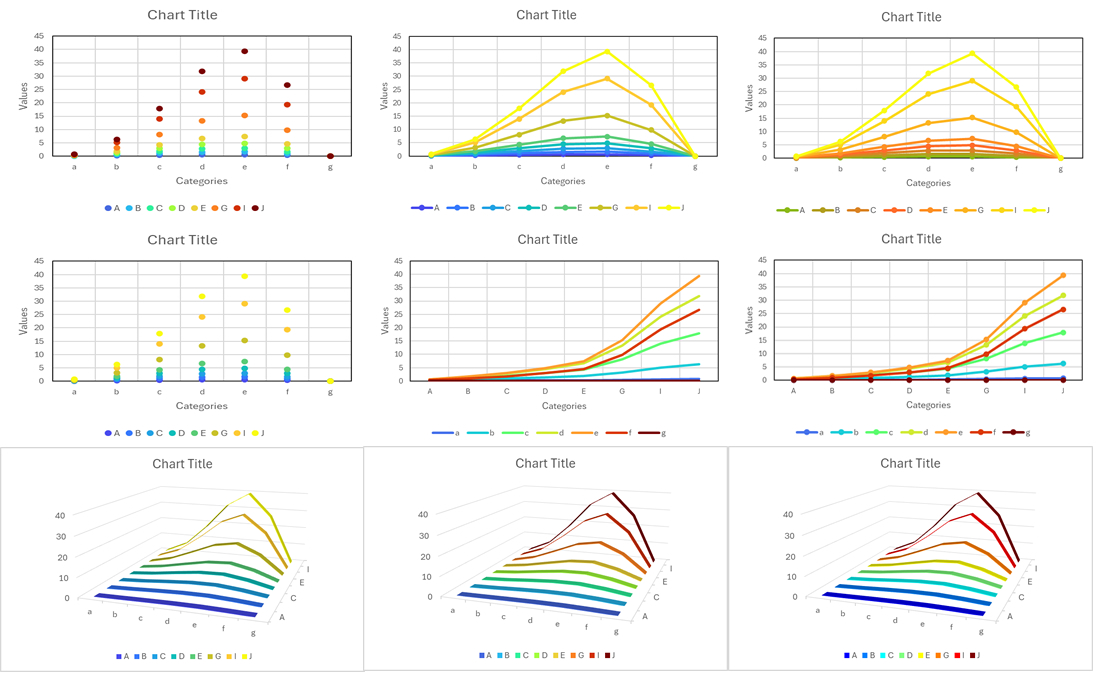
Use Colormaps To Automatically Color 2D Dot Charts & Line Charts With xlChart+ Add-in
Use Colormaps To Automatically Color Smoothed Line Charts With xlChart+ Add-in

Use Colormaps To Automatically Color 2D Line Charts With xlChart+ Add-in
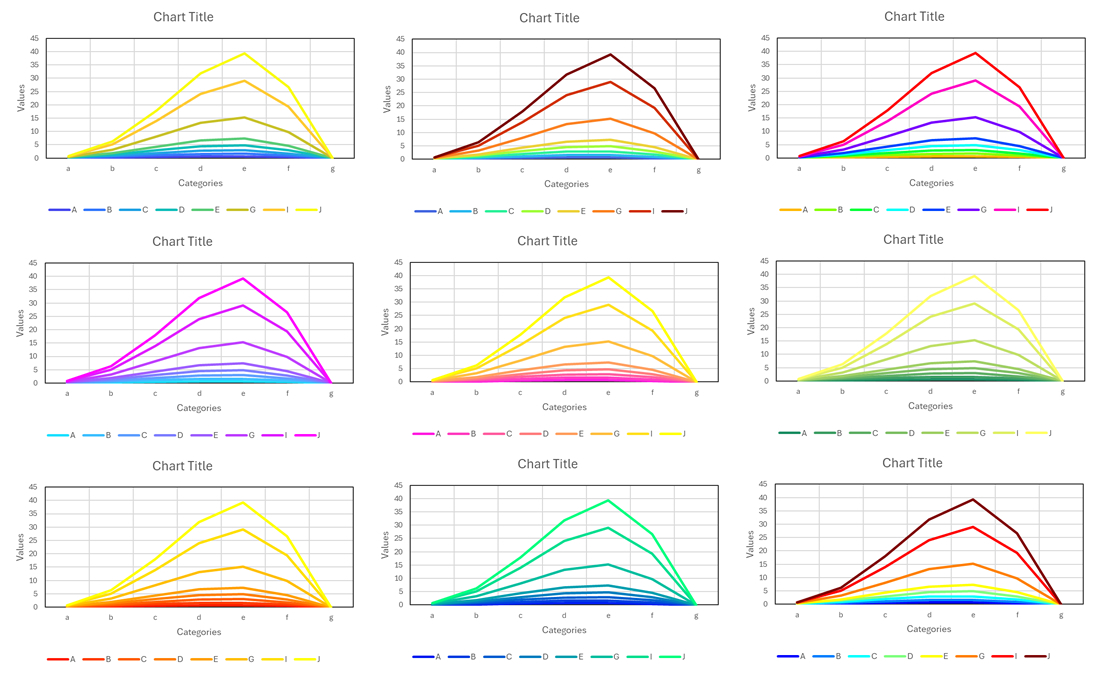
xlChart+: Use Colormaps To Automatically Color Excel 2D Line Charts


United States Trends
- 1. #StrangerThings5 215K posts
- 2. Thanksgiving 657K posts
- 3. BYERS 46.4K posts
- 4. Reed Sheppard 5,162 posts
- 5. robin 84.1K posts
- 6. Afghan 272K posts
- 7. Podz 3,976 posts
- 8. holly 60.2K posts
- 9. Dustin 89K posts
- 10. National Guard 646K posts
- 11. Gonzaga 8,376 posts
- 12. Vecna 52.1K posts
- 13. hopper 14.9K posts
- 14. Jonathan 72.7K posts
- 15. Amen Thompson 1,673 posts
- 16. Erica 15.9K posts
- 17. #AEWDynamite 21.6K posts
- 18. derek 17.5K posts
- 19. Tini 8,938 posts
- 20. noah schnapp 8,615 posts
Loading...
Something went wrong.
Something went wrong.