
Tristan Guillevin
@ladataviz
We transform how you visualize and communicate data http://ladataviz.com Figma to Tableau, Viz Extensions, and more! Weekly news: http://newsletter.ladataviz.com
You might like


Yes, you saw the title, Viz Extensions are going Public! Next week we'll explain share everything you need to know during the #DataDev Day! Make sure to register!

Get ready for #DataDev Day on November 12! 🚀 Dive into the latest on MCP (Model Context Protocol), learn how to get started as a DataDev, and listen to a developer's perspective on the Tableau Next experience. Learn, grow, and connect! Register now: tabsoft.co/4hOZX6L…


This week on the Data + Love Podcast Video Game Industry Analyst Louis Yu pops in and we talk about the state of the industry, game telemetry data, and the variability of pricing models

Time to add some curves and shades to those lines, @tableau. Available this Friday on our website, and soon on the Tableau Exchange!


Flight ✅ Hotel ✅ Speaker application ✅ See you in December in London, @tableau #DataFamEurope!
The #DataFamEurope 2025 Call for Participation is now open! Inspire the community with your stories on Tableau innovations, analytics in action, data and AI, or the power of the DataFam ✨ Submit your proposal by Monday, September 29 at 6 p.m. BST: bit.ly/4nrQhAE

Yes! And it can even show movements! Available now on our website and soon in the @tableau Exchange!
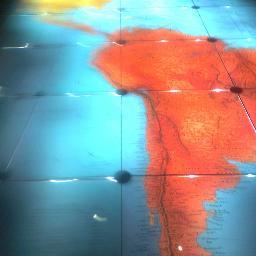
Rotating globes in Tableau If you didn't know the @ladataviz team were brilliant, here's your notice

Book1.twb
Rotating globes in Tableau If you didn't know the @ladataviz team were brilliant, here's your notice

A simple chart for this week's Makeover Monday challenge, using @ladataviz's online tool ladataviz.com/tools/advviz/t… #makeovermonday public.tableau.com/app/profile/ir…


I can't wait to try this!
New Viz Extension: KPI Card 🚨 Create beautiful KPI Cards in @tableau with trend and comparison, in just two drag-and-drops, and no calculations. Many customization options (colors, chart type, number format) and easy comparison with targets. Available in the Tableau Exchange!

ナニコレー KPIカード、オサレだしチョー簡単に作ってない?
New Viz Extension: KPI Card 🚨 Create beautiful KPI Cards in @tableau with trend and comparison, in just two drag-and-drops, and no calculations. Many customization options (colors, chart type, number format) and easy comparison with targets. Available in the Tableau Exchange!
New Viz Extension: KPI Card 🚨 Create beautiful KPI Cards in @tableau with trend and comparison, in just two drag-and-drops, and no calculations. Many customization options (colors, chart type, number format) and easy comparison with targets. Available in the Tableau Exchange!


Latest TUG is youtu.be/Vf791kGQ7D8 @PabloLGomez -Color Mastery-Color in Data Storytelling @ladataviz -ChatGPT with Tableau Extensions @cristiansaavedr & @WJSutton12 -Land & Expand AI Capabilities w/ Tableau LangChain LOTS of awesome content @ youtube.com/@TeamDataFam #DataFam

Just a quick break from Clair Obscur: Expedition 33 to share this new Viz Extension we are working on! 🌎🌍🌏 @tableau + Viz Extension 🤯

The lightsabers are an iconic element of the #starwars franchise, but do you know what each color represents?This @tableau viz I did last week explores the owners of the different colored lightsabers and some fun facts. x.com/datavizlouis/s…
The lightsabers are an iconic element of the #starwars franchise, but do you know what each color represents?This @tableau viz I did last week explores the owners of the different colored lightsabers and some fun facts. x.com/datavizlouis/s…
To celebrate #starwarsday and having completed #StarWarsJediFallenOrder, I've created a new @tableau viz on the franchise's iconic Lightsaber. I hope you have fun whether you're a new or seasoned #starwars #datafam ⚔️ May the Force be with you. ⚔️ public.tableau.com/app/profile/lo…
Latest TUG is youtu.be/YrkBJX5P9CI "Beyond the Boundaries of Tableau" by @ladataviz Unlock the full potential of Tableau with tools and techniques to boost your creativity and productivity. LOTS of awesome content @ youtube.com/@TeamDataFam #DataFam

Direct effect of presenting at @tableau Conference: we reached 2500+ subscribers to our newsletter 🎉 Yesterday, I shared in detail the four new tools we revealed in San Diego during my session, Viz Extension Shark Tank, and Devs On Stage Labs. Available online. Link in bio!


Spiraling Satellite Charts New visualisation using Tableau! What can you do if your pie / doughnut chart %s go beyond 100%? Try a spiraling satellite chart! Link: lnkd.in/eKMcmR5j

Figma to Tableau Plugin update 📈 Instead of the previous gray bar chart, you can now select your color and choose from 13 different chart types for your worksheets. The chart type is automatically generated in Tableau, ensuring your exports always look great and accurate!


United States Trends
- 1. Steph 58K posts
- 2. Wemby 26.8K posts
- 3. Spurs 28.3K posts
- 4. Draymond 10.4K posts
- 5. Clemson 10.9K posts
- 6. Louisville 10.8K posts
- 7. #SmackDown 48.8K posts
- 8. Zack Ryder 14.9K posts
- 9. Aaron Fox 1,860 posts
- 10. #DubNation 1,876 posts
- 11. Harden 12.6K posts
- 12. Dabo 1,958 posts
- 13. Brohm 1,582 posts
- 14. Landry Shamet 5,601 posts
- 15. #OPLive 2,451 posts
- 16. Marjorie Taylor Greene 41.6K posts
- 17. Matt Cardona 2,729 posts
- 18. Miller Moss N/A
- 19. Massie 51.3K posts
- 20. UCLA 8,217 posts
You might like
-
 Ken Flerlage
@flerlagekr -
 Ludovic Tavernier
@ltavernier7 -
 ZACH
ZACH
@ZachBowders -
 Annabelle Rincon
@RinconAnnabelle -
 Sarah Bartlett
@sarahlovesdata -
 Kevin Flerlage
@FlerlageKev -
 Brian Moore
@BMooreWasTaken -
 Lindsay Betzendahl
@ZenDollData -
 Jennifer Dawes
@jreevers5 -
 Jessica Moon
@VizByMoon -
 Christina P. Gorga
@StyleSTEAMed -
 Eric Balash
@ReadySetData -
 Kimly
Kimly
@ScottKimly -
 Soha Elghany
@s0s0_el
Something went wrong.
Something went wrong.