
Lore Smith
@lorefiddler
He/they, data nerd Currently looking for a junior data analysis position!
You might like


My first @kaggle kernel!! Cat Food Stats for "Adorable Home" on #kaggle via @KaggleDatasets kaggle.com/datasets/lores…

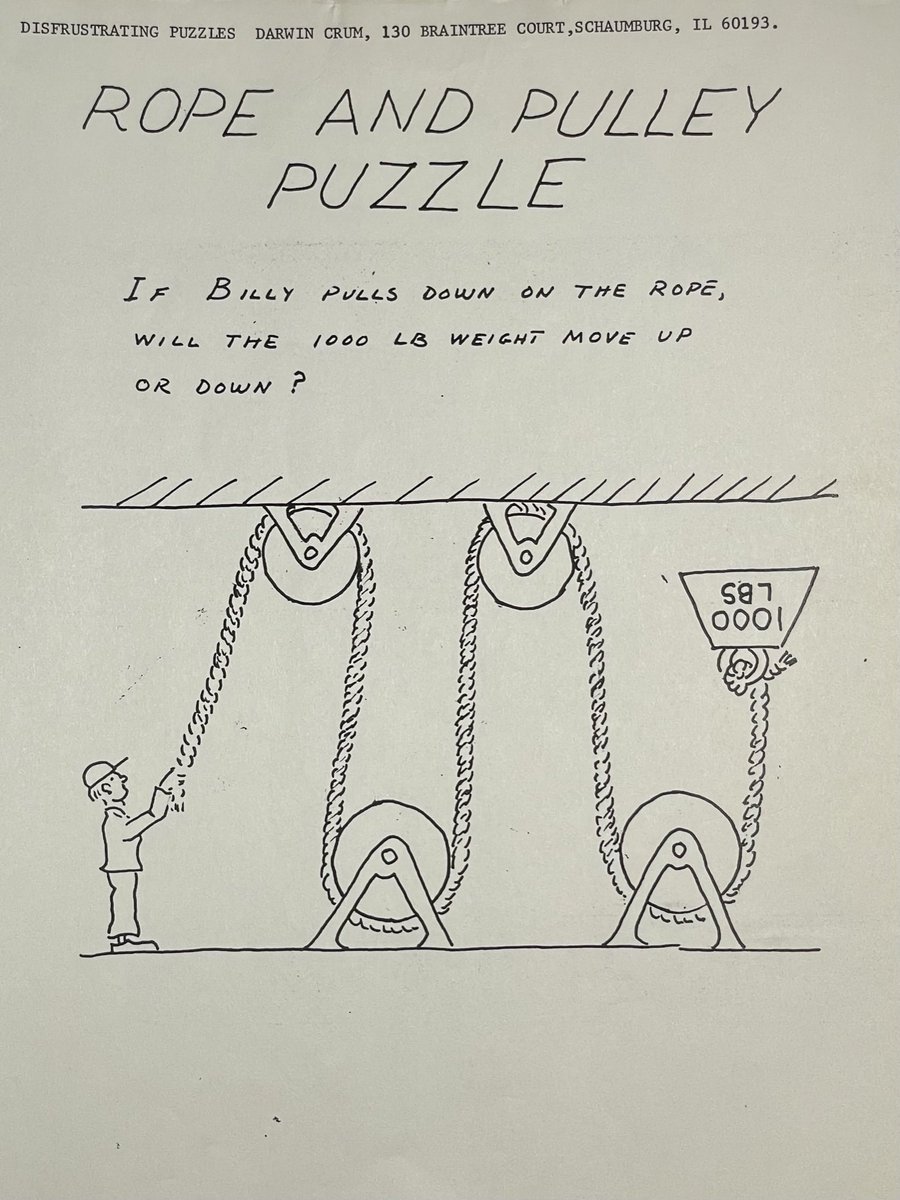
My mom sent me some papers that belonged to my grandfather, Darwin Randall Crum, which included a collection of “Disfrustrating Puzzles” he created


Rubber builds up on airport runways and runway lights every time a plane's wheels touch down
stackoverflow.com/q/74586964/195… Posted my first StackOverflow question! Anybody handy with html & CSS pls take a look!

Hey @microsoft why can't I either remove my deadname from my skype account or delete an account I created a decade ago without deleting my entire microsoft account? This is an unbelievably hostile system for trans people.

I'm a big fan of the pomodoro technique for productivity, where I do my best impression of a tomato and sit in the dark for 48 hours before I am devoured by beings beyond my comprehension
I created a Google Developer Profile! #DevBadges developers.google.com/profile/badges…

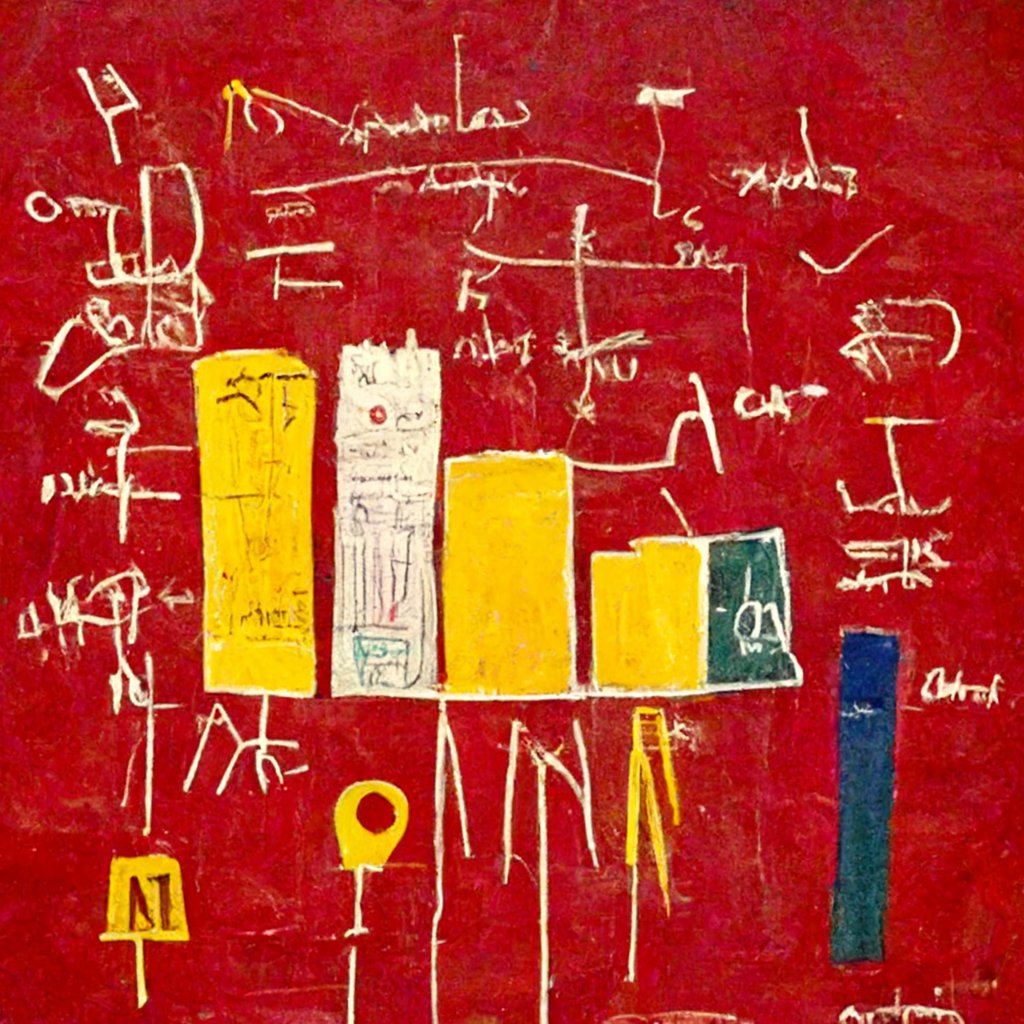
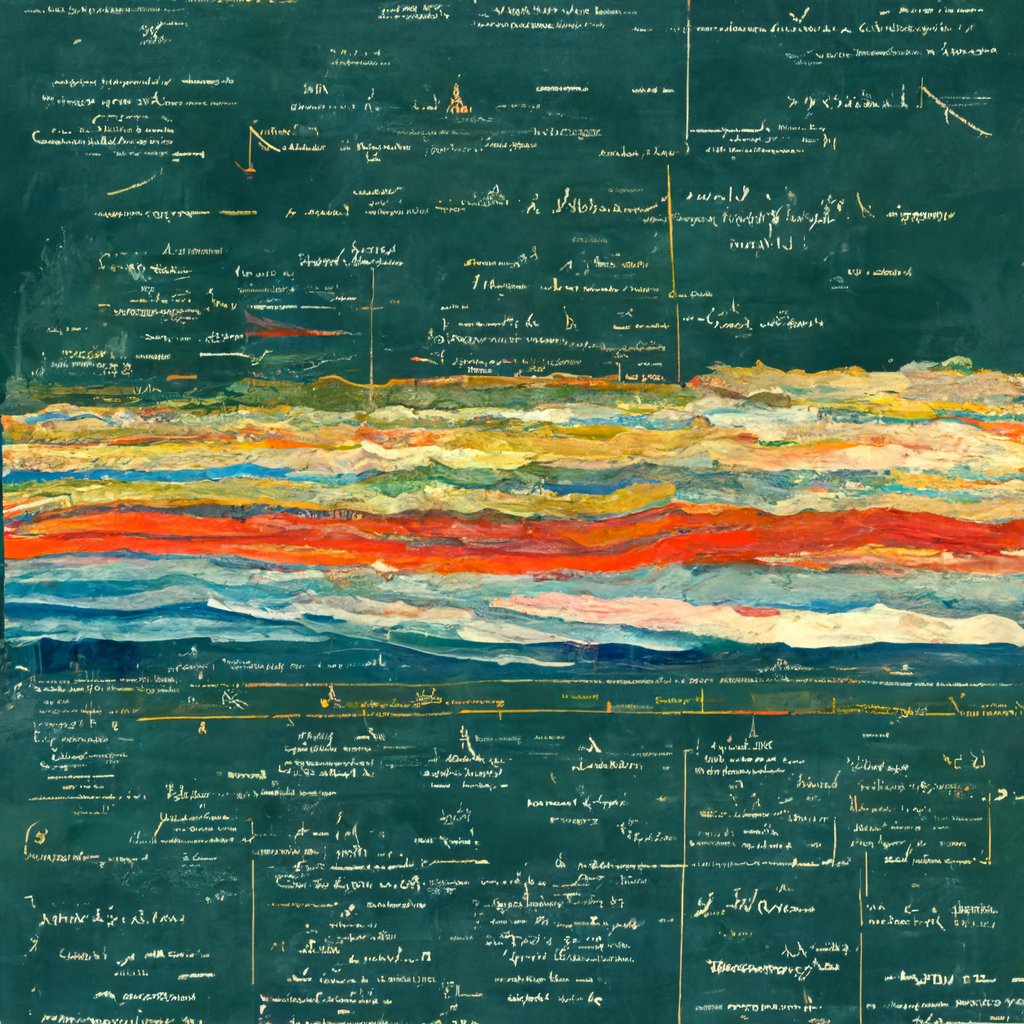
Data visualization inspiration thanks to DALL-E: how Rothko, Basquiat, Picasso, and Monet would create an academic chart.


5 billion people use the internet. Less than 1% understand it. This mega thread will get you up to speed—starting today:

Me about to debug my javascript #javascript #webdevelopment #development #Developers #codingmeme


GIS is awesome... Hope I can do more! coursera.org/share/b20fef9b… #Coursera

Why haven’t aliens come to our solar system yet? They read the reviews: One star.


Looked beautiful, no other reason !!!! #IMDb #Datavisualization #Tableau #art #visualization


Testing - checking if the data visualized is accessible to people with color vision deficiencies

Ultimately, how well a chart works comes down to how well it gets across its message to the audience. Here’s how I conceptualise it: You can make incremental improvements to a chart by tweaking aesthetics and precision, but you can 10x your chart by nailing the message clarity.


So today I’ve started describing the work I do as “lo-fi data science” as I don’t do any complex modelling 🤷♀️


United States Trends
- 1. #SmackDown 36.1K posts
- 2. Caleb Wilson 4,344 posts
- 3. Giulia 12K posts
- 4. #BostonBlue 3,011 posts
- 5. Rockets 19.3K posts
- 6. #OPLive 1,397 posts
- 7. #TheLastDriveIn 1,981 posts
- 8. Lash Legend 4,585 posts
- 9. Supreme Court 168K posts
- 10. #Dateline N/A
- 11. Northwestern 4,217 posts
- 12. Reed 24.6K posts
- 13. Chelsea Green 5,167 posts
- 14. Harrison Barnes N/A
- 15. Sengun 3,893 posts
- 16. Kansas 23.4K posts
- 17. Darryn Peterson 2,156 posts
- 18. NBA Cup 8,324 posts
- 19. Tulane 2,588 posts
- 20. End of 3rd 1,437 posts


Something went wrong.
Something went wrong.