
#qt #pyside #PYTHON Finally, MVP is ready! Now I got an interactive tool for graph visualization that can be integrated into PySide application. Still a lot of bugs to hunt and polishing to be done, but it works.

#pyside6 #qt I finally got a good model of a Node - it is just some graphics and a label, but it should be more than enough to handle most of the situations. Now it is a time to make it more visually appealing.

It is always a pleasure to delete code - just one click and all your are free from your past mistakes. Someone can argue - that you should always refactor, but sometimes it is much easier just to drop everything and start from the very beginning.
Technology is moving fast, but despite of that there are books that relevant no mater of what and one of these books is Domain Driven Design or 'The Big Blue Book'. Ideas in this book are so simple and powerful so you just can't ignore it.

#graphviz #pygraphwidget #graphdatascience GraphViz's 'circo' layout gives beautiful visualizations, especially for hierarchy graphs.


#pygraphwidget #pyside6 #graphdatascience Basic hovered and selected states. The process is not perfect at the moment, but it is more than enough for MVP. Now I want to improve test environment before moving forward.
#pygraphwidget #pyside6 #graphdatascience Basic interactions test. On the next step I want to add some animations and visual effects for hovered and selected states.
#pygraphwidget #pyside6 #graphdatascience It was really tricky to make QGraphicsSvgItem scalable and adapt it for QGraphicsLayout, but the efforts definitely worth it - svg icons will add a lot of expressive power to all future visualizations.

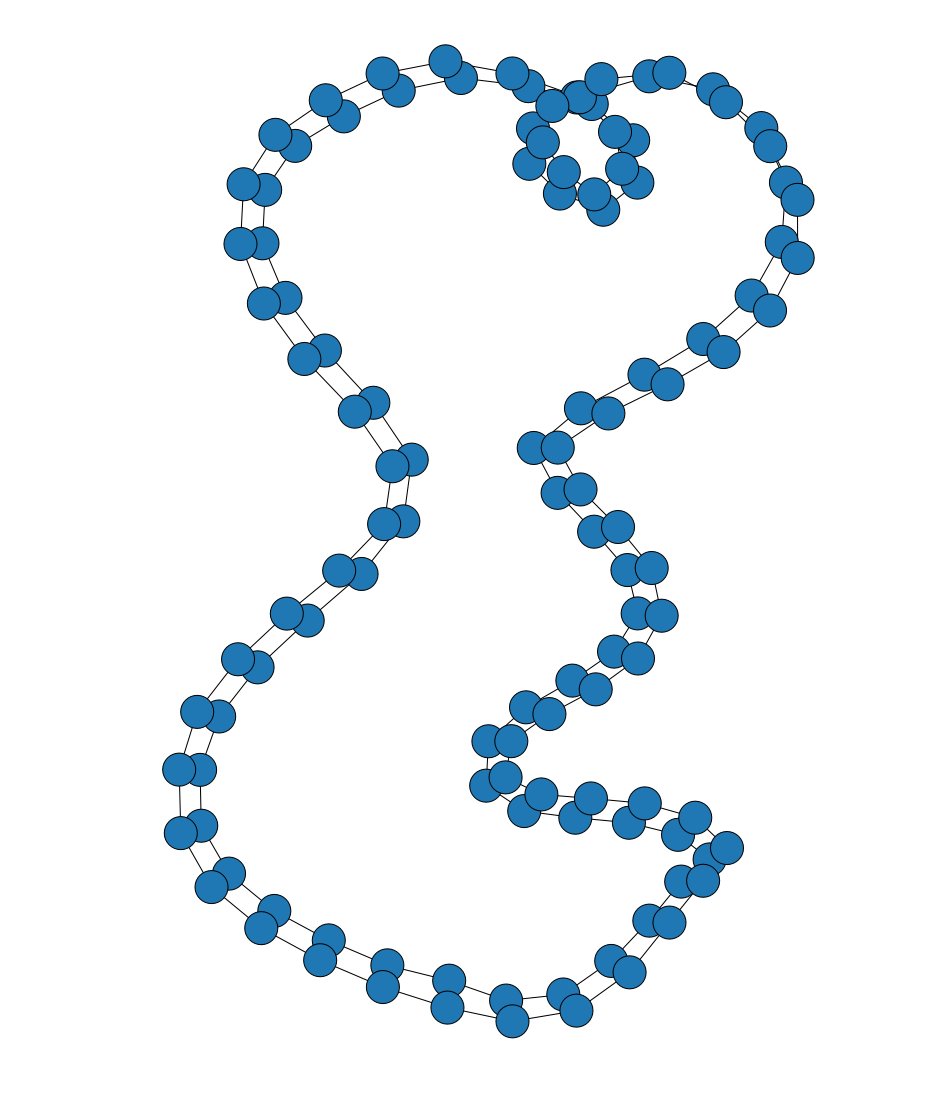
#pygraphwidget Random nodes experiment - I want to squeeze out maximum from QGraphicsPathItem to be able to set arbitrary size, shape and other attributes of a node. On the next step I want to use PNG and SVG icons as a visual representation of a node.

So, I've decided to create an interactive graph visualization tool with Python and PySide6 - first prototype example.


United States Trends
- 1. Rams 20.6K posts
- 2. Seahawks 26.4K posts
- 3. 49ers 18.5K posts
- 4. Lions 67.2K posts
- 5. Commanders 69.2K posts
- 6. Niners 4,440 posts
- 7. Bills 141K posts
- 8. Giants 70.2K posts
- 9. Stafford 6,473 posts
- 10. Cardinals 9,952 posts
- 11. Canada Dry 1,008 posts
- 12. Dan Campbell 2,534 posts
- 13. #OnePride 3,971 posts
- 14. Daboll 14.1K posts
- 15. Jags 7,447 posts
- 16. Bears 63K posts
- 17. #RaiseHail 3,090 posts
- 18. Dart 28.1K posts
- 19. Gibbs 6,948 posts
- 20. Caleb 51.8K posts
Something went wrong.
Something went wrong.