#graphviz resultados de búsqueda

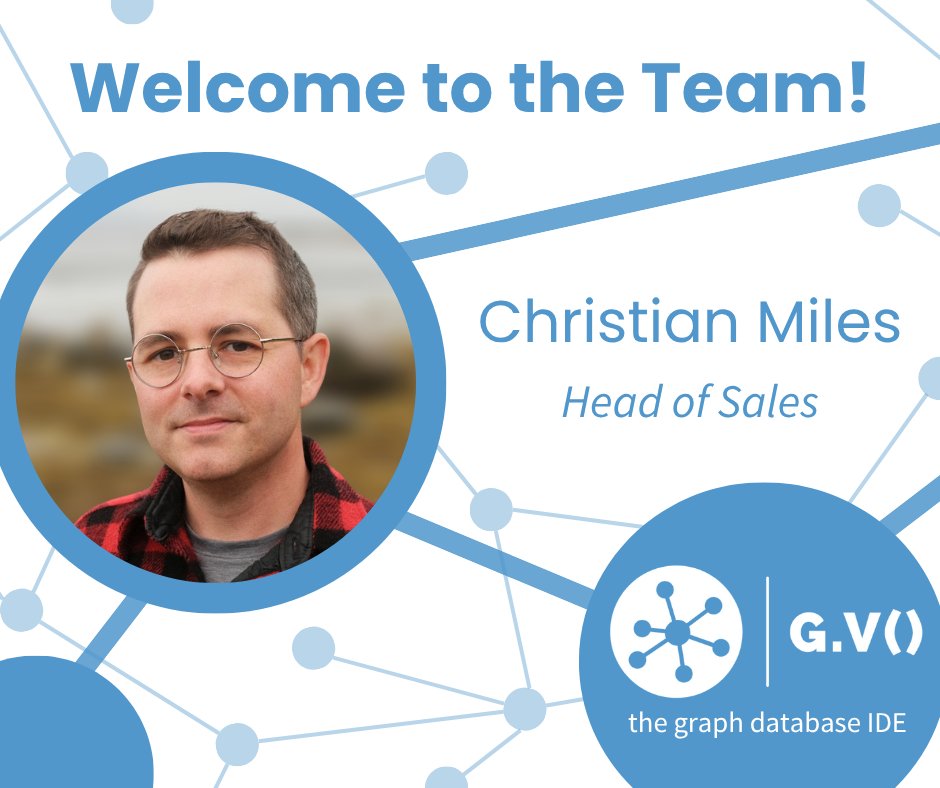
Christian Miles has joined the G.V() team as our new Head of Sales! Christian has been working with graph tech since 2012 & he holds a MSci in Maths & CompSci, so he's not like one of those regular sales guys, he’s a nerdy sales guy. Welcome to the team, Christian! #graphviz

Happy 10th birthday to the Relationship Visualizer spreadsheet! 🎉🥳🎂 Turning spreadsheets into stunning graphs has never been easier. Cheers to a decade of simplifying complex connections! Download it free & start visualizing! exceltographviz.com #Graphviz #Excel @msexcel

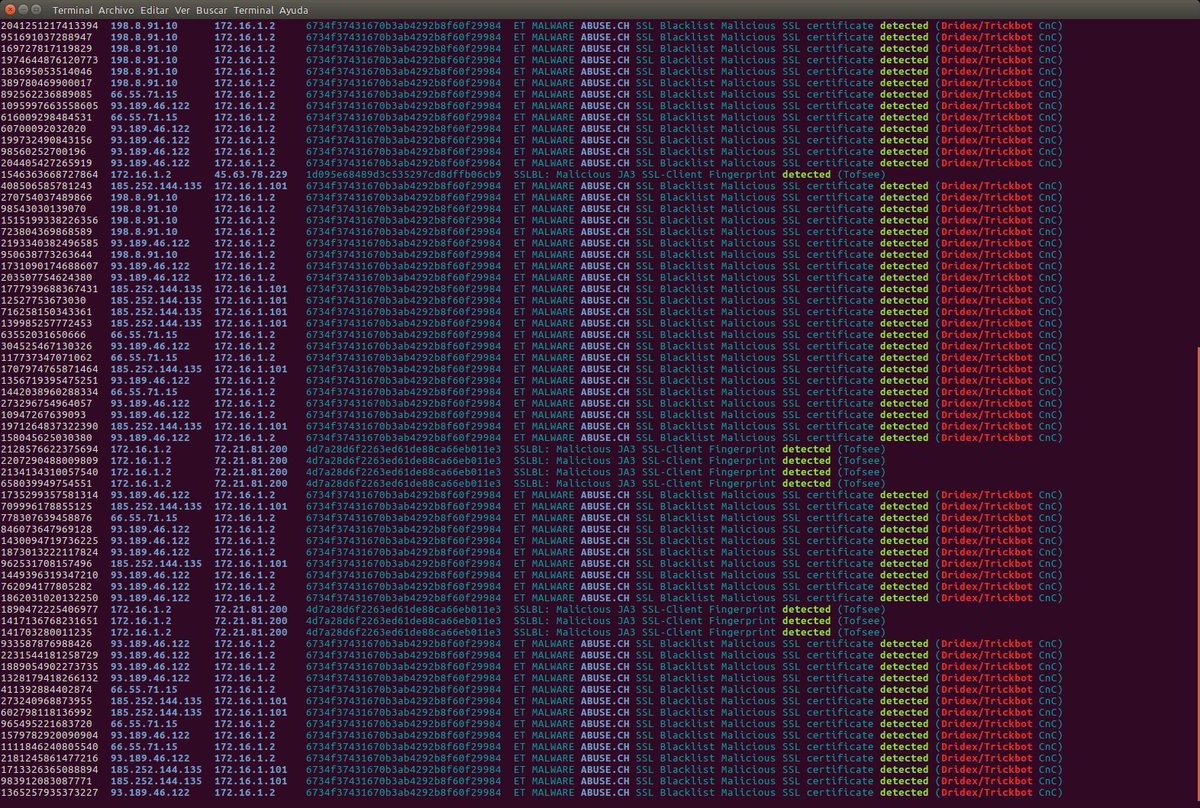
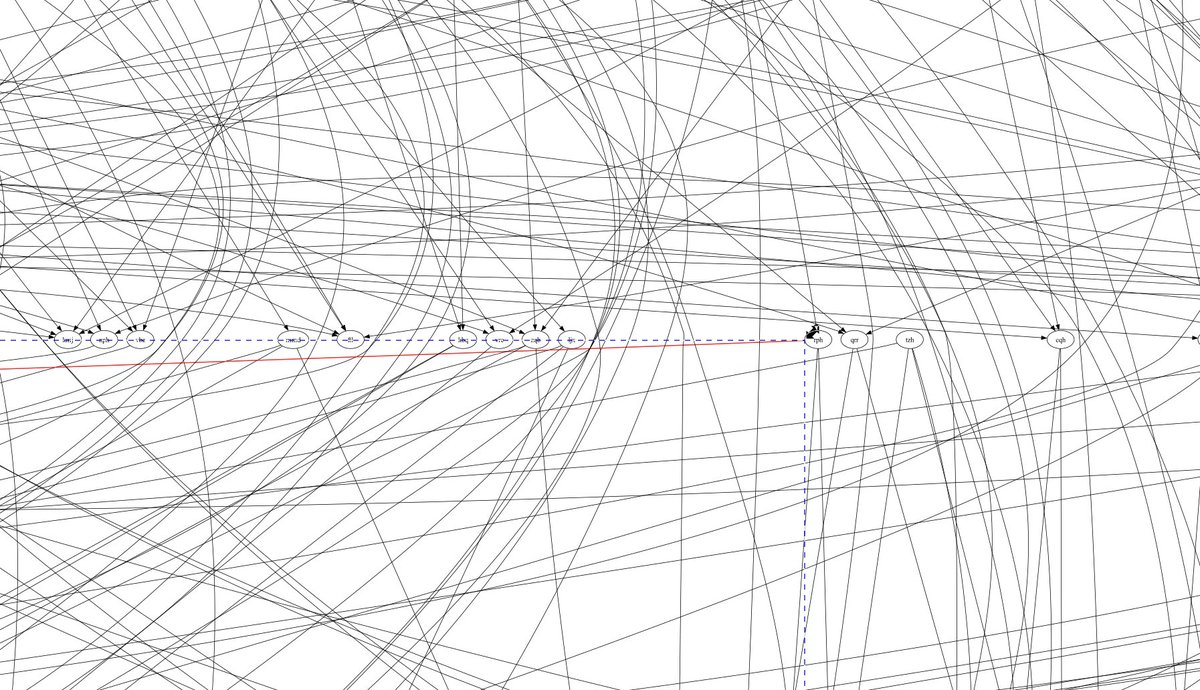
#Suricata_IDS & #GraphViz (strict digraph). (2023-07-25-IcedID-infection-traffic.pcap) cat eve.json|ag -v 'JA3|Firehol|POLICY'|jq -c 'select(.alert) | [.src_ip,.dest_ip,.alert.category,.alert.signature,.flow_id]' | tr -d '"[]' .... sfdp -Gdpi=70 -Tpng | display -
![seguridadyredes's tweet image. #Suricata_IDS & #GraphViz (strict digraph).
(2023-07-25-IcedID-infection-traffic.pcap)
cat eve.json|ag -v 'JA3|Firehol|POLICY'|jq -c 'select(.alert) | [.src_ip,.dest_ip,.alert.category,.alert.signature,.flow_id]' | tr -d '"[]' ....
sfdp -Gdpi=70 -Tpng | display -](https://pbs.twimg.com/media/F2BRGFeWEAAEZq9.jpg)
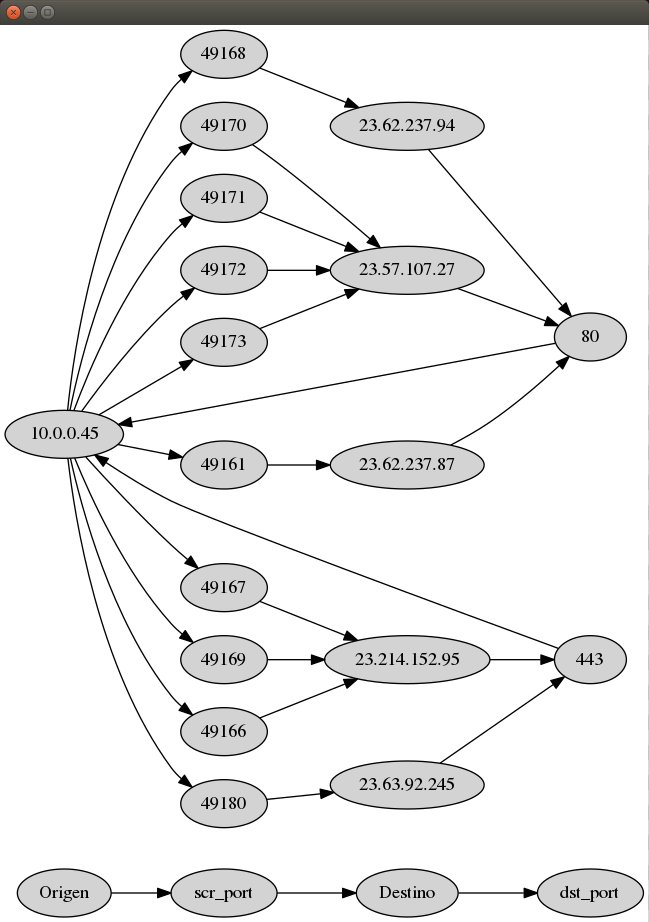
#GraphViz anda .. #tcpdump --number -n -c500 -rmixed.cap tcp |awk '{print $1"."$2"."$4"."$6"."$8}' | sed 's/\./,/1;s/\./,/2;s/\./,/5;s/\./,/5;s/\./,/8;s/://3;s/\./,/8;s/,//7;1i\Num,Tiempo,Origen,scr_port,Destino,dst_port' |awk 'BEGIN{print "digraph \"G\"{node..
#Wazuh & #MITRE ATT&CK & #GraphViz jq -c 'select(.rule.mitre and .agent.id=="047")|[.id,(.timestamp[0:10]),(.rule.mitre.tactic|tostring|split(",")[0:4]|tostring),(.rule.mitre.id|tostring|split(",")[0:3]),.agent.id,"Wazuh",.rule.id,(.rule.mitre.technique|...
![seguridadyredes's tweet image. #Wazuh & #MITRE ATT&CK & #GraphViz
jq -c 'select(.rule.mitre and .agent.id=="047")|[.id,(.timestamp[0:10]),(.rule.mitre.tactic|tostring|split(",")[0:4]|tostring),(.rule.mitre.id|tostring|split(",")[0:3]),.agent.id,"Wazuh",.rule.id,(.rule.mitre.technique|...](https://pbs.twimg.com/media/FvY43gfXgAAhTb0.jpg)
![seguridadyredes's tweet image. #Wazuh & #MITRE ATT&CK & #GraphViz
jq -c 'select(.rule.mitre and .agent.id=="047")|[.id,(.timestamp[0:10]),(.rule.mitre.tactic|tostring|split(",")[0:4]|tostring),(.rule.mitre.id|tostring|split(",")[0:3]),.agent.id,"Wazuh",.rule.id,(.rule.mitre.technique|...](https://pbs.twimg.com/media/FvY43tqWYAYCc5a.jpg)
A new feature in version 7.0 captures and displays the messages emitted by the Graphviz dot command in a "console" worksheet. #graphviz #msexcel


#olevba && #GraphViz/Dot. Arreglando la gráfica... #olevba -a Project.bin --json | ag -v XLMMacroDeobfuscator|jq -c .[].analysis[] | ag '^{"type' | ag -v 'Base64' |tr -d '#' |jq -c [.type,.keyword,.description]
![seguridadyredes's tweet image. #olevba && #GraphViz/Dot.
Arreglando la gráfica...
#olevba -a Project.bin --json | ag -v XLMMacroDeobfuscator|jq -c .[].analysis[] | ag '^{"type' | ag -v 'Base64' |tr -d '#' |jq -c [.type,.keyword,.description]](https://pbs.twimg.com/media/FvY8jX2XoAU1wkw.jpg)
#olevba / #GraphViz. Graficando "Composite Document File V2 Document, Little Endian, Os: Windows Microsoft Excel" . #olevba -a 50b610.xls.bin --json |ag -v XLMMacroDeobfuscator|jq -c .[].analysis[] | ag '^{"type' | ag -v 'Base64' |tr -d '#' |jq -c [.type,.keyword,.description]
![seguridadyredes's tweet image. #olevba / #GraphViz. Graficando "Composite Document File V2 Document, Little Endian, Os: Windows Microsoft Excel" .
#olevba -a 50b610.xls.bin --json |ag -v XLMMacroDeobfuscator|jq -c .[].analysis[] | ag '^{"type' | ag -v 'Base64' |tr -d '#' |jq -c [.type,.keyword,.description]](https://pbs.twimg.com/media/FljQr1LXwAItsI-.jpg)
![seguridadyredes's tweet image. #olevba / #GraphViz. Graficando "Composite Document File V2 Document, Little Endian, Os: Windows Microsoft Excel" .
#olevba -a 50b610.xls.bin --json |ag -v XLMMacroDeobfuscator|jq -c .[].analysis[] | ag '^{"type' | ag -v 'Base64' |tr -d '#' |jq -c [.type,.keyword,.description]](https://pbs.twimg.com/media/FljQzcaWIAIGOSP.png)
#Zeek LABS. notice.log #IOCs & #GraphViz cat notice.log | ag -v DNS |jq -c 'select(.uid)|[.msg,."id.orig_h",."id.resp_h",.note,.uid]'
![seguridadyredes's tweet image. #Zeek LABS. notice.log #IOCs & #GraphViz
cat notice.log | ag -v DNS |jq -c 'select(.uid)|[.msg,."id.orig_h",."id.resp_h",.note,.uid]'](https://pbs.twimg.com/media/FqNu4QLWcAg7YlE.jpg)

A PoC using the #OpenAI API to manipulate #graphviz diagrams using natural language. It uses the gpt-3.5-turbo engine so the hallucinations creates some issues but there are ways to partially work around that. This took ~45min to make. #GenerativeAI #AI


Revived the #graphviz #vscode extension as many people are still finding it useful. marketplace.visualstudio.com/items?itemName…


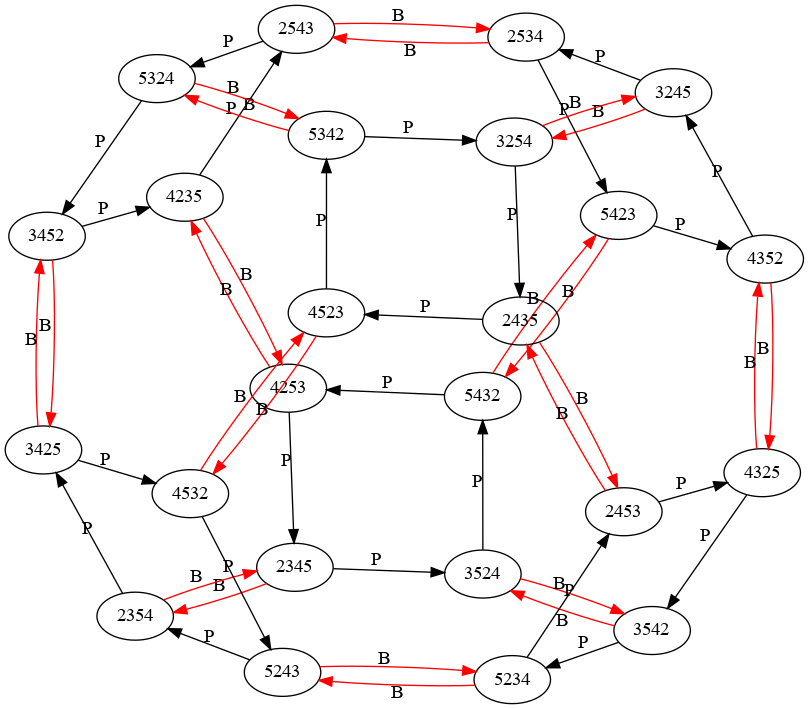
I should be working, but instead, I have been hacking python to automatically generate #graphviz (@graphviz) input to draw the graphs of #bellringing methods. Here is Plain Bob Doubles. (B=bob lead, P=plain lead)


Christian Miles has joined the G.V() team as our new Head of Sales! Christian has been working with graph tech since 2012 & he holds a MSci in Maths & CompSci, so he's not like one of those regular sales guys, he’s a nerdy sales guy. Welcome to the team, Christian! #graphviz
Happy 10th birthday to the Relationship Visualizer spreadsheet! 🎉🥳🎂 Turning spreadsheets into stunning graphs has never been easier. Cheers to a decade of simplifying complex connections! Download it free & start visualizing! exceltographviz.com #Graphviz #Excel @msexcel
Graphviz 14.0.0 #Graphviz #JOHNELLSON indiriste.com/indir/graphviz/
The Weekly Edge: Graph Size Matters, a New #GraphDatabase, & (Somehow) a Guy Fieri #GraphViz [15 August 2025] by @bwmerkl @gdotv_ltd Read this human-curated graph news roundup here & every Friday: gdotv.com/blog/weekly-ed… #DataViz #KnowledgeGraphs
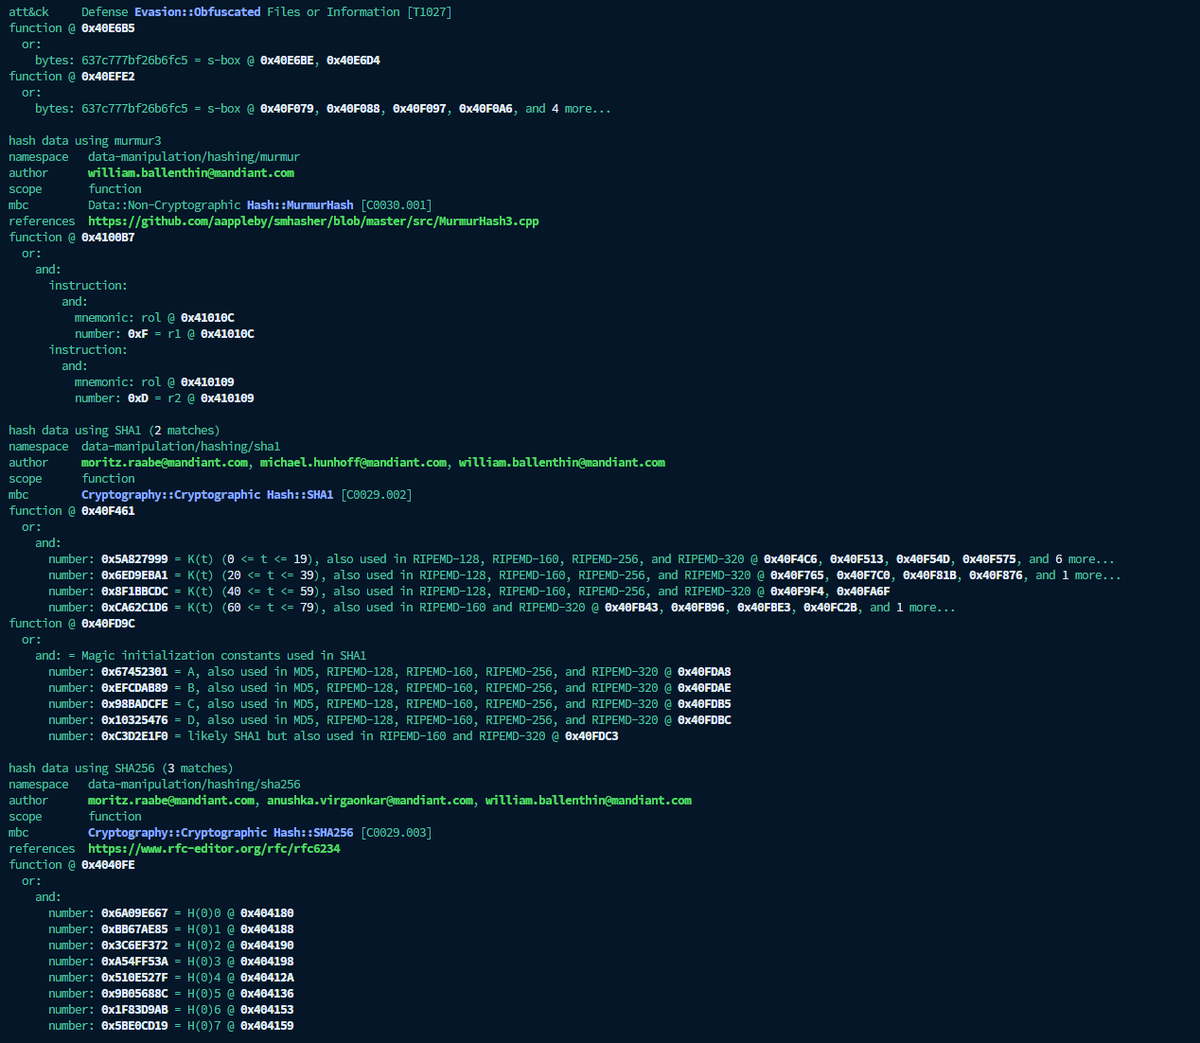
Nueva versión mandiant/#capa 9.2.1 Lo veo mucho más rápido. La salida de la forma -vv vverbose la veo mucho mejor estructurada para pasar a otras herramientas, gráficas #GraphVIZ. etc etc.

I edit a weekly tl;dr of graph tech news and resources called the Weekly Edge and here's the first edition: gdotv.com/blog/weekly-ed… If you want to keep up with the world of #graphdatabases #graphviz and other #OSS graph tech, check it out.

🚀 Struggling with Graphviz on Google Cloud Run? 🐍 Punita Goel shares a quick fix: update your Dockerfile to install Graphviz and adjust your cloudbuild.yaml for seamless deployment. Get your visualizations running smoothly! #GoogleCloud #Graphviz #Pyth… ift.tt/ovXasG5
dev.to
Fixing the Graphviz Error on Google Cloud Run
Deploying a Python app on Google Cloud Run with Graphviz visualizations can...

From code to clarity! Paste Graphviz DOT syntax and get instant, structured mind maps with AI - no rendering needed. Try now → mindmapai.app/graphviz-to-mi… #MindMapAI #Graphviz #MindMapping #Developers #DataScience #Flowcharts #AItools

Discover & Visualize Your Graph Database Schema in Just 2 Steps gdotv.com/blog/discover-… #graphdatabases #datamodeling #graphviz


#Suricata_IDS and #GraphViz. En 2020 aún tenemos mucho MS17-010 #ETERNALBLUE Exploitation (CVE-2017-0144) cat eve.json | ag BLUE |jq -c 'select(.alert) | [.src_ip,.dest_ip,.metadata.flowbits,.alert.category,.alert.signature,.flow_id]'
![seguridadyredes's tweet image. #Suricata_IDS and #GraphViz. En 2020 aún tenemos mucho MS17-010 #ETERNALBLUE Exploitation (CVE-2017-0144)
cat eve.json | ag BLUE |jq -c 'select(.alert) | [.src_ip,.dest_ip,.metadata.flowbits,.alert.category,.alert.signature,.flow_id]'](https://pbs.twimg.com/media/EOeTU4JX4AAHV22.jpg)
![seguridadyredes's tweet image. #Suricata_IDS and #GraphViz. En 2020 aún tenemos mucho MS17-010 #ETERNALBLUE Exploitation (CVE-2017-0144)
cat eve.json | ag BLUE |jq -c 'select(.alert) | [.src_ip,.dest_ip,.metadata.flowbits,.alert.category,.alert.signature,.flow_id]'](https://pbs.twimg.com/media/EOeTU4QWoAACuhP.png)


#Suricata_IDS/#GraphViz. Intentando graficar alertas de forma automática, legible, en una sola línea y de forma lógica. Intento I. De momernto ... 😂🤦♂️ cat eve.json | jq -c 'select(.alert and .http) | [.src_ip,.dest_ip,.http.http_method,.http.url,.alert.signature,.flow_id]'
![seguridadyredes's tweet image. #Suricata_IDS/#GraphViz. Intentando graficar alertas de forma automática, legible, en una sola línea y de forma lógica. Intento I. De momernto ... 😂🤦♂️
cat eve.json | jq -c 'select(.alert and .http) | [.src_ip,.dest_ip,.http.http_method,.http.url,.alert.signature,.flow_id]'](https://pbs.twimg.com/media/EMxw18rWsAUncr2.jpg)


Excited to have first (early, rough, unpolished) version of workflow directed graph plotting in @scipipe (develop branch). Lots of refinement to be done, but already seems helpful. Big kudos to #graphviz creators!!

#Zeek_IDS #Zeekurity Graficando las anomalias/weirds de tráfico Red. weirds.log/conn.log #GraphViz & paste jq -c 'select(.name!="unknown_protocol")|[.uid,.name,.["id.orig_h"],.["id.orig_p"],.["id.resp_h"],.["id.resp_p"]]' weirds.log |tr -d '"[]' >weirds;awk '{print $1}' FS=, ...
![seguridadyredes's tweet image. #Zeek_IDS #Zeekurity Graficando las anomalias/weirds de tráfico Red. weirds.log/conn.log #GraphViz & paste
jq -c 'select(.name!="unknown_protocol")|[.uid,.name,.["id.orig_h"],.["id.orig_p"],.["id.resp_h"],.["id.resp_p"]]' weirds.log |tr -d '"[]' >weirds;awk '{print $1}' FS=, ...](https://pbs.twimg.com/media/EMtnZ7OWkAAok1B.jpg)
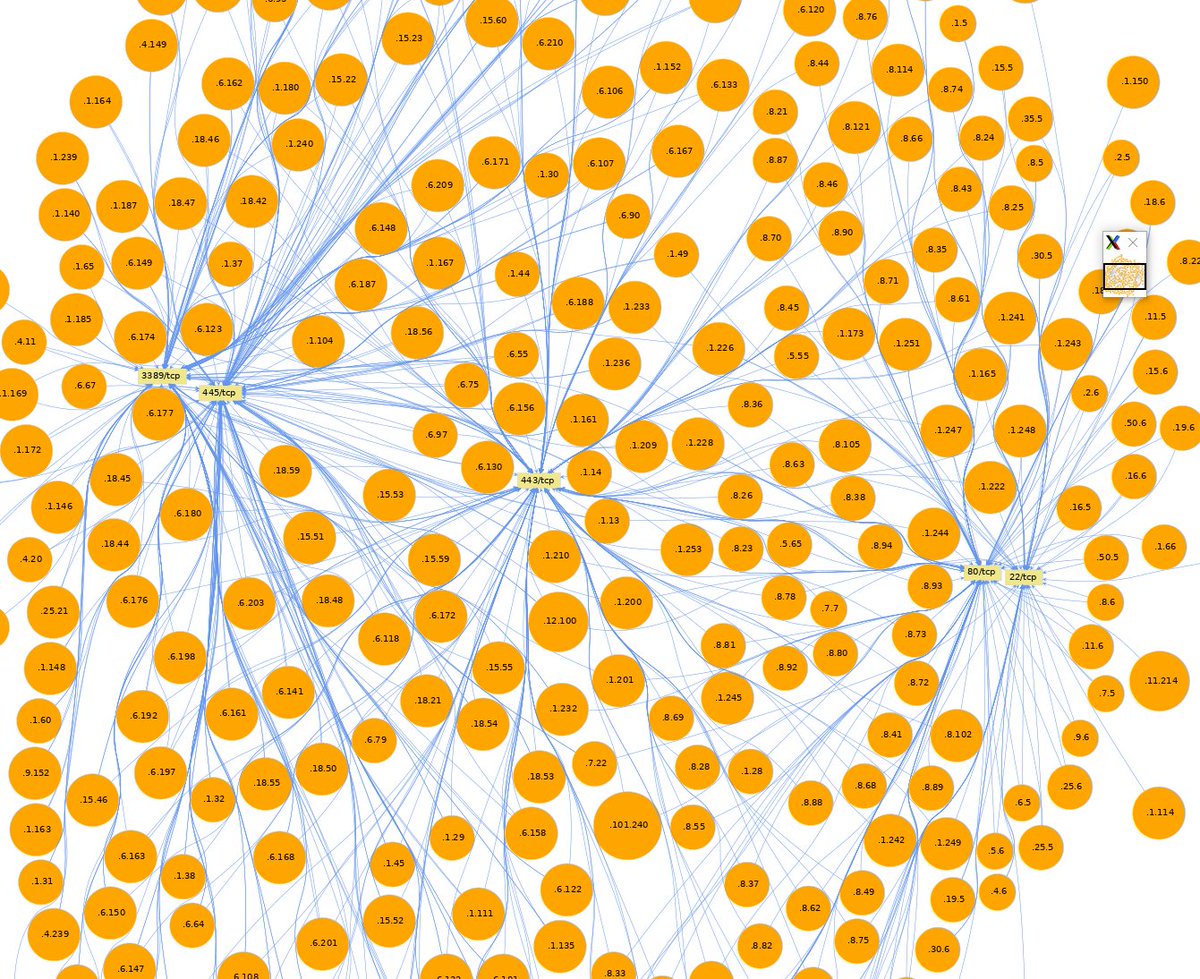
Graficando #nmap / #GraphViz/sfdp. (primer intento/lab). for cai in $(seq 143 230);do nmap -sV -p22 -v -T5 --open -n --min-rate 500 192.168.1.$cai -oG - |sed 's/Host\://' .... ...... sfdp -Tpng -Gdpi=65 -Goverlap=prism | display -


#Suricata_IDS. Traffic_ID / alerts & #GraphViz. 'select(.traffic and .alert) | [.traffic.label,.traffic.id,.src_ip,.dest_ip,.alert.signature]'
![seguridadyredes's tweet image. #Suricata_IDS. Traffic_ID / alerts & #GraphViz.
'select(.traffic and .alert) | [.traffic.label,.traffic.id,.src_ip,.dest_ip,.alert.signature]'](https://pbs.twimg.com/media/E4pM1PRWYAE1_iX.jpg)


Was snooping on (the relatively hungry) VS Code and had another urge to visualize my process tree: shape by state, size by %mem, color by %cpu, clustered by user (zoomed on current). Here VS Code has cooled-off, so a web browser is back on the hog throne. #Graphviz #FunctionalArt

Graficando alertas #Suricata_IDS & #GraphViz (sfdp) jq -c 'select(.alert) | [.src_ip,.dest_ip,.alert.category,.alert.signature,.flow_id]'
![seguridadyredes's tweet image. Graficando alertas #Suricata_IDS & #GraphViz (sfdp)
jq -c 'select(.alert) | [.src_ip,.dest_ip,.alert.category,.alert.signature,.flow_id]'](https://pbs.twimg.com/media/Ff6BnXdWQAEjejM.jpg)
![seguridadyredes's tweet image. Graficando alertas #Suricata_IDS & #GraphViz (sfdp)
jq -c 'select(.alert) | [.src_ip,.dest_ip,.alert.category,.alert.signature,.flow_id]'](https://pbs.twimg.com/media/Ff6DWXDWYAIbMaV.jpg)

Introducing #Neo4j Bloom: Graph Data Visualization for Everyone r.neo4j.com/2w4cjVt via @JeffMMorris #GraphViz #DataViz #GraphTour

Hands-on graph visualization: @KeyLines & #Neo4j by Dan Williams r.neo4j.com/2Jsup5y #GraphViz #DataViz #GraphDatabase


#Powershell module PSGraph 2.1.17, the record release. Adding building blocks for data model diagrams. New keywords. * Record * Row * Entity kevinmarquette.github.io/2018-02-17-Pow… #graphviz

![BlurSpline's profile picture. (me = [random, noob, ideas, graphics, 3d, animation, audio, webgl, three.js, node, rust])[random() * me.length | 0]; Previously Troublemaker @zopim, @zendesk](https://pbs.twimg.com/profile_images/1914922060738187264/jopfuFG_.jpg)
Here you go, the @kafkastreams topology visualization tool you can try out in your browser. Let me know if it works :) Live: zz85.github.io/kafka-streams-… Code: github.com/zz85/kafka-str… #kafka #dot #graphviz #svg #vizjs @RoughLib @confluentinc cc. @preetster @MatthiasJSax @gAmUssA

Something went wrong.
Something went wrong.
United States Trends
- 1. $APDN $0.20 Applied DNA N/A
- 2. $SENS $0.70 Senseonics CGM N/A
- 3. $LMT $450.50 Lockheed F-35 N/A
- 4. Sonic 06 2,716 posts
- 5. Peggy 33.9K posts
- 6. Zeraora 16K posts
- 7. Cory Mills 32.3K posts
- 8. Berseria 5,243 posts
- 9. #ComunaONada 4,059 posts
- 10. Comey 41.4K posts
- 11. $NVDA 46.7K posts
- 12. Cooks 10.5K posts
- 13. #Stargate N/A
- 14. Randy Jones 1,106 posts
- 15. Ryan Wedding 5,812 posts
- 16. Halligan 13.7K posts
- 17. Dearborn 389K posts
- 18. Rick Hendrick 1,374 posts
- 19. Kyler Gordon N/A
- 20. #CurrysPurpleFriday 14.5K posts