


As requested by some of you, there is now a book of these posts! 📗 bookdown.org/IndrajeetPatil… Makes it easy to- 📑 read 🔍 search 🔗 share etc. It ain't pretty, but that's the best I'd do in a day 😅 PRs welcome if you notice that something is amiss 🙏 #rstats #DataScience
Today concludes this 1-year hobby project. There won’t be new posts, so feel free to unfollow, but do keep revisiting! 🙃 With > 22K followers in 365 posts, I guess you enjoyed reading them as I much as I’d preparing them. 😅 Best luck with your jouRneys! 🤞 @patilindrajeets

If you are looking for a fun way to test your #JavaScript knowledge, I have built a simple game. The goal is not to *teach* you JavaScript, but to *test* if you've understood the language features and data structures. indrajeetpatil.github.io/save-indy/ Let me know if you've any feedback.

Today concludes this 1-year hobby project. There won’t be new posts, so feel free to unfollow, but do keep revisiting! 🙃 With > 22K followers in 365 posts, I guess you enjoyed reading them as I much as I’d preparing them. 😅 Best luck with your jouRneys! 🤞 @patilindrajeets
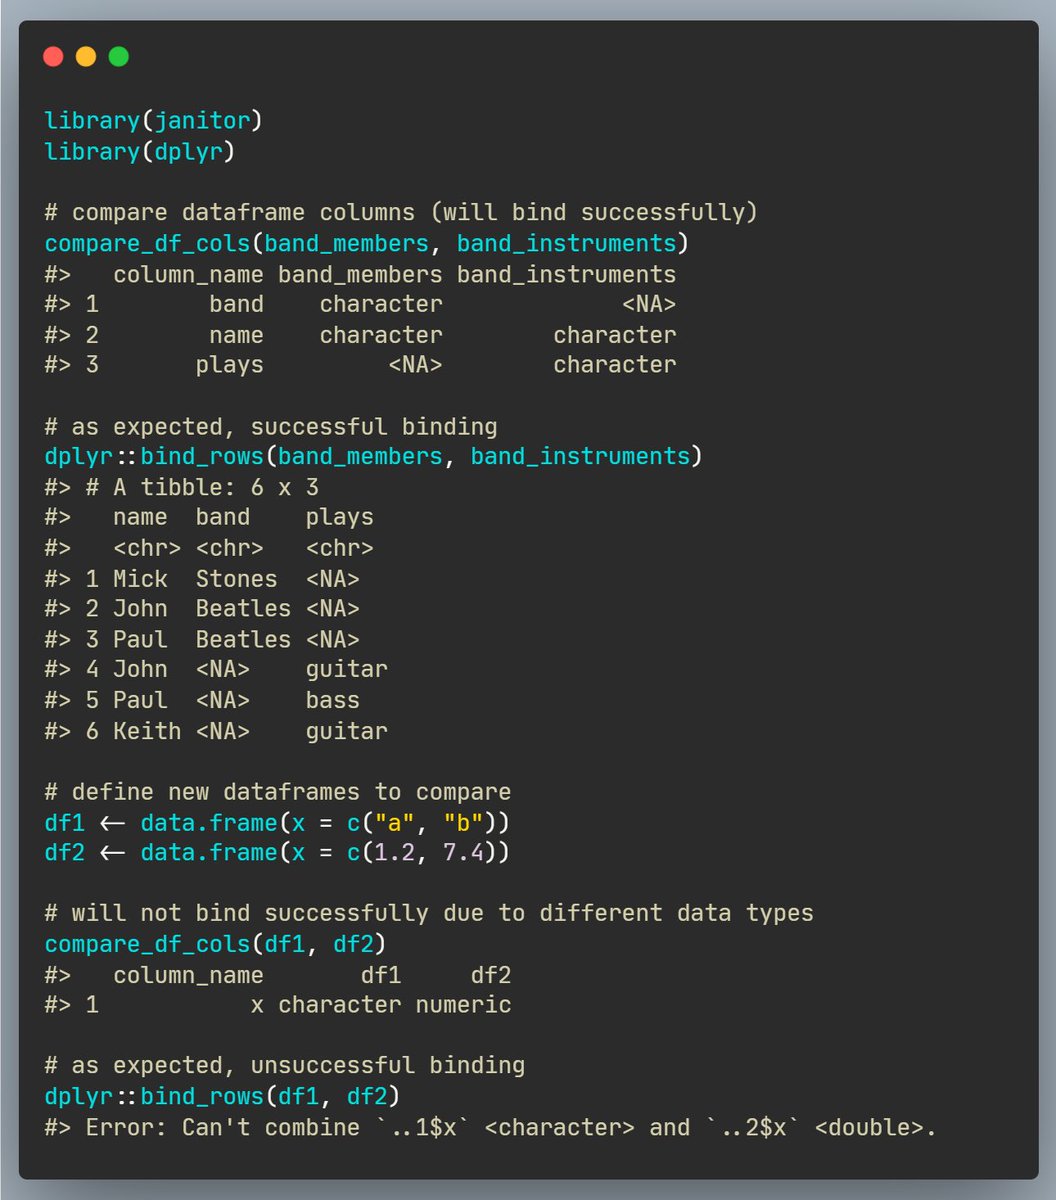
If we need to bind multiple dataframes by rows, we may first wish to check if this can be done successfully. The {compare_df_cols} function from {janitor} 📦 provides a summary of data types to check this! 🍎🍏 sfirke.github.io/janitor/refere… #rstats #DataScience
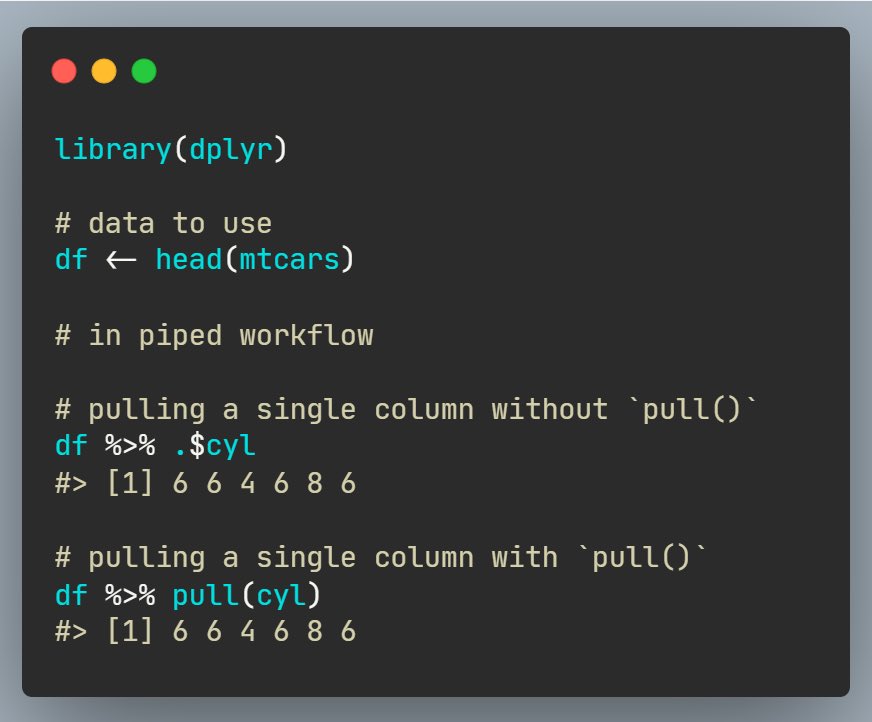
While working in a piped workflow, if you need to extract a single column, the syntax to do so can be a bit cumbersome. The {pull} function from {dplyr} 📦 provides a more readable syntax to this end! 💄 dplyr.tidyverse.org/reference/pull… #rstats #DataScience
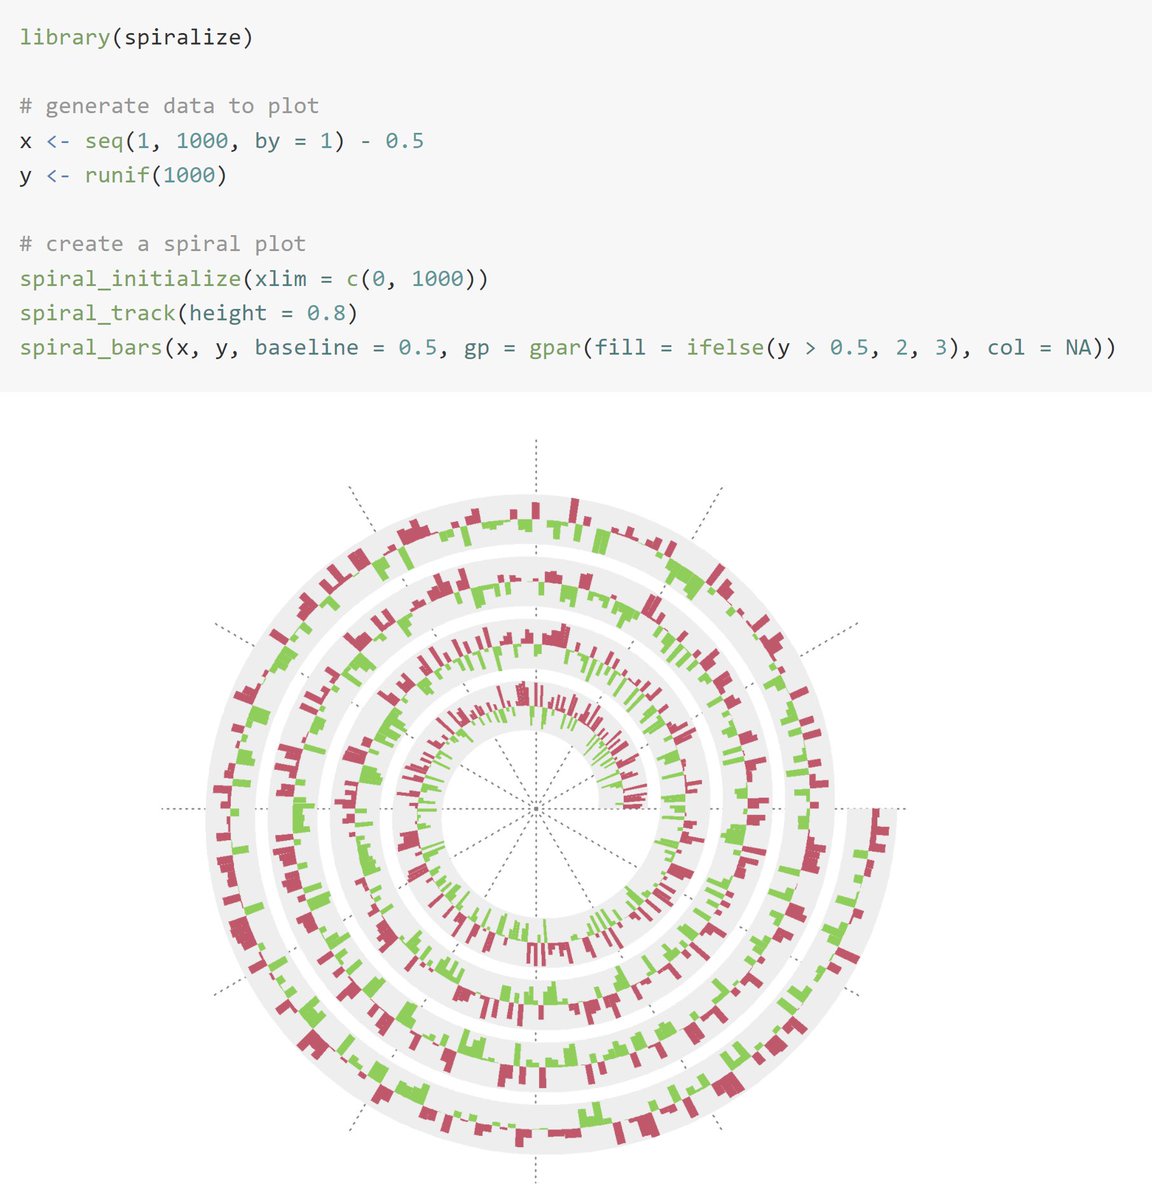
Visualizing data along an Archimedean spiral can efficiently reveal periodic patterns in time series data. The {spiral_*} function family from {spiralize} 📦 draws such spiral plots flexibly! 🌀 jokergoo.github.io/spiralize_vign… #rstats #DataScience
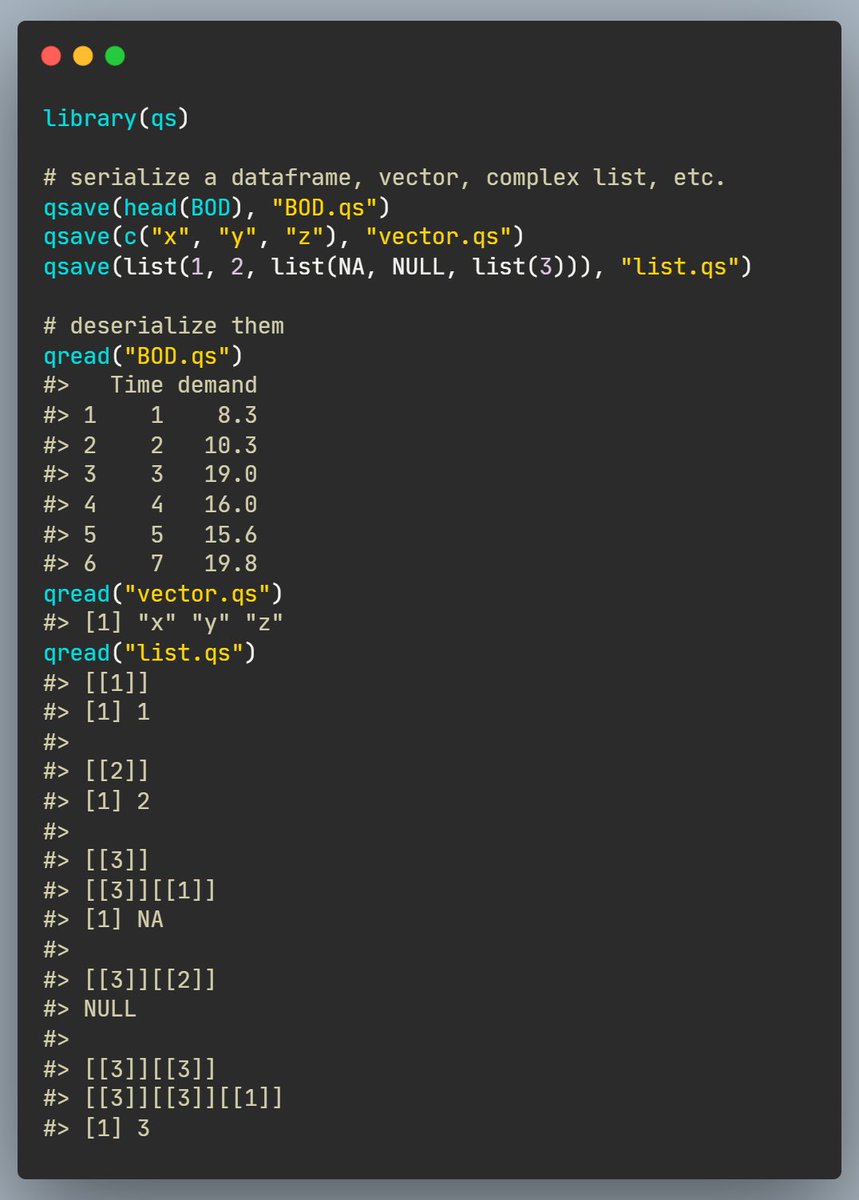
Serialization changes objects to a byte stream that can be saved to a binary file, while deserializing does the reverse. The {q*} function family from {qs} 📦 provides a performant way to serialize or deserialize any R object! ⚡️ rdrr.io/cran/qs/man/ #rstats #DataScience
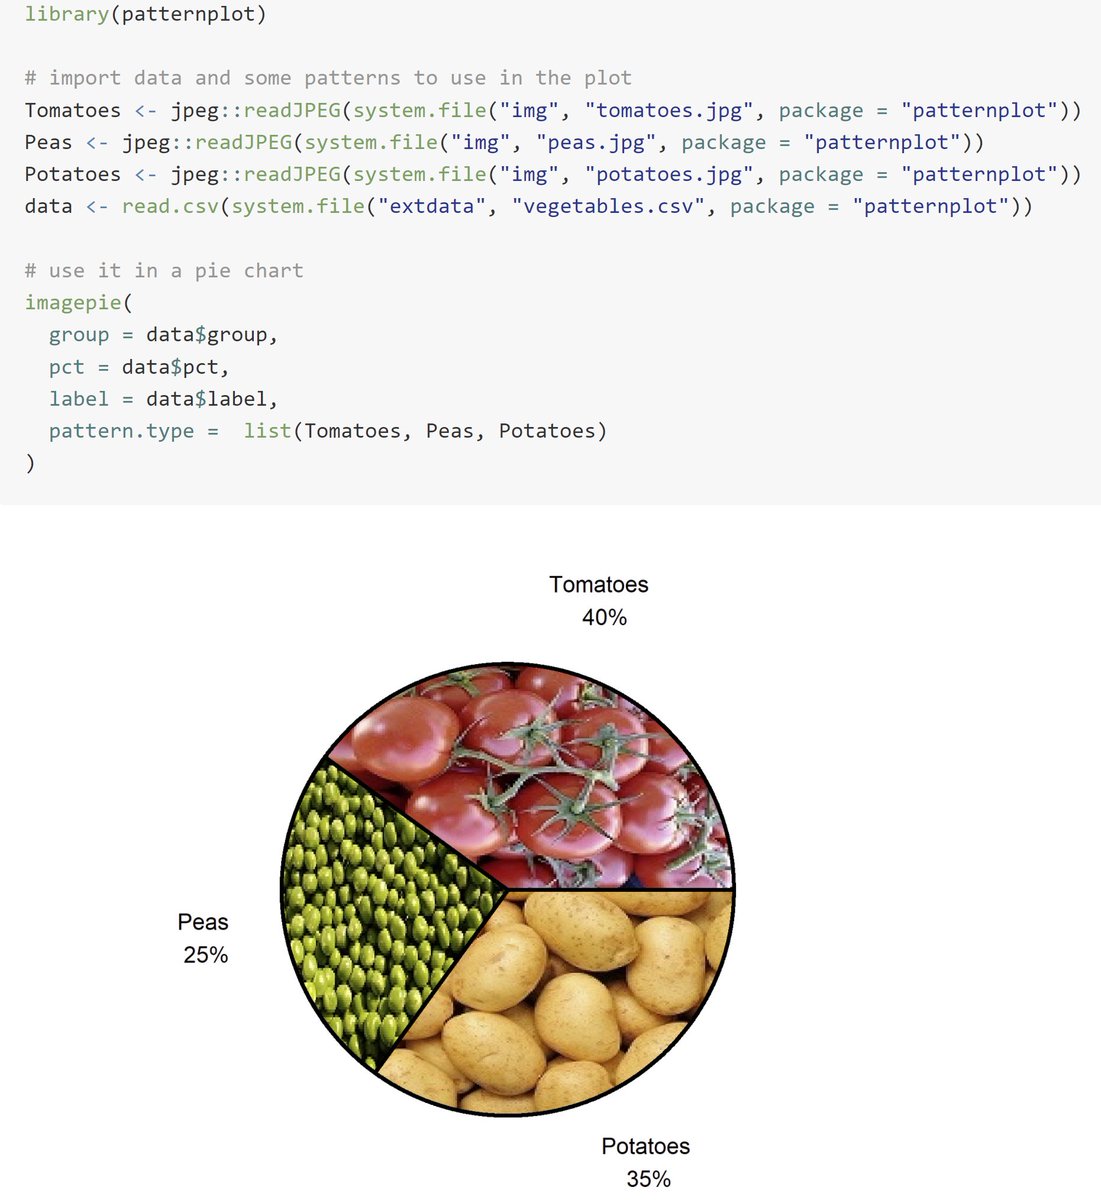
Sometimes you may wish to include some patterns or images in plots for enhanced storytelling. The {image*} or {pattern*} function family from {patternplot} 📦 provides a way to do so! ⚜️ rdrr.io/cran/patternpl… #rstats #DataScience
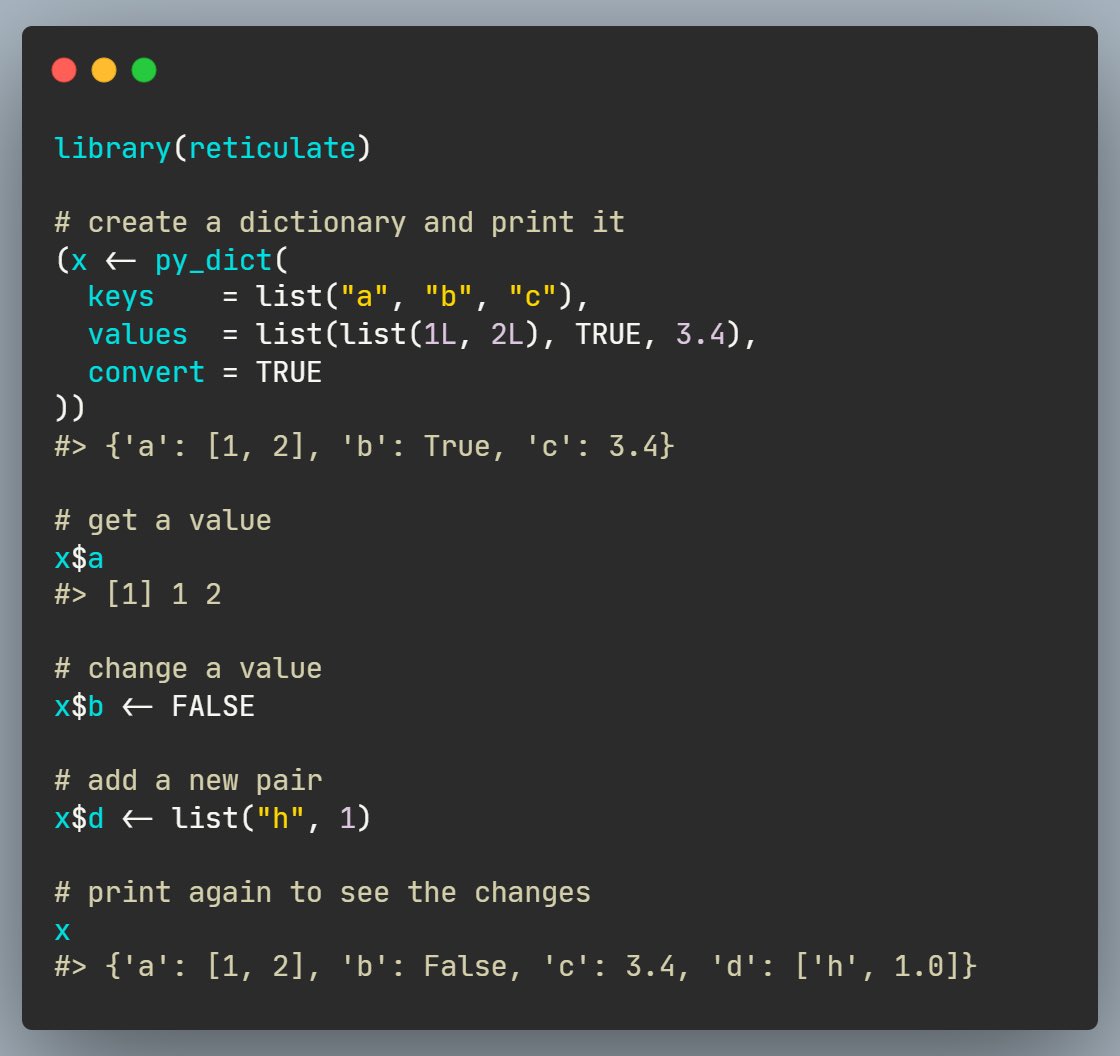
Python dictionary is an unordered data type with key-value pairs that allows accessing values, not by indexing, but via unique keys. The {py_dict} function from {reticulate} 📦 gives you access to this data type in R! 📖 rstudio.github.io/reticulate/ref… #rstats #DataScience
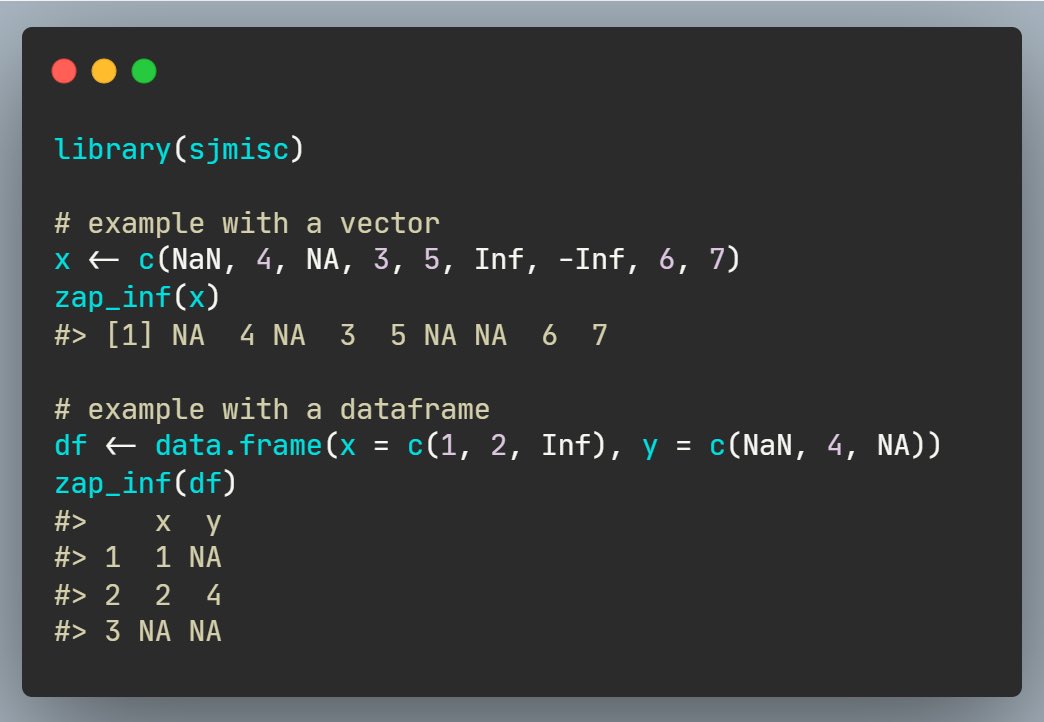
Sometimes, especially in the context of statistical modeling, there might be infinite or NaN's present in outputs that we may wish to replace with NAs. The {zap_inf} helper function from {sjmisc} 📦 does exactly this! ♾ strengejacke.github.io/sjmisc/referen… #rstats #DataScience
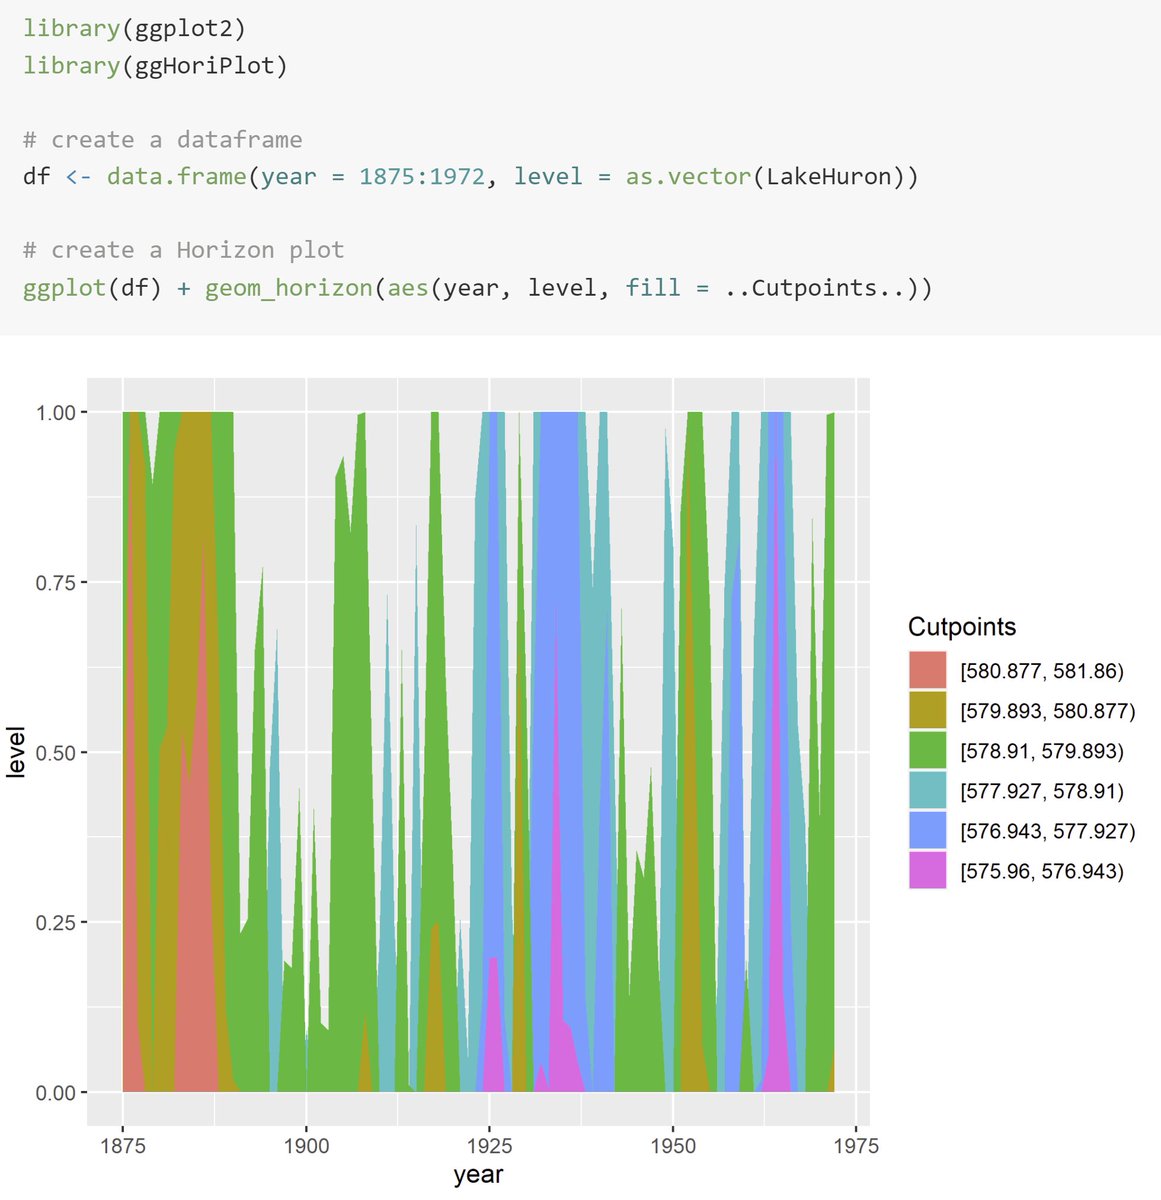
A horizon plot is a compact time-series data visualization to plot and compare different moving values. The {geom_horizon} function from {ggHoriPlot} 📦 provides just the geometric layer! ⬆️⬇️ rivasiker.github.io/ggHoriPlot/art… #rstats #DataScience
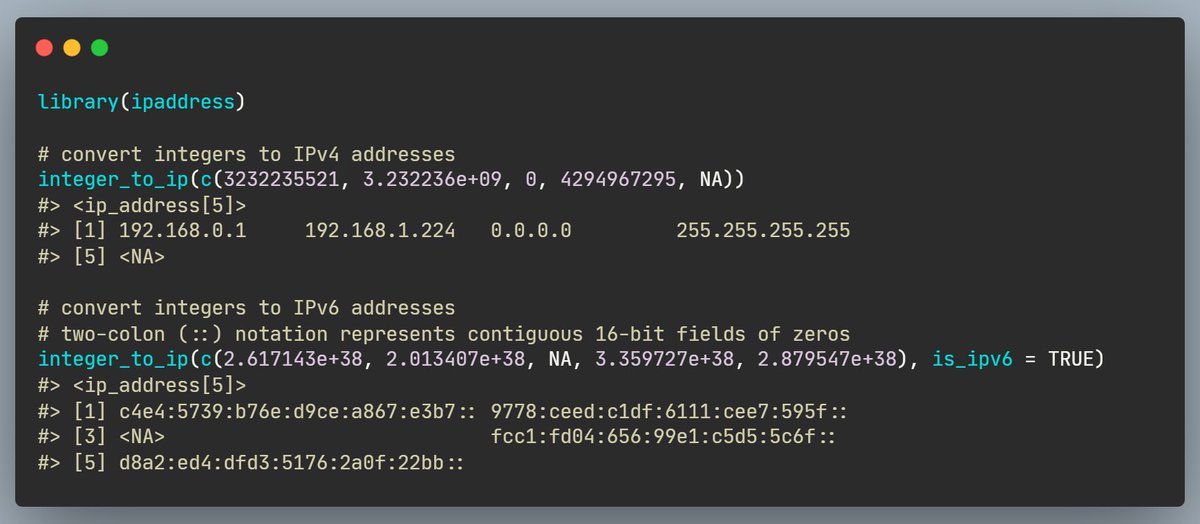
To save space, IP addresses are often stored as integers, and if we receive such data, we may wish to convert them to the familiar human-readable form. The {integer_to_ip} function from {ipaddress} 📦 makes this conversion easy! 🕸 davidchall.github.io/ipaddress/refe… #rstats #DataScience
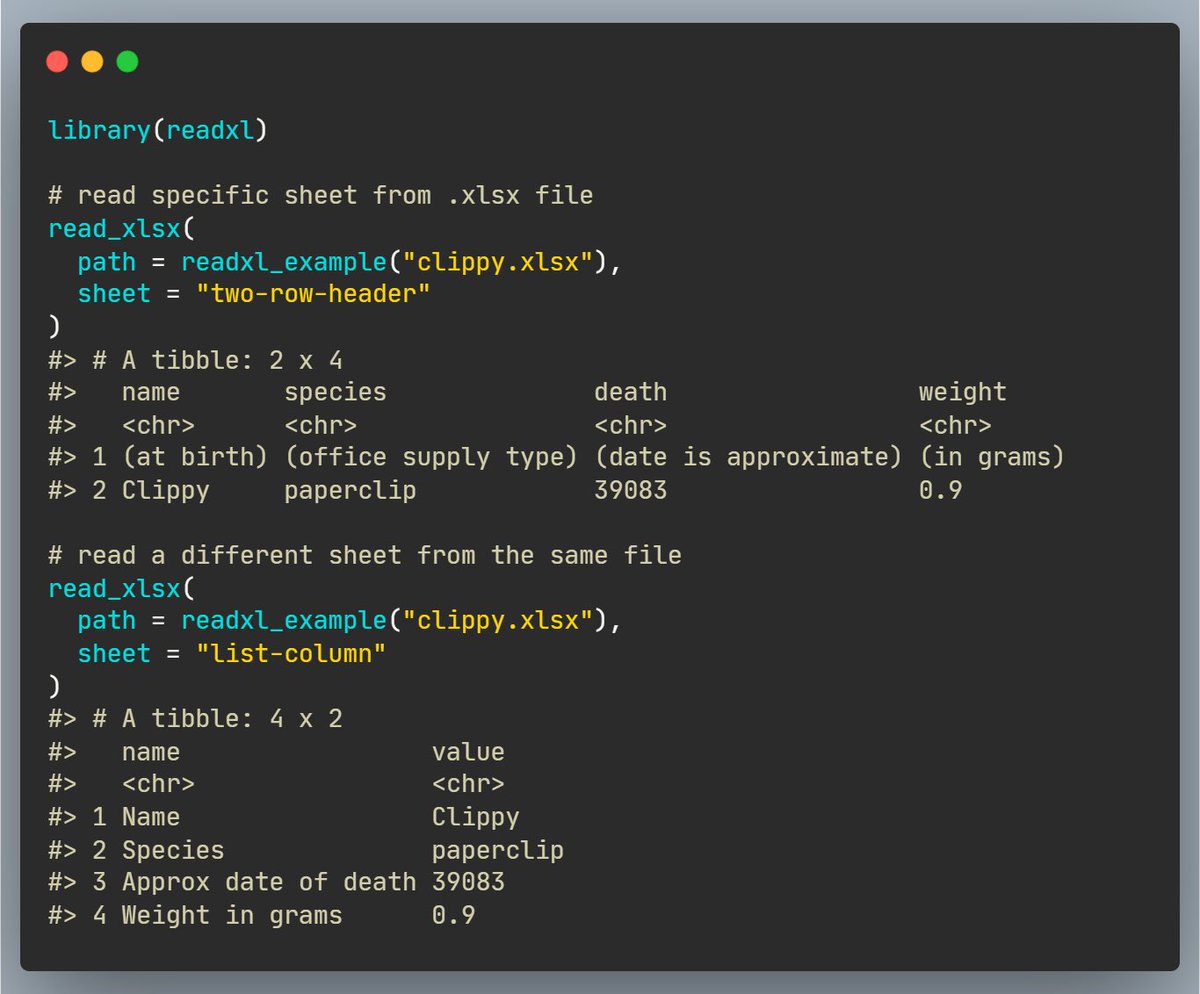
Although often you can easily read data from a single CSV file, sometimes you have to read a dataset stored in one of the Excel spreadsheets. The {read_xlsx} function from {readxl} 📦 provides an easy syntax to do so! 📝 readxl.tidyverse.org/reference/read… #rstats #DataScience
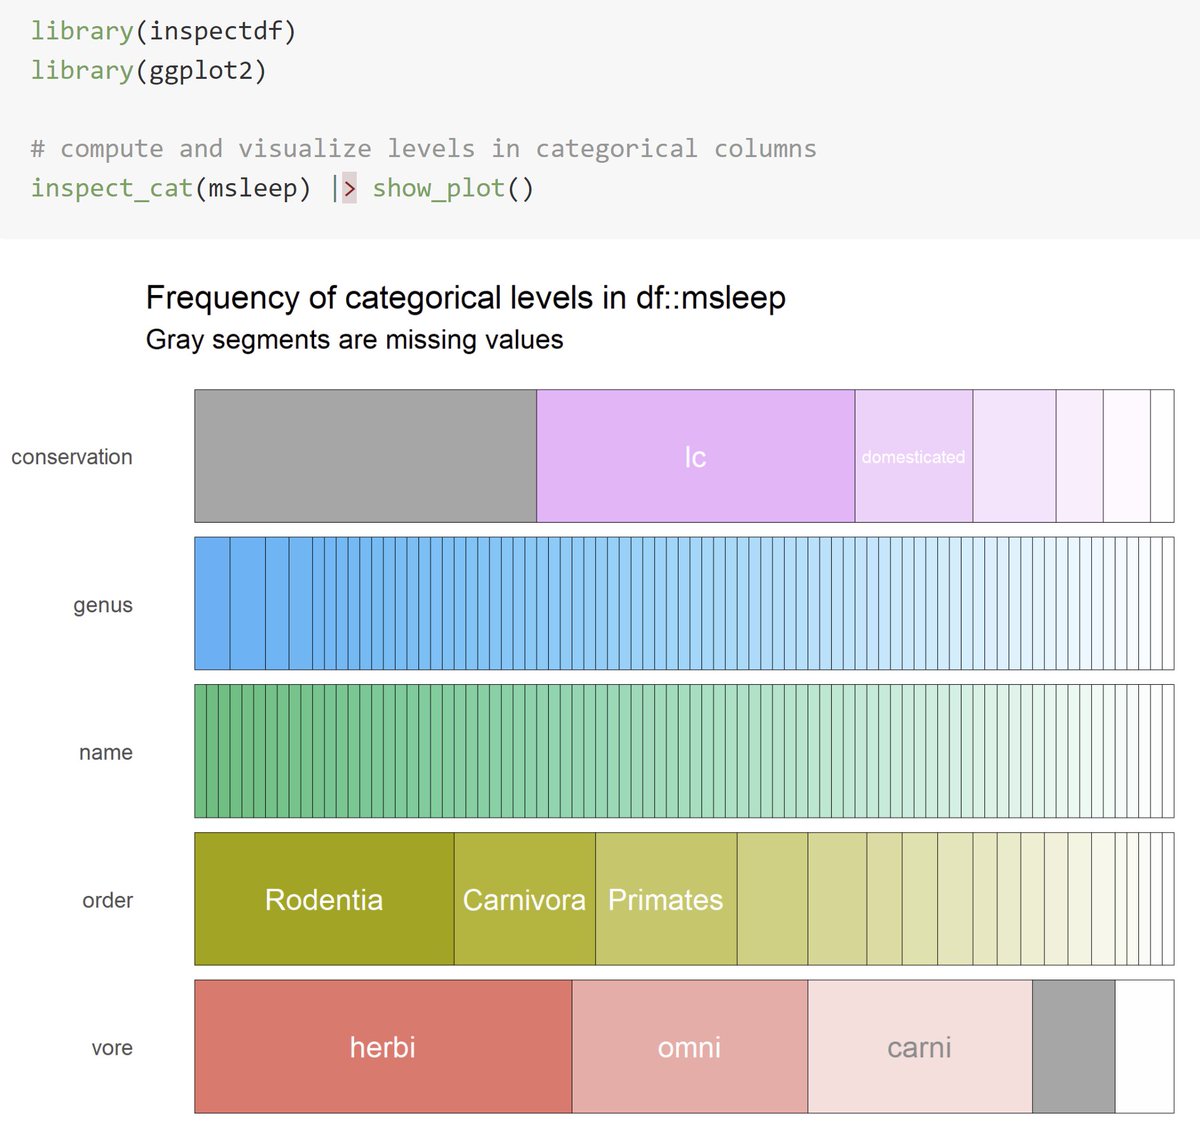
Sometimes you want to quickly compute and visualize frequencies for all categorical variables in the data. The {inspect_cat} function from {inspectdf} 📦 does so, while labeling most frequent levels and highlighting missing data! 📊 alastairrushworth.github.io/inspectdf/arti… #rstats #DataScience
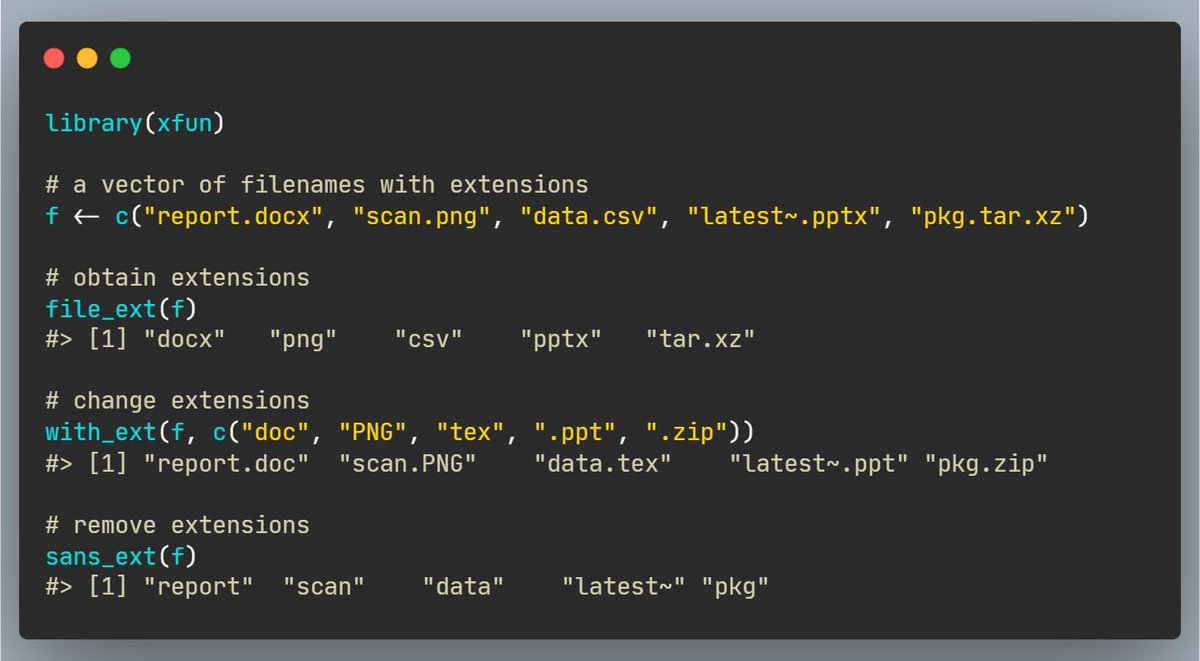
Filename extensions (.py, .csv, .pdf, etc.) decide the characteristics and intended usage of files, and we may wish to work with them further in R. The {*_ext} function family in {xfun} 📦 provides helpers to do so! 🗂 rdrr.io/cran/xfun/man/… #rstats #DataScience
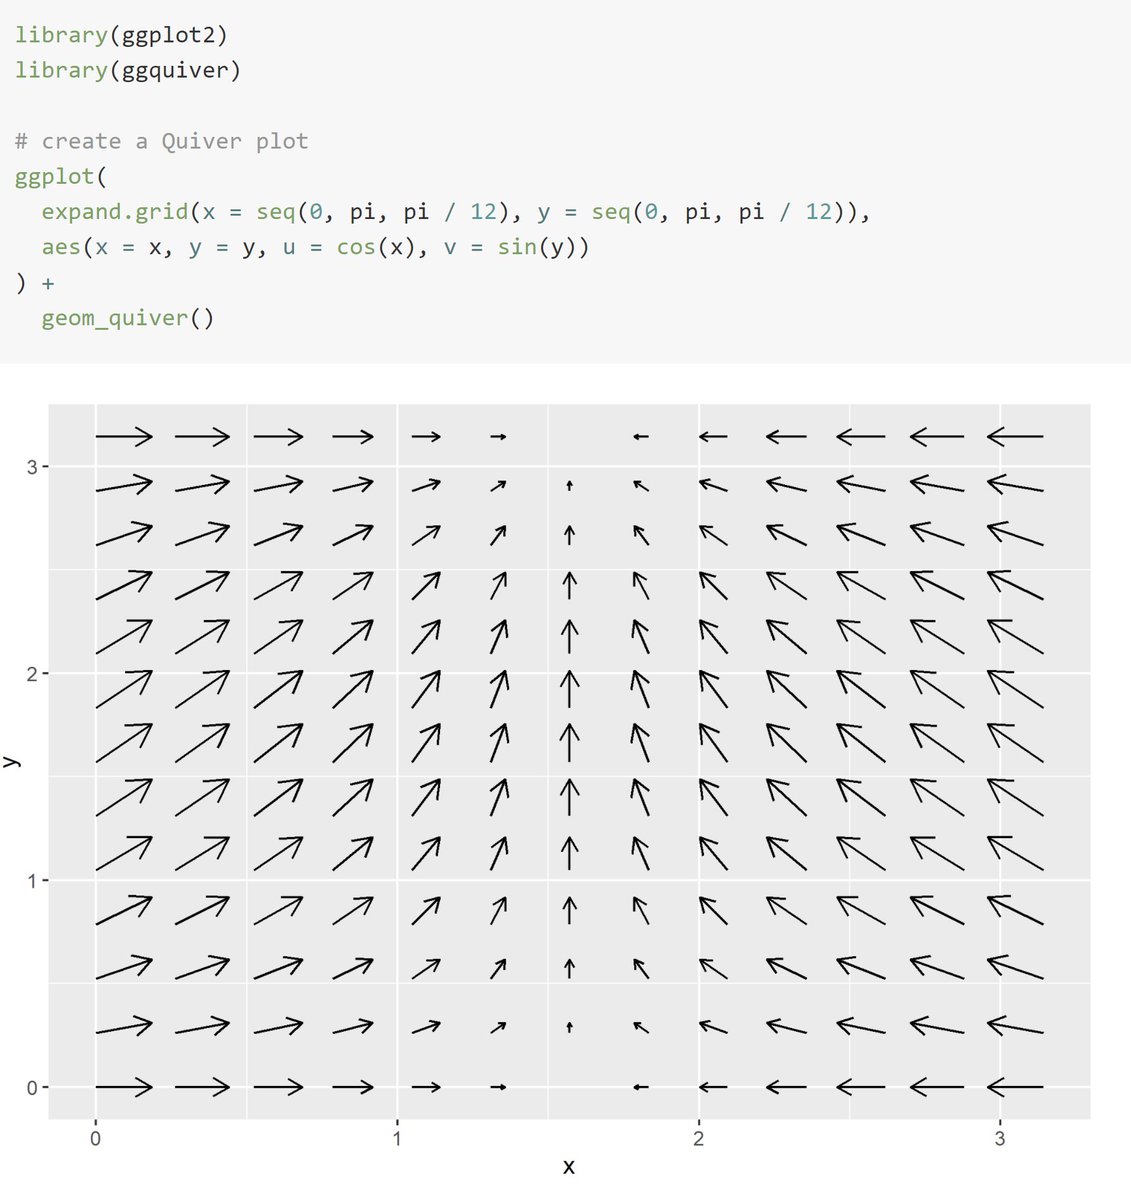
Across disciplines (physics, engineering, etc.), a quiver plot helps visualize vector fields as arrows, and we may need to create such a plot in R. The {geom_quiver} function from {ggquiver} 📦 offers just the geometric layer! 🌪 pkg.mitchelloharawild.com/ggquiver/refer… #rstats #DataScience
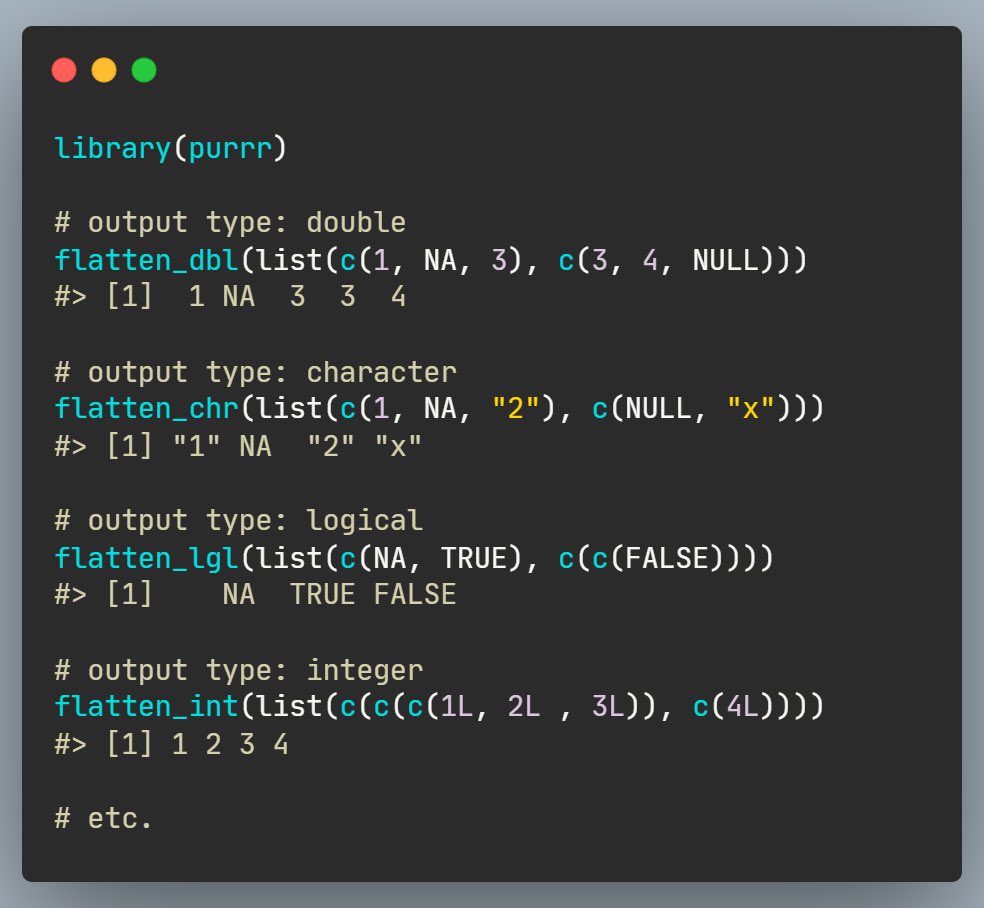
A list is a non-atomic vector, and sometimes you may wish to convert (or flatten) it to an atomic one. The {flatten} function family from {purrr} 📦 provides helpers to do this with type stability! 🗜 purrr.tidyverse.org/reference/flat… #rstats #DataScience
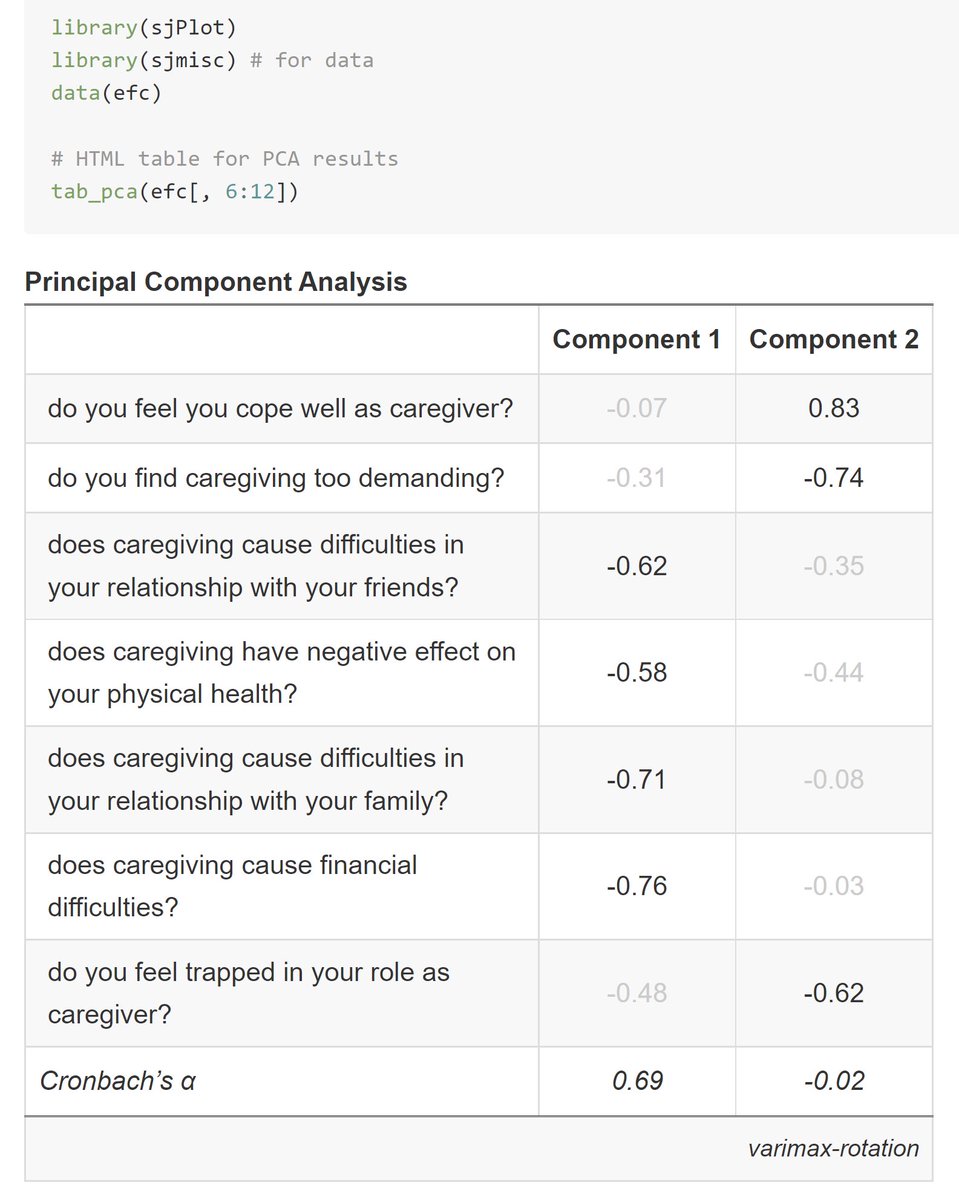
PCA is a popular dimensionality reduction technique and sometimes you may wish to reports its results in a report. The {tab_pca} function from {sjPlot} 📦 produces publication-ready HTML table for PCA with elegant defaults! 📝 strengejacke.github.io/sjPlot/referen… #rstats #DataScience


United States 趨勢
- 1. Jamaica 192K posts
- 2. Tucker 85.6K posts
- 3. #csm218 2,919 posts
- 4. Nelson 26.4K posts
- 5. jungkook 1.12M posts
- 6. #NationalFirstRespondersDay N/A
- 7. Wikipedia 95.4K posts
- 8. Grokipedia 153K posts
- 9. $NOK 2,394 posts
- 10. Hurricane Melissa 146K posts
- 11. Nokia 10.8K posts
- 12. #gachiakuta154 1,032 posts
- 13. Tylenol 20.6K posts
- 14. Chris Evans 4,351 posts
- 15. #DragonBall40th 4,164 posts
- 16. Fuentes 66K posts
- 17. Eastern Pacific 11.2K posts
- 18. Taco Tuesday 14.4K posts
- 19. Blue Angels N/A
- 20. Riley Gaines 94.1K posts


Something went wrong.
Something went wrong.