
R CODER | Jose Carlos Soage 📊
@RCoderWeb
Learn R! #rstats Personal account: @josecarlossoage También en español 😉 🔗 http://r-charts.com 🔗 http://python-charts.com 🔗 http://r-packages.io
You might like


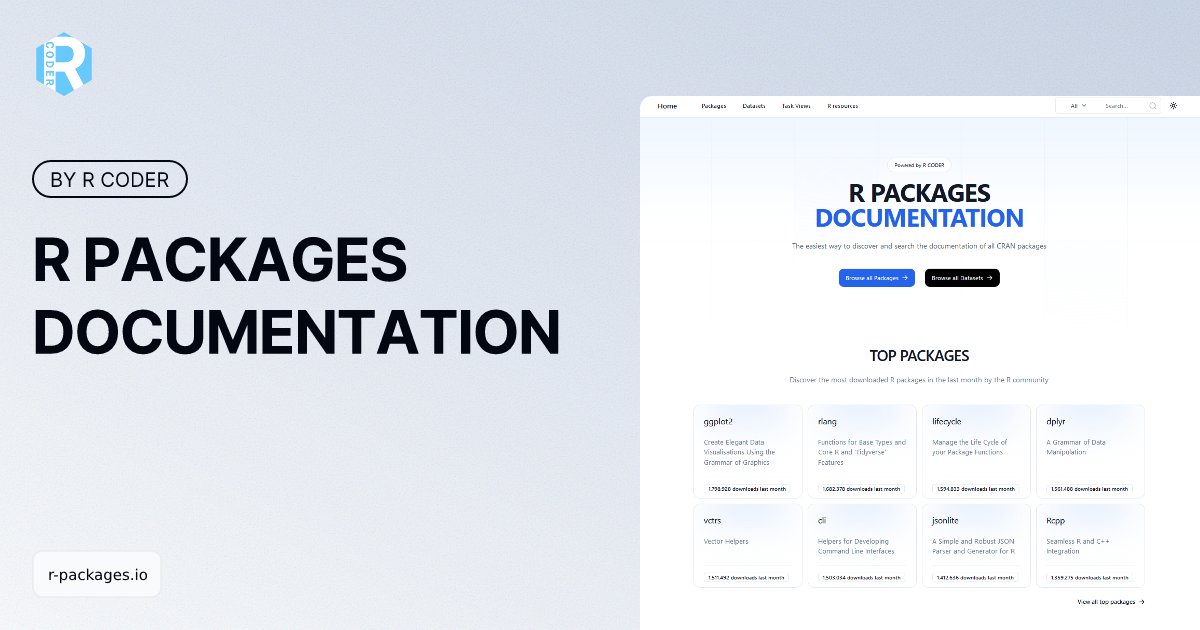
🎉🚀 Introducing R-PACKAGES.IO 🚀🎉 Discover & Explore R Packages, Functions, and Datasets like never before! 🌟 ✨ 20k+ Packages ✨ 400k+ Functions ✨ 40k+ Datasets The ultimate resource for R developers! 📊🔍 🔗 r-packages.io #RStats
[Tip of the day] Write your R scripts like others will read them, because future you is someone else Comment generously, name clearly #rstats #CodeStyle
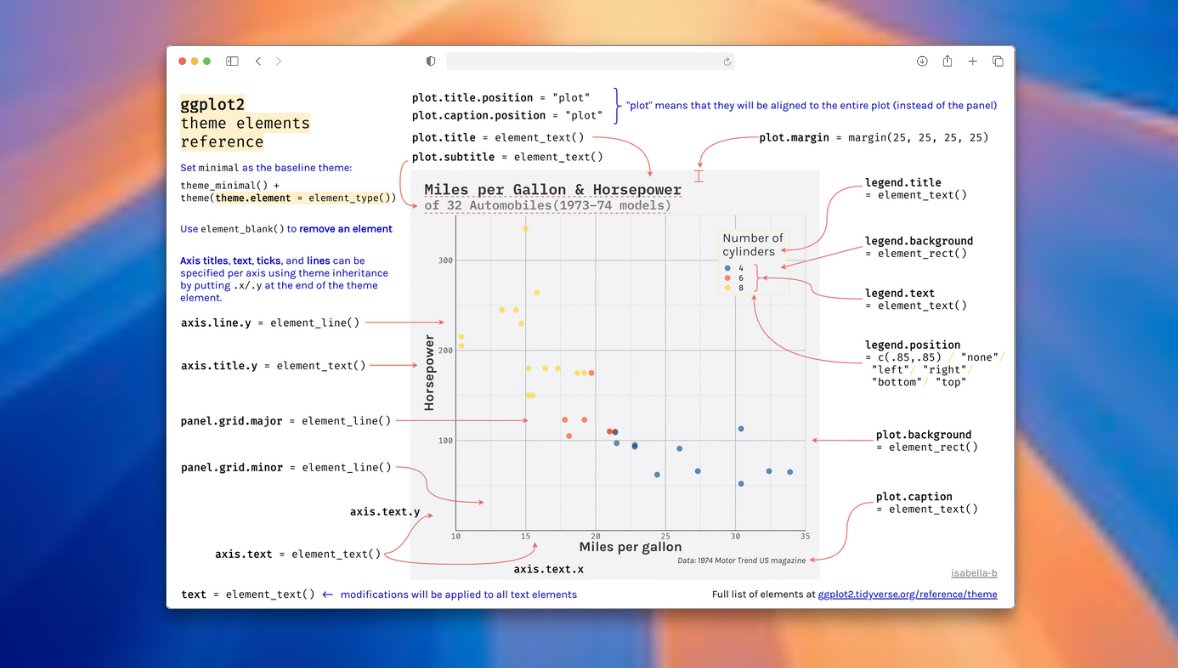
Just found this amazing {ggplot2} reference card – a lifesaver for customizing plots #rstats #dataviz
💡 Try {ggspatial} to easily add scale bars, north arrows, and basemap layers to your ggplot2 maps 🔗 r-packages.io/packages/ggspa…

💡 Struggling to get help with your R code online? Try {reprex} package to create a reproducible example that shows exactly what your code does Just write your code, run reprex(), and paste the result. Easy, clean, helpful. 👉 r-packages.io/packages/reprex

🌈 Try rainbow parentheses! They color each level of nesting so you can spot mismatches instantly. A simple trick, a huge difference for debugging 👇 #rstats #rstatsTips #DataScience #Productivity

🧵 How to clean data like a pro with dplyr and tidyr in R If you're still struggling with messy datasets or spending hours on manual cleanup… This thread is your shortcut to clean, tidy, analysis-ready data 👇 #rstats #DataCleaning #DataScience

📢 Si eres de España o LATAM y te interesa el mundo de la ciencia de datos… En mi LinkedIn personal (en español) comparto ideas, herramientas y reflexiones sobre IA, data science y emprendimiento 👤 ¿Conectamos? 👉 linkedin.com/in/jose-carlos…
🚀 Want to write faster and more efficient R code? Check out Efficient R Programming — a practical guide packed with tips on writing clean, optimized, and production-ready R code. 🔗 csgillespie.github.io/efficientR/ #rstats #DataScience #Rprogramming #Productivity

🎯 Ever wondered what really sets apart a Data Analyst, Data Scientist, Data Engineer, and ML Engineer? They might sound similar, but each role has a different focus, skill set, and mission Let’s break it down 🧵👇 #DataScience #rstats #Statistics

Found a great cheatsheet with different ways to visualize percentages and parts of a whole 📊 (Pie charts are just the beginning…) And if you work in R, I’ve gathered real code examples here: 🔗 r-charts.com/part-whole/ #rstats #DataViz #ggplot2 #DataScience

👋 If you enjoy the R content I share here, you might also like what I post on my (new) personal account: data science, AI, and entrepreneurship Follow me at 👉 [@josecarlossoage ] Or on LinkedIn (in Spanish) 👉 linkedin.com/in/jose-carlos… #rstats #datascience
![RCoderWeb's tweet image. 👋 If you enjoy the R content I share here, you might also like what I post on my (new) personal account: data science, AI, and entrepreneurship
Follow me at 👉 [@josecarlossoage ]
Or on LinkedIn (in Spanish) 👉 linkedin.com/in/jose-carlos…
#rstats #datascience](https://pbs.twimg.com/media/GqQIvmuWUAAyoui.jpg)
🔍 Drowning in forgotten TODOs in your R scripts? The {todor} package scans your code for #TODO, #FIXME, #NOTE, and more — so you can track your tasks like a pro ✅ 📌 Great for big projects 🧠 Never miss a fix 💻 Lightweight and easy to use 👉 install.packages("todor")

🦸♂️ Meet the newest superhero in town — Captain R! Fighting messy data, one line of code at a time 💪📊 Powered by tidyverse. Shielded by ggplot2 #rstats #DataScience #SuperCoder

[FREE R BOOK] 🚀 "Tidy Modeling with R" by Max Kuhn & Julia Silge is a must-read! 📘 Learn how to streamline your ML workflow using the tidymodels framework 🔗 tmwr.org #RStats #MachineLearning
![RCoderWeb's tweet image. [FREE R BOOK]
🚀 "Tidy Modeling with R" by Max Kuhn & Julia Silge is a must-read! 📘 Learn how to streamline your ML workflow using the tidymodels framework
🔗 tmwr.org
#RStats #MachineLearning](https://pbs.twimg.com/media/GmZoggta8AU0VfJ.jpg)
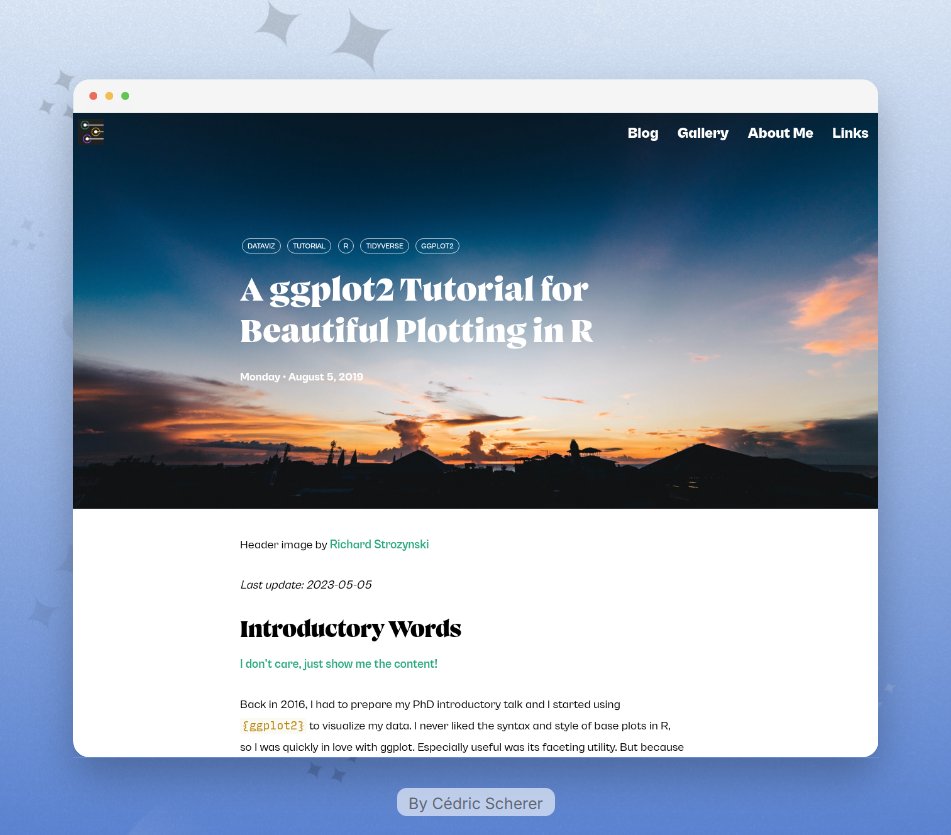
🚀 This #ggplot2 tutorial by @CedScherer never gets old! 📊 One of the best resources to master beautiful plotting in R 🔗 cedricscherer.netlify.app/2019/08/05/a-g…
[FREE ONLINE BOOK] 📗 R Markdown: The Definitive Guide Learn how to create dynamic reports, presentations, and interactive documents with R Markdown! 🔗 bookdown.org/yihui/rmarkdow… #rstats #DataScience
![RCoderWeb's tweet image. [FREE ONLINE BOOK] 📗
R Markdown: The Definitive Guide
Learn how to create dynamic reports, presentations, and interactive documents with R Markdown!
🔗 bookdown.org/yihui/rmarkdow…
#rstats #DataScience](https://pbs.twimg.com/media/GmPAZPXXcAAD6hf.jpg)

I've been trying out different ways of creating dumbbell charts with {ggplot2}. For this one I used a 'wide' summary table for the source data (which feels more intuitive to me). The method owes a lot to this tutorial from @RCoderWeb: r-charts.com/distribution/d… #rstats #ggplot2

[FREE BOOK] Statistical Inference via Data Science: A ModernDive into R and the Tidyverse Written by Chester Ismay and Albert Y. Kim 🔗 moderndive.com
![RCoderWeb's tweet image. [FREE BOOK]
Statistical Inference via Data Science: A ModernDive into R and the Tidyverse
Written by Chester Ismay and Albert Y. Kim
🔗 moderndive.com](https://pbs.twimg.com/media/Gkp7NgmWcAAeCsJ.jpg)

🌍📊 Geocomputation with R is a free online book that covers everything from spatial data handling to advanced GIS analysis using R! 🚀📌 Check it out here: r.geocompx.org #RStats #GIS #Geocomputation


United States Trends
- 1. Comet 27.4K posts
- 2. Oviedo 4,701 posts
- 3. Fame 56K posts
- 4. Amon Ra 1,105 posts
- 5. TPUSA 85.8K posts
- 6. Matt Campbell 1,572 posts
- 7. The Password 3,345 posts
- 8. Letitia James 16.1K posts
- 9. Amorim 54.7K posts
- 10. The Supreme Court 31.8K posts
- 11. #MissVenezuela2025 1,042 posts
- 12. Teslaa 2,041 posts
- 13. #LightningStrikes N/A
- 14. Spaghetti 11K posts
- 15. fnaf 2 17.4K posts
- 16. #TakoTori1stConcert N/A
- 17. ARSB N/A
- 18. Morgan Geekie N/A
- 19. Jhostynxon Garcia 1,196 posts
- 20. #drwfirstgoal N/A


Something went wrong.
Something went wrong.