
Trading Technicals
@tech_trader_jse
Buy at support, sell at resistance. Views do not constitute financial advice. Dm for custom pinescript strategy builds
You might like


With all the massive panicking in crypto right now, this looks ready for a move up again

Palatier looking good here, PLTR pulling back to the text book trendline

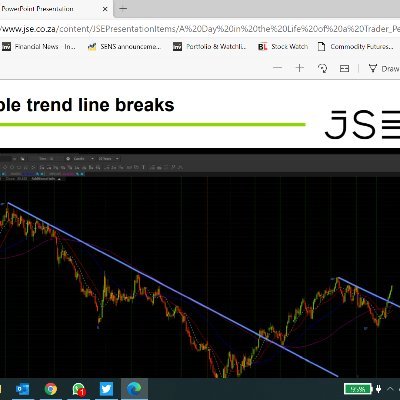
Everyone is talking as if it's all over for the markets, but looking at the charts, there's the same pattern on multiple assets, and it looks great.


The Bloomberg Commodities Index is one of the best-looking charts.

The amount of time I spend seeing this every time I open discord is wild @discord , surely there doesnt need to be this many updates all the time

Well done @sama and @OpenAI gpt-5 codex is phenomenal, you guys hit it out the park and into the car park
Not every crash happens at sky-high valuations 📉 1929 & 2000: S&P 500 P/E >30–45× → valuation bubbles. 1973, 1987, 2008, 2020: P/Es ~15–20× → crashes from shocks (oil, credit, pandemic). Today: U.S. ~30× (stretched), Europe & Japan ~15–16× (normal). Looks more U.S.-centric

Take the last 30 trading days of $SPX. Scan every 30-day window in history. Score similarity using (1) Pearson and Cosine on daily returns and (2) Euclidean distance on z-scored cumulative log-returns. Rank by composite score, then show each analog’s 30-day forward return.

30-day analog check on $SPX: best match to current path is 2021-07-28 to 2021-09-08. I overlaid that period and appended 2021’s next 30 days (dashed). That analog ended -2.7% by 2021-10-08. Not a forecast—just context. Chart 👇 #SPX #Quant #Seasonality

🚀 $XLM compressing under long-term downtrend resistance since 2021. Price testing the trendline again — a clean break above $0.4568 could ignite moves toward $0.66, then $0.78–0.83 (Fib 1.414 / 1.618). Momentum building… next candles could decide the macro shift. 📈 #XLM

🚨 $FOXYUSDT daily Renko H&S top inside a steep down‑channel just completed — price flushed to the 1.618 fib (~0.00133) before a +20 % bounce. Bears rule until a daily close > 0.0040 (neckline / liquidity). Clear that and 0.02 comes into view. DYOR. #FOXY #crypto

🚨 $ADA nears decision point! 🚨 Symmetrical triangle on daily Renko chart. Breakout looms, targeting Fibonacci zones at $1.00-$1.40. Stay alert. 📈👀 #ADA #Cardano #Crypto #TechnicalAnalysis

$MSTR Renko ramp 🚀 After spring‑loading off the 1.414/1.618 fib cradle ($280‑260), price has punched up to $450 and is cruising the upper half of its rising channel. Next waypoint: the 0‑fib / rail confluence near $590‑610. Hold > $400 and bulls keep the throttle wide open;

$AMZN Renko rocket 🚀 $180 supply flipped to support; price at $221 is drilling the median line. Upper‑channel target: $245‑250. Hold > $210 and bulls stay in charge; drop back under $210 and the $175‑165 fib 1.414/1.618 zone becomes the reload area. #AMZN #Renko #TA

$BRK.B still riding its 4‑year Renko up‑channel 🔼 Price just kissed the lower rail near $475, right on a cluster of 1.414/1.618 fib supports. Hold this zone & the median line points to ≈ $600 next. Lose it and $450 becomes the line in the sand. Trend intact, risk defined.


United States Trends
- 1. Broncos 63.5K posts
- 2. Bo Nix 17.6K posts
- 3. yeonjun 171K posts
- 4. Geno 17.9K posts
- 5. $SMILEY N/A
- 6. Sean Payton 4,621 posts
- 7. Kenny Pickett 1,489 posts
- 8. #TNFonPrime 3,958 posts
- 9. DANIELA 34.2K posts
- 10. #NOLABELS_PART01 71K posts
- 11. Chip Kelly 1,940 posts
- 12. Jalen Green 6,913 posts
- 13. Bradley Beal 3,285 posts
- 14. NO LABELS NOVEMBER 23.6K posts
- 15. #criticalrolespoilers 4,396 posts
- 16. Pete Carroll 1,869 posts
- 17. TALK TO YOU OUT NOW 23.9K posts
- 18. Jeanty 6,445 posts
- 19. byers 28K posts
- 20. #TSTheLifeofaShowgirl 1,578 posts
You might like
-
 GregKatzenellenbogen
@GregKatzSPI -
 Igor Marinkovic
@ALSITRADER -
 GraemeB
@Graeme_AB -
 Storm Trading
@Storm_Trading -
 🌈 /\/¯¯¯¯¯\/\ ☮️
@gotacutloose -
 Unum Capital
@UnumCapital -
 traderdan
@traderdandurban -
 Shaun Murison
@ShaunMurison_RS -
 Cratos Capital
@CratosCapital -
 Marco Olevano, CFA
@MarcoOlevano -
 Gavin Keates
@GavinKeates -
 Trader1137
@Trader1137 -
 Garth Mackenzie
@TradersCorner -
 Share_Trader
@KoosKanmar -
 Lıza Maas
@ESMaas62
Something went wrong.
Something went wrong.