
The Data Incubator, A Pragmatic Institute Company
@thedatainc
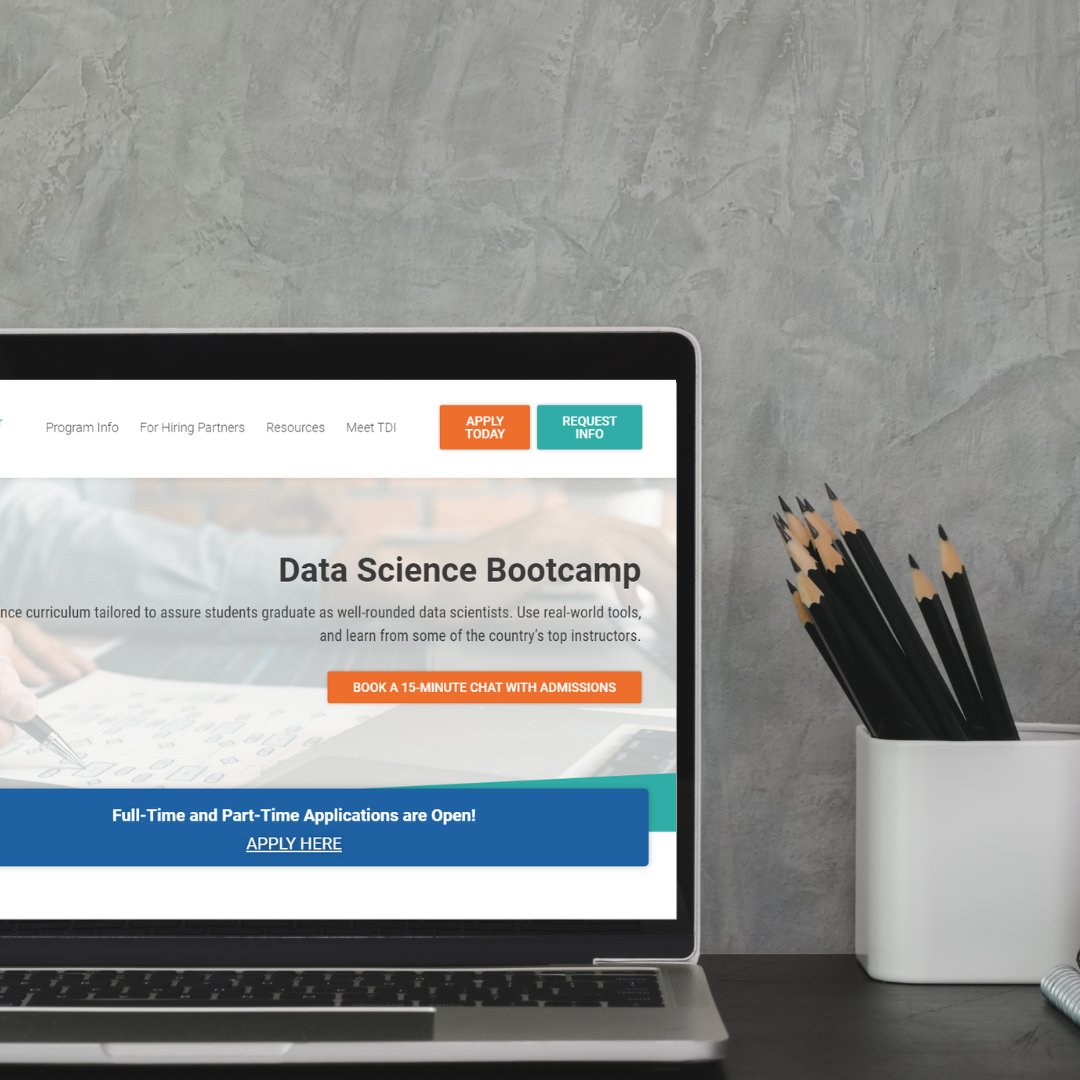
The most immersive, hands-on data science bootcamp in the world. Work with leading data science instructors, live code and real-world data sets.
You might like


Missed our latest data demo on Machine Learning Operations? You can catch the replay and embark on a journey through the landscape of MLOps as instructor Brian Spiering will be your guide through this immersive experience 👨🏫 📹 Watch the Replay: loom.ly/FXl8KZI
Ever wondered what "variance" means in the world of statistics? 🤔 Let's dive into this essential concept! Variance is a measurement of the spread of numbers in a data set. 🔗 Join us in unraveling the secrets of variance in our newest glossary term! loom.ly/FpDTwSk
Vector Databases Demystified
Happening Tomorrow: Vector Databases Demystified ⌛ Our live data demo will start tomorrow at 2pm ET (11am PT). You don't want to miss it! 👉 RVSP: loom.ly/jS4r02M
Why would Scala make a good comedian? ...it’s capable of producing one-liners! Learn more about what is scala in our latest glossary term here! 🔍 loom.ly/b8Til7s

We're here to help provide a simpler path to a high-paying data science career—without the financial risks of traditional higher education. We've partnered with Leif to provide you with a great way to finance your training. Learn More! loom.ly/jtth_eg

Live Data Demo: Vector Databases Demystified 🚀 Join us on 10/25, at 2pm ET (11am PT) for a live data demo! Hosted by TDI instructor, Brian Spiering, will guide you through the basics of vector databases and a few use case scenarios. Register Now! loom.ly/jS4r02M
Overfitting is like a data trap where a machine learning model becomes overly complex, fitting the training data so closely that it loses its ability to generalize new data. ..it's like memorizing a textbook instead of understanding the subject 📖 👀 loom.ly/UrtLSko

Delving Deeper into Data: What is Time Series Data? ⏰ Time Series Data is information collected over different periods that allows you to see variables in that data at specific intervals. Learn why it matters here 🔗 loom.ly/YiuxyKU

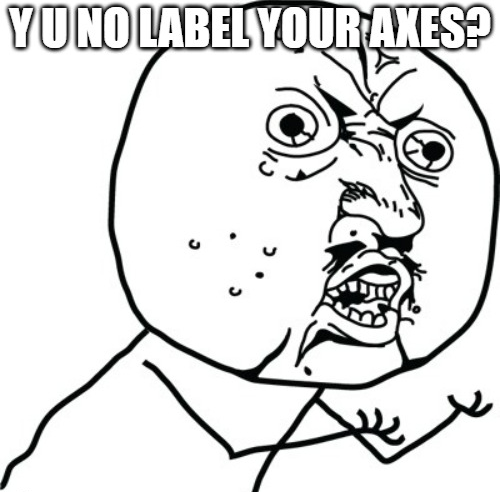
🤣 Y U No Label Your Axes? When it comes to data visualization, there's one golden rule: Always label your axes! 📈
🌲 What is Random Forest? 🌲 Random Forest is a powerful machine learning algorithm that uses an ensemble of decision trees to make accurate predictions and classifications. Learn more about random forest here 👉 loom.ly/HBb7OOY

Ever wondered about the magic behind data organization? It's all thanks to Relational Databases! Learn more about it here 👀 loom.ly/r9JbwJI
The Data Incubator’s Data Science Bootcamp is an immersive data science program for those with STEM degrees and a passion for data. Don't wait! Deadline is October 27 🗓️ loom.ly/N9XUOjo
Data lingo can be a maze, but don't worry—we're here to guide you through it. 📌 Discover what is Naïve Bayes and how this powerful algorithm fuels data predictions in our latest glossary term. Read more here 🔗 loom.ly/9aVjbWc

⏳ Today is the last day to apply early to our Data Science Bootcamp! - Save on your tuition costs - Get a head start on your training - Receive early access to strengthen your Python skills - Have early access to resume writing services Apply Now! loom.ly/N9XUOjo

Demystifying Data: What is Regression? 📌 Regression is a powerful statistical technique used to understand and predict relationships between variables. Learn more about what regression is here 👀 loom.ly/_Mr4GIU

Ready to embark on your data-driven adventure? 🌐 Your data success story begins with the right program. Let's get started together! 👇 Click the link to download loom.ly/TGB7x8k

Thinking about switching gears from software engineering to data science? Our latest blog has you covered! 🧠 👉 Continue reading the blog here! loom.ly/SQK0Jhg
Hiring qualified data scientists, data engineers and data analysts is hard. We train the best data scientists, data engineers and data analysts available today – and ensure they’re ready to use their skills to enhance businesses like yours. Learn more! loom.ly/D8I2nkY
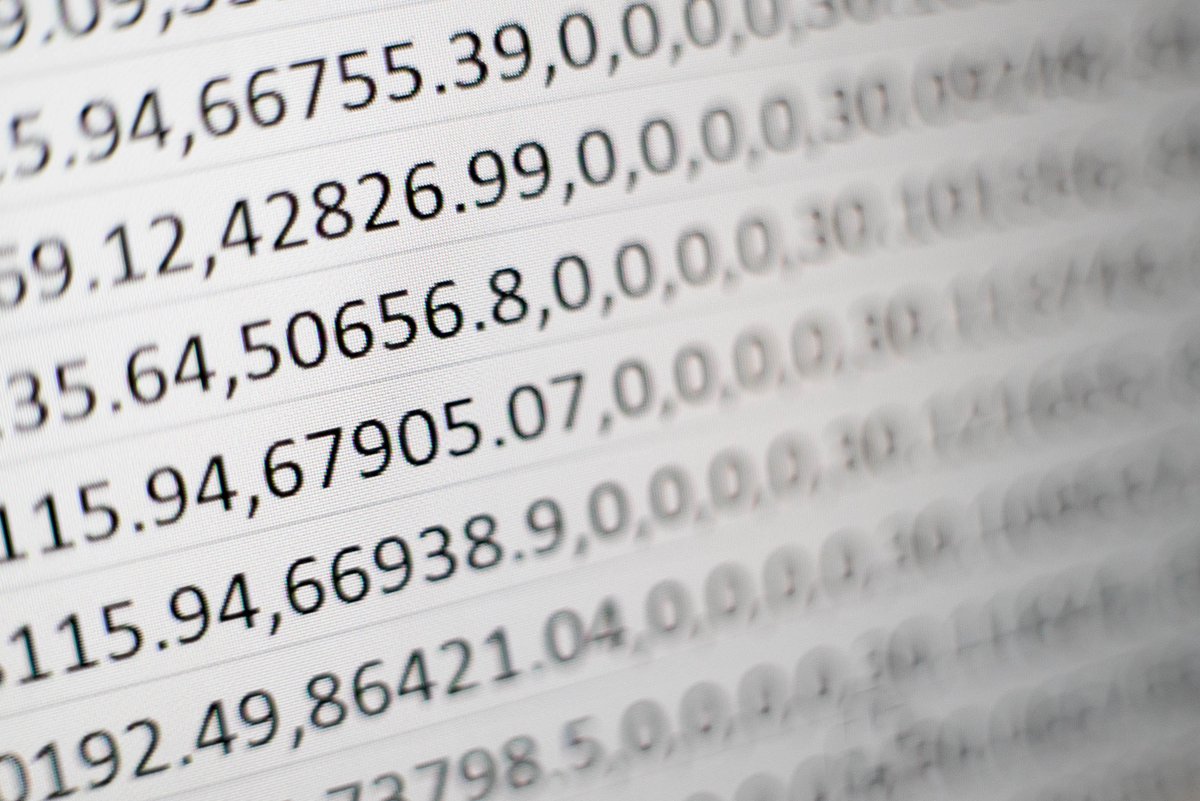
When the data looks too good to be true, it's time to put on your detective hat 🕵️♂️ 🔍 What can you do to double-check if the data is correct? ☑️ Outlier Detection ☑️ Data Validation ☑️ Statistical Analysis ☑️ Domain Expertise


United States Trends
- 1. #SmackDown 29.7K posts
- 2. Gunther 17.4K posts
- 3. North Texas 5,935 posts
- 4. LA Knight 9,571 posts
- 5. Tulane 7,462 posts
- 6. #ROHFinalBattle 12.4K posts
- 7. #OPLive 1,873 posts
- 8. Kennesaw State 2,471 posts
- 9. Mark Pope 2,854 posts
- 10. Wes Miller N/A
- 11. Jalen Johnson 4,562 posts
- 12. Troy 13.4K posts
- 13. #BostonBlue 2,231 posts
- 14. John Cena 30.1K posts
- 15. SNME 5,641 posts
- 16. Jimmy Rogers 2,219 posts
- 17. Tre Carroll N/A
- 18. #TNAFinalResolution 3,781 posts
- 19. Gonzaga 4,868 posts
- 20. Red Velvet 14.1K posts
You might like
-
 DataCamp
@DataCamp -
 Renato Umeton, Ph.D.
@renato_umeton -
 ODSC (Open Data Science Conference) AI
@_odsc -
 Anaconda
@anacondainc -
 Sheamus McG
@sheamusmcgov -
 NumFOCUS
@NumFOCUS -
 Jedidiah Weller 👑
@jedihacks -
 Informatica
@Informatica -
 Analytics Vidhya
@AnalyticsVidhya -
 Marcus Borba
@marcusborba -
 DataKind
@DataKind -
 Talk Data to Me
@talkdatatomee -
 Keith Whitson
@keithwhitson -
 Ben Lorica 罗瑞卡
@bigdata -
 ModelOp
@ModelOp_Co
Something went wrong.
Something went wrong.